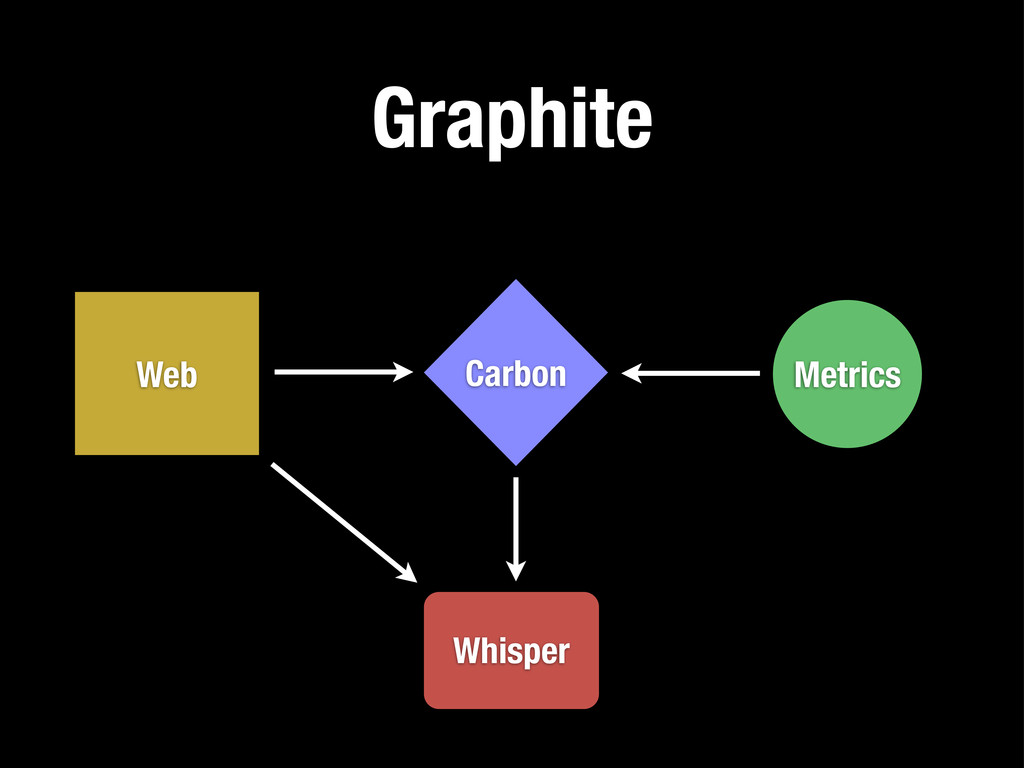
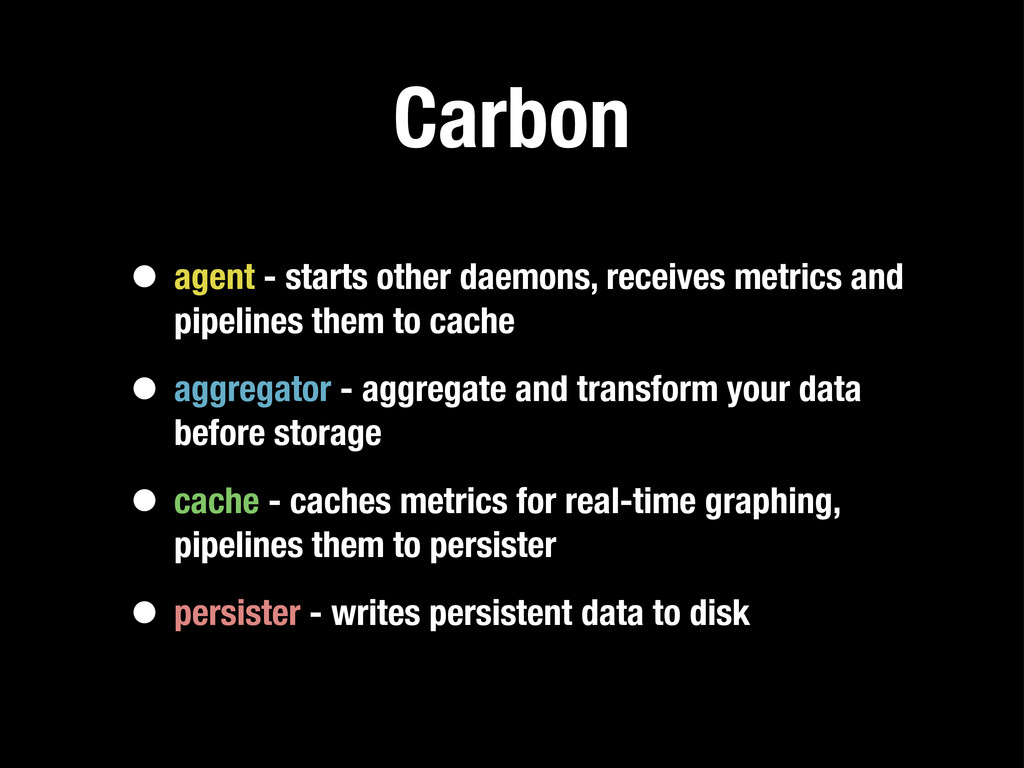
pipelines them to cache • aggregator - aggregate and transform your data before storage • cache - caches metrics for real-time graphing, pipelines them to persister
pipelines them to cache • aggregator - aggregate and transform your data before storage • cache - caches metrics for real-time graphing, pipelines them to persister • persister - writes persistent data to disk
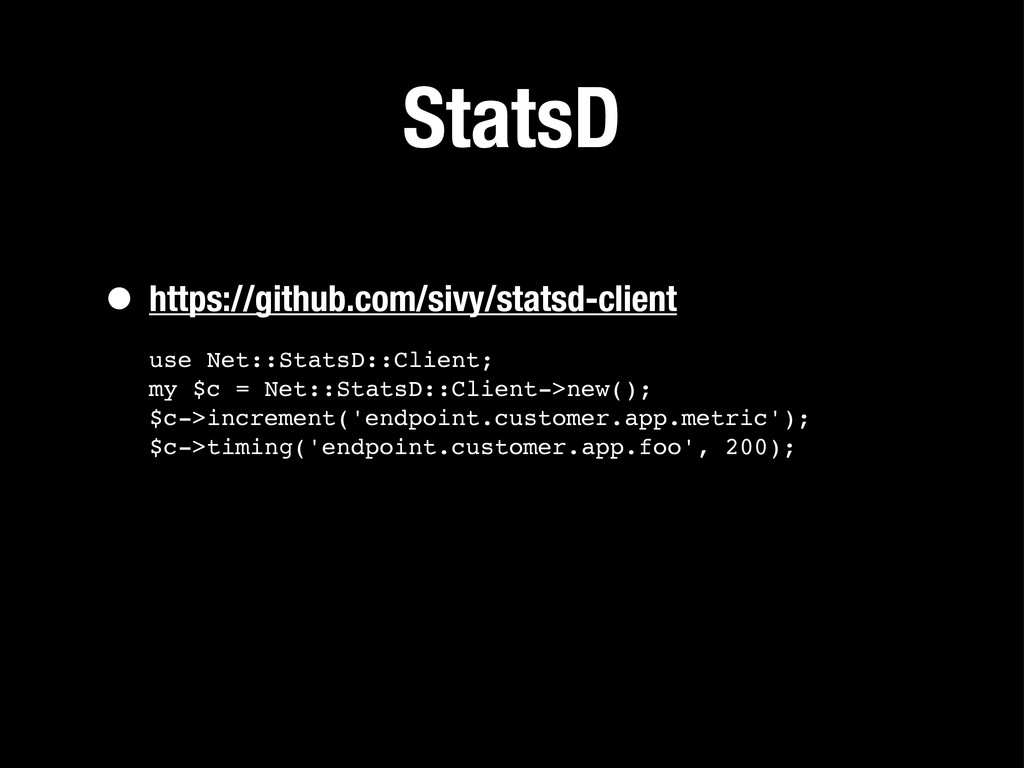
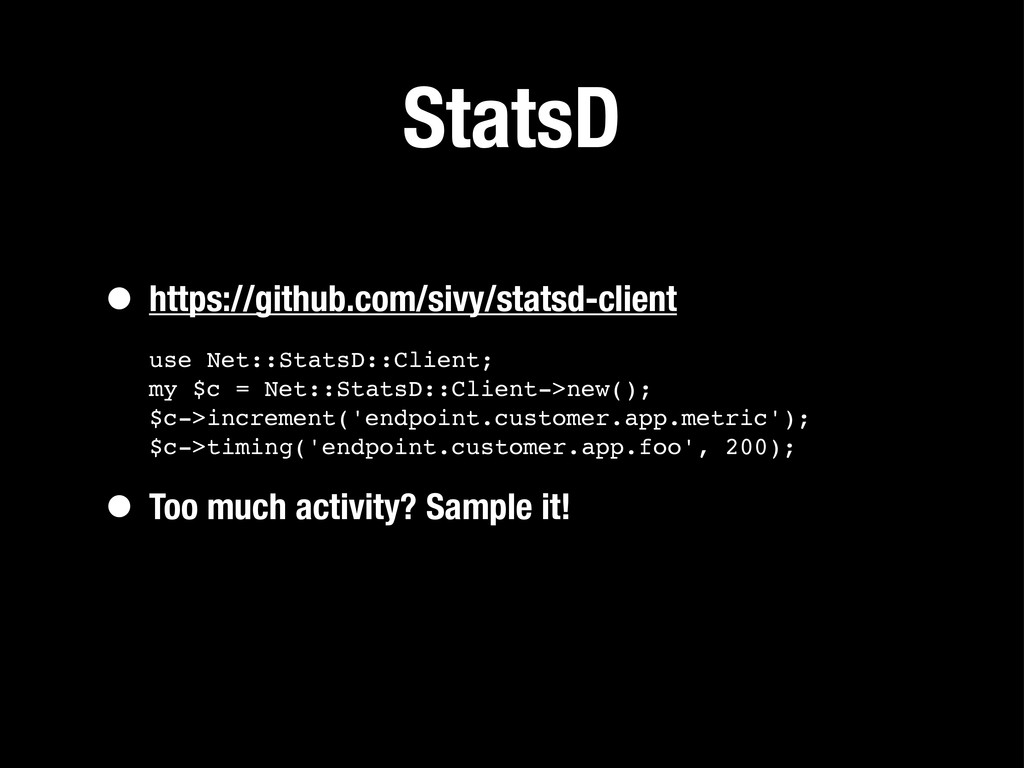
$c->timing('endpoint.customer.app.foo', 200); • Too much activity? Sample it! # sample 10%, StatsD will multiply it up $c->increment('endpoint.customer.app.metric', 0.1)