Upgrade to Pro — share decks privately, control downloads, hide ads and more …

Cells: Past, Present and Future - A co-evolution of algorithms and data in biology

Cells: Past, Present and Future - A co-evolution of algorithms and data in biology

Presentation on recent history of single-cell analysis and the co-evolution of algorithms and technological ability and scale. Presented at the Women in Machine Learning and Data Science Meetup in San Francisco, CA.

Olga Botvinnik

August 30, 2017
Tweet

More Decks by Olga Botvinnik

Other Decks in Science

Transcript

  1. Cells: Past, present, and future Olga Botvinnik, PhD Bioinformatics Scientist

    Chan Zuckerberg Biohub Women in Machine Learning and Data Science August 29th, 2017 twitter, github: @olgabot www: olgabotvinnik.com email: [email protected] These slides: bit.ly/olga-wimlds-2017
  2. Hello, I’m Olga. 2 I play cello I defended my

    Bioinformatics PhD in a Quinceañera dress I tried out for the Golden State Warriors Dance Team I studied in Math and Biological Engineering at MIT
  3. The human body contains an astounding number of cells, each

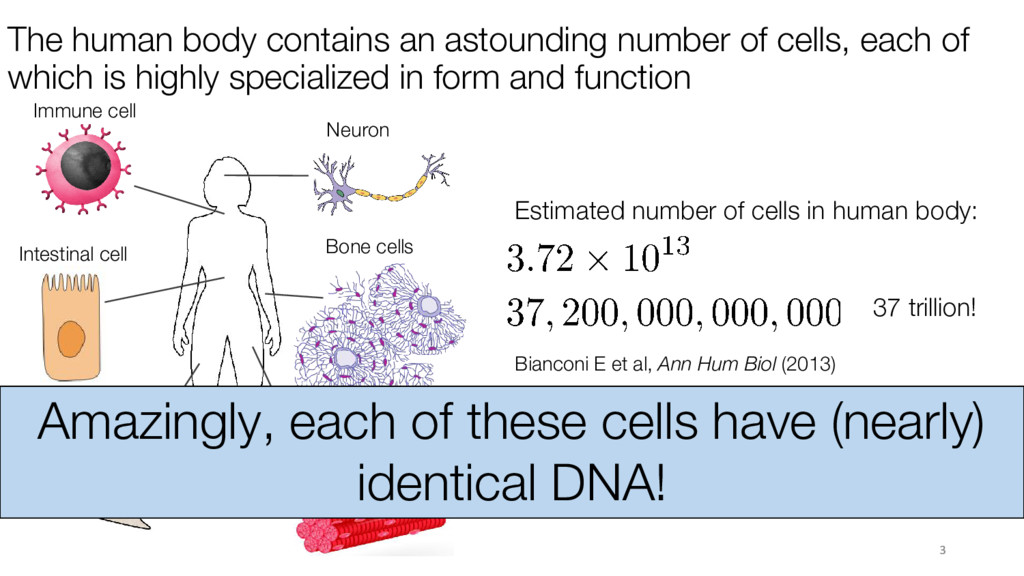
    of which is highly specialized in form and function Bianconi E et al, Ann Hum Biol (2013) Estimated number of cells in human body: 37 trillion! Neuron Immune cell Skin cells Muscle cell Bone cells Amazingly, each of these cells have (nearly) identical DNA! Intestinal cell
  4. Cells are the intermediate between DNA and phenotype Understanding cells

    is a key step in understanding genetic underpinnings of disease Aviv Regev 4
  5. Eventually, we want a generic cell type identifier 5 Cell

    Type Identifier ? Mystery Cell Cell Type “Neuron” Don’t have enough labeled data to create a robust classifier → Need to discover cell types
  6. Current computational analysis focuses on the creation of cell type

    labels 6 Unsupervised clustering Validation of clusters with orthogonal measurements Markers of cell type Complex tissue Macosko et al, Cell (2015) What, exactly, gets measured here?
  7. The central dogma of biology informs choice of measurement for

    cellular state DNA RNA Protein “Genome” “Transcriptome” “Proteome” RNA transcript Measuring “all”: DNA RNA Protein Difficulty of measurement Proximity to current cell state
  8. DNA (and RNA!) sequencing costs have recently plummeted thanks to

    technological innovation Moore’s law (silicon/computer innovation)
  9. The number of cells per dataset is growing exponentially, thanks

    to new cell capture technologies https://twitter.com/gheimberg/status/838534437390295040?s=09 9
  10. 2013 n=18 cells 2014 2015 2016 2017 2018 Studied mouse

    bone marrow dendritic cells (BMDCs) Scanning electron microscope image of BMDC Isolated single cells using micropipetting
  11. Naive methods were sufficient to dissect “mature” vs “maturing” immune

    cell populations Principal Component Analysis (PCA) - Linear dimensionality reduction algorithm (“smusher”) - Assumptions aren’t appropriate for single-cell data because: - <10% of molecules are captured - Data is mostly zeros (very sparse) - Data doesn’t follow a Gaussian (Normal/“Bell curve”) distribution 2013 n=18 cells 2014 2015 2016 2017 2018
  12. 2013 n=18 cells 2014 n=4000 cells 2015 2016 2017 2018

    Isolated single cells using Fluorescence-activated cell sorting (FACS) Studied mouse spleen
  13. Nonlinear “smusher” was necessary to dissect larger datasets 2013 n=18

    cells 2014 n=4000 cells 2015 2016 2017 2018 Circular projection - Nonlinear dimensionality reduction algorithm (“smusher”) - Forces the data into a circular configuration, which may not necessarily be consistent with the biology
  14. 2013 n=18 cells 2014 n=4000 cells 2015 n=40,000 cells 2016

    2017 2018 Isolated single cells using microdroplet methods
  15. Drop-Seq uses water-in-oil droplets to capture cells with marker beads

    2013 n=18 cells 2014 n=4000 cells 2015 n=40,000 cells 2016 2017 2018
  16. Capture of thousands of cells enabled interrogation of retinal cell

    types Macosko et al, Cell (2015) 2013 n=18 cells 2014 n=4000 cells 2015 n=40,000 cells 2016 2017 2018 Studied mouse retina 19
  17. Analysis of ~40,000 cells required more advanced, nonlinear methods to

    identify ~30 retinal cell types t-Distributed Stochastic Neighbor Embedding (tSNE) - Nonlinear “smusher” - Stochastic = every plot is randomly initialized and differs from run to run - Used as input to a density-based clustering algorithm, but is problematic as the location and exact composition of each blob changes between iterations 2013 n=18 cells 2014 n=4000 cells 2015 n=40,000 cells 2016 2017 2018 Macosko et al, Cell (2015) 20
  18. In February 2016, 10x Genomics released a commercial droplet product

    Chromium System Droplet-based cell capture 2013 n=18 cells 2014 n=4000 cells 2015 n=40,000 cells 2016 n=250k cells 2017 2018 22
  19. 23 Adamson and Norman et al, Cell (2016) 2013 n=18

    cells 2014 n=4000 cells 2015 n=40,000 cells 2016 n=250k cells 2017 2018 ICA = Independent Component Analysis Many cells enabled use of (1) Compressed sensing to impute missing data, and (2) ICA to find coordinately regulated genes Robust PCA is a compressed sensing algorithm which decomposes a matrix into a sum of low rank and sparse matrices
  20. 2013 n=18 cells 2014 n=4000 cells 2015 n=40,000 cells 2016

    n=250k cells 2017 n=1.3M cells 2018 2017 24
  21. Probabilistic models introduced to simultaneously impute missing data and assign

    cell labels 2013 n=18 cells 2014 n=4000 cells 2015 n=40,000 cells 2016 n=250k cells 2017 n=1.3M cells 2018 25 Azizi et al, Genomics and Computational Biology (2017)
  22. 2013 2014 2015 2016 2017 2018 Compressed sensing (e.g. robust

    PCA) Probabilistic imputation Manifold learning (e.g. TSNE) Nonlinear methods (e.g. circular projection) Naive, linear methods (e.g. PCA) 26 Deep learning? Summary of algorithm evolution in single-cell RNA-seq analyses
  23. 2013 2014 2015 2016 2017 2018 Fluorescence activated cell sorting:

    ~400 cells per experiment Microdroplets: ~1000 cells per experiment Figures from Kolodziejczyk et al, Molecular Cell (2015) Microfluidics: ~100 cells per experiment Micropipetting and micromanipulation: ~10 cells experiment Laser capture microdissection: ~10 cells per experiment 29
  24. To measure sequences in individual cells, need methods that capture

    one cell at a time FACS = Fluorescence-activated cell sorting
  25. Cells are defined by a few key features Aviv Regev

    Today’s talk will focus on technology that measures cell type 31
  26. Born: Khabarovsk, USSR Grew up: Eugene, OR Cambridge, MA: MIT

    2010 SB Mathematics SB Biological Engineering UC Santa Cruz 2012 MS Biomolecular Engineering and Bioinformatics UC San Diego 2017 PhD Bioinformatics and Systems Biology Today: Bioinformatics Scientist, Data Science Platform Chan Zuckerberg Biohub
  27. Eventually, we want a generic cell type identifier 33 Cell

    Type Identifier ? Mystery Cell Cell Type “Neuron” High Low Gene expression Transcriptional profile RNA-Seq Don’t have enough labeled data to create a robust classifier
  28. Largest single dataset: 68k mouse peripheral blood mononuclear cells (PBMCs),

    various immune-related cells 2013 n=18 cells 2014 n=4000 cells 2015 n=40,000 cells 2016 n=250k cells 2017 2018 CFG = Centrifuge RBC = Red Blood Cell 34
  29. High cell numbers require more sophisticated analysis techniques 2013 n=18

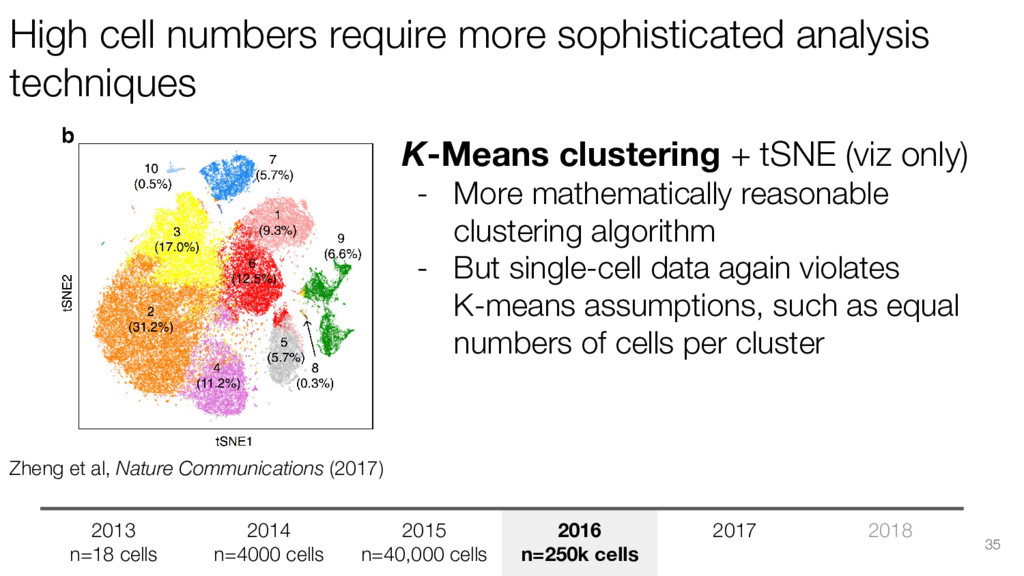
    cells 2014 n=4000 cells 2015 n=40,000 cells 2016 n=250k cells 2017 2018 Zheng et al, Nature Communications (2017) K-Means clustering + tSNE (viz only) - More mathematically reasonable clustering algorithm - But single-cell data again violates K-means assumptions, such as equal numbers of cells per cluster 35
  30. 1.3 Million cell dataset from mouse brain 2013 n=18 cells

    2014 n=4000 cells 2015 n=40,000 cells 2016 n=250k cells 2017 n=1.3M cells 2018 K-Means clustering + tSNE as before 36 Comparison of brain sizes
  31. 2013 n=18 cells 2014 n=4000 cells 2015 n=40,000 cells 2016

    n=250k cells 2017 n=1.3M cells 2018 n=10M cells? 2018? 37