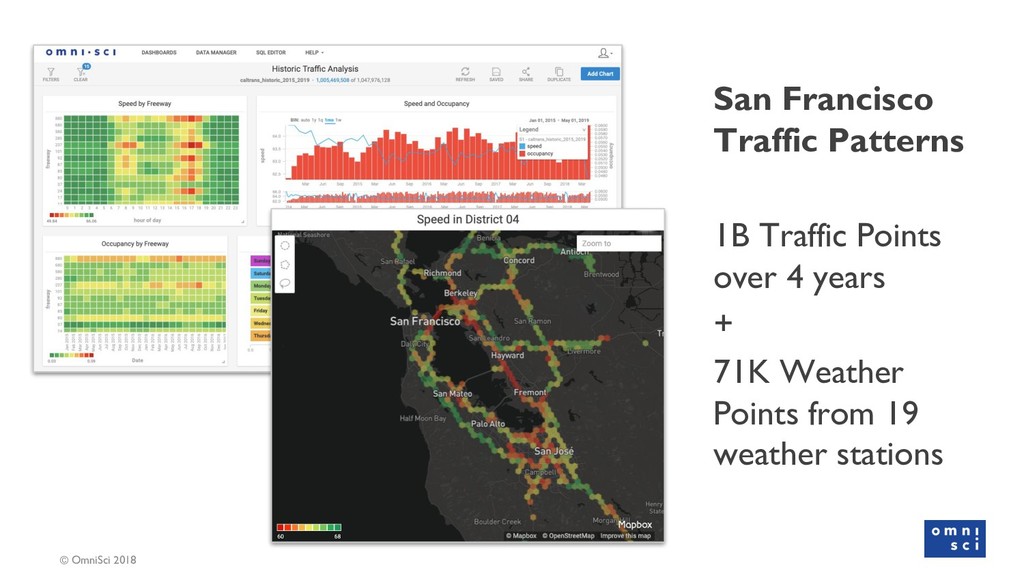
A rapid increase in population in the San Francisco Bay area has placed a strain on traffic flow on the major freeways which connect the region. In fact, San Francisco recently ranked 5th in the world for worst traffic congestion, leading to drivers spending countless useless hours on the road. Along with heavy traffic, adverse weather can further negatively impact driving conditions and cause heavy delays. Understanding traffic flow in different traffic situations and weather scenarios is the first step in reducing San Francisco’s traffic issue. A deep understanding of traffic could also benefit commuters as well as emergency services needing to reach their destination as quickly as possible.
However, analyzing large amounts of spatiotemporal data such as traffic and weather data has usually been considered tedious, difficult, and time-consuming. In this presentation, we’ll demonstrate how to use software tools from OmniSci, the pioneer in GPU-Accelerated analytics, to perform in-depth analysis on San Francisco’s traffic flow and find significant correlations between traffic congestion and weather.
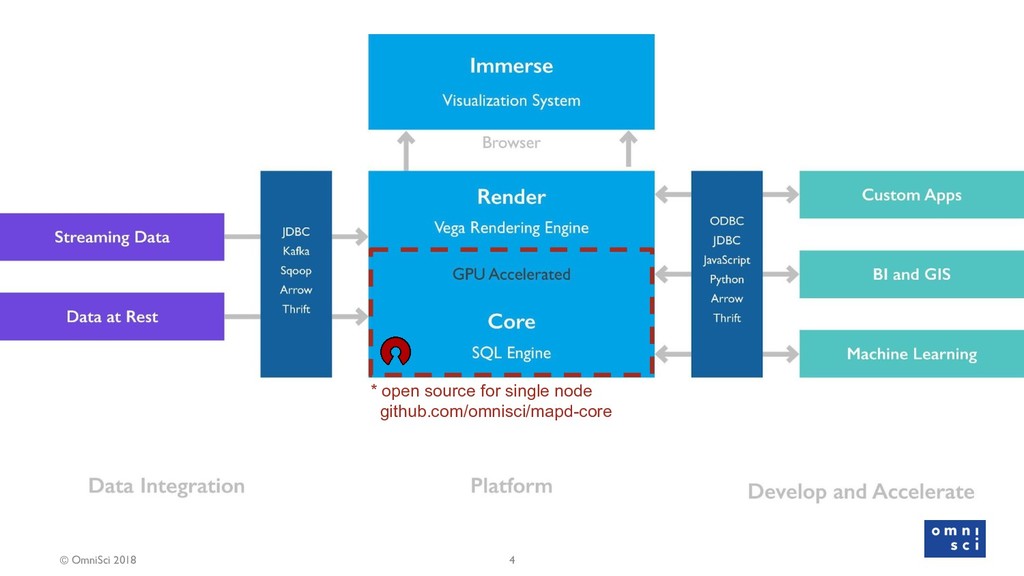
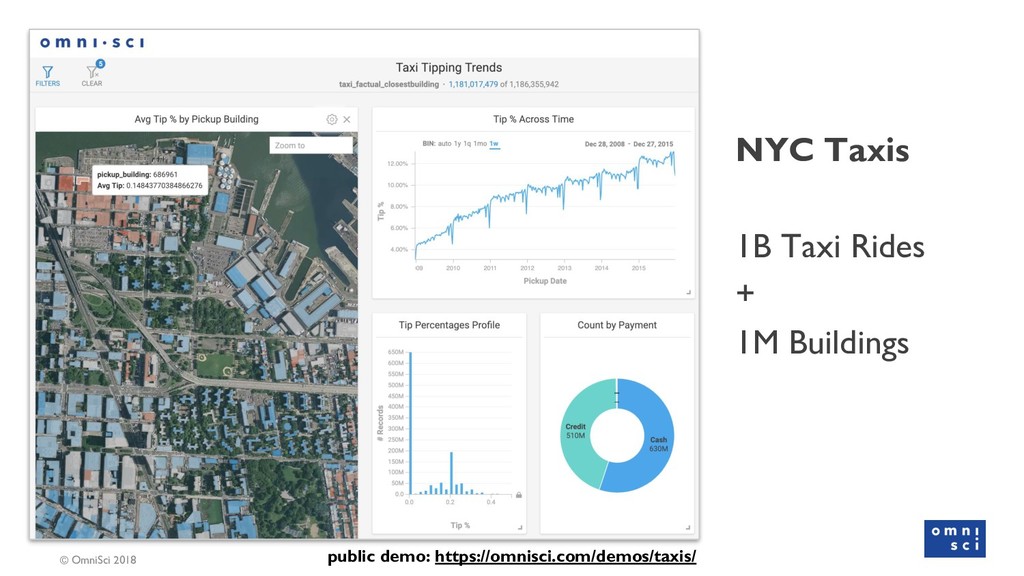
By using the Immerse visualization client, we’re able to explore how traffic is significantly affected by severe weather at peak travel times. OmniSci’s Core database makes uncovering spatiotemporal insights of millions of data points in real-time effortless, which allows us to identify key takeaways of San Francisco traffic. During the talk, we’ll interactively identify which freeways to avoid in heavy rain scenarios and what other weather phenomena could lead to traffic congestion. Finally, we’ll show how data processing and preparation can be done iteratively with visualization by connecting python with OmniSci’s database.
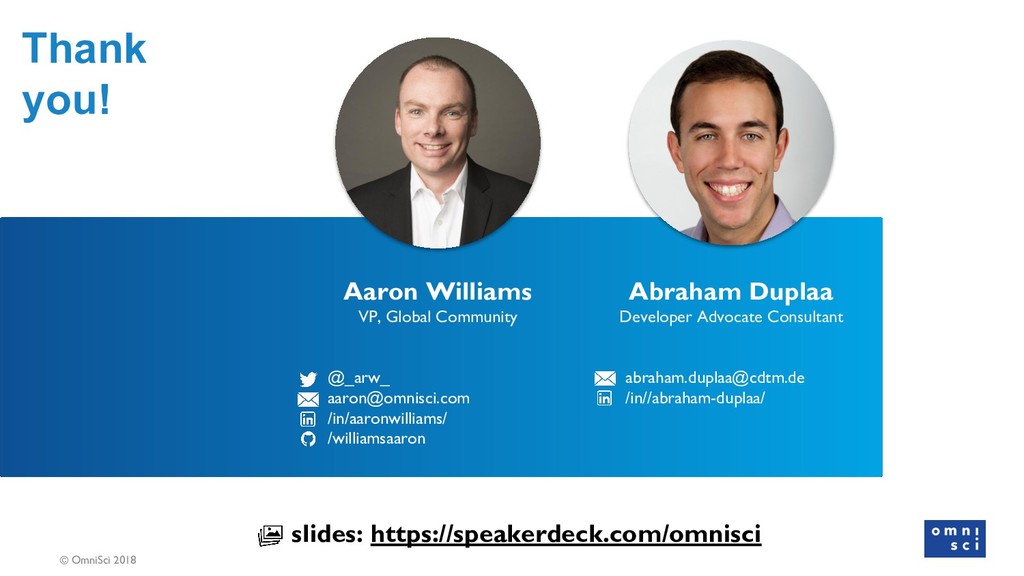
![© OmniSci 2018 Aaron Williams VP, Global Community @_arw_ [email protected]](https://files.speakerdeck.com/presentations/d5e073896fc146a1a08ffb1445c4b4a8/slide_1.jpg)