Upgrade to Pro
— share decks privately, control downloads, hide ads and more …
Speaker Deck
Sign up for free
Menu
Search
Features
All features
Private URLs
Password Protection
Custom URLS
Scheduled publishing
Remove Branding
Restrict embedding
Deck Collections
Notes
Features
All features
Private URLs
Password Protection
Custom URLS
Scheduled publishing
Remove Branding
Restrict embedding
Deck Collections
Notes
Explore
Featured decks
Featured speakers
Programming
Technology
Storyboards
Explore
Featured decks
Featured speakers
Programming
Technology
Storyboards
Pricing
Search
Sign in
Sign up for free
Paris container Day 2017 - End-to-end monitorin...
Search
Paris Container Day
June 13, 2017
Technology
25
0
Share
Embed
Copy iframe code
Copy JS code
Copy link
Start on current slide
Paris container Day 2017 - End-to-end monitoring with the Prometheus Operator - Max Inden, CoreOS
Paris Container Day
June 13, 2017
More Decks by Paris Container Day
See All by Paris Container Day
Paris container Day 2017 - Security in a containerized world - Jessie Frazelle, Google
pcd
0
12
Paris container Day 2017 - Living the Nomadic life - Nic Jackson, HashiCorp
pcd
0
20
Paris container Day 2017 - There is no container - Ori Pekelman, Platform.sh
pcd
0
72
Paris container Day 2017 - Advanced container scheduling on Amazon ECS with Blox - Julien Simon, AWS
pcd
0
30
Paris container Day 2017 - Production FS: Adapt or Die - Claudia Beresford & Tiago Scolari, Pivotal
pcd
0
19
Paris container Day 2017 - Monitoring et métrologie pour les containers - J.Raffre et J-P Thiery
pcd
0
19
Paris container Day 2017 - Nomad, l'orchestration made in HashiCorp - Bastien Cadiot, WeScale
pcd
0
16
Paris container Day 2017 - Using containers for Continuous Integration Delivery C-sanchez
pcd
0
17
Paris container Day 2017 - Red Hat OpenShift en prod : 7 pièges à éviter - A.Ben Aissi & E.Faure
pcd
0
27
Other Decks in Technology
See All in Technology
Active Record Connection Adaptersにおける長年の課題に再び取り組む
yahonda
0
150
サブエージェントと Claude Mods で作る独自 Advisor ツールの話
kenichiodo
2
160
AI × アーキテクト 第1・2章|生成AIの課題とアーキテクトの素養
daidaidai
0
170
実践!Cloud Run ハンズオン!! / Cloud Run handson
y0hgi
2
280
アウトプット初心者、半年間のふりかえり
4o1sobblue
0
430
20261017福岡devIO 「AIは"良いダッシュボード"を作れるか?
jtakeda
0
140
エンタメ企業のM&Aを支えるデータ基盤 ― 統合から店舗のリアルタイム分析まで / Data Engineering Summit 2026
genda
0
170
PHPカンファレンス関西の招待状 / Invitation to PHP Conference Kansai
ykanoh
0
110
スプシの手作業からの解脱 ~更新はClaude Codeに、見せ方と使い方はGASアプリに任せる~
kentarofujii
0
150
Code for Security プロジェクト紹介 2026年10月
yu23ki14
0
110
自作バイナリを動かす「入口」8選
puhitaku
2
1.3k
AI コーディングと人間の認知スループット / CTO Night & Day 2026 Morning Session / AI Coding and Human Cognitive Throughput
prog893
4
1k
Featured
See All Featured
Redefining SEO in the New Era of Traffic Generation
szymonslowik
1
480
Lightning Talk: Beautiful Slides for Beginners
inesmontani
PRO
2
730
Information Architects: The Missing Link in Design Systems
soysaucechin
1
1.2k
Designing Powerful Visuals for Engaging Learning
tmiket
1
610
How to build an LLM SEO readiness audit: a practical framework
nmsamuel
2
950
Building Flexible Design Systems
yeseniaperezcruz
330
41k
My Coaching Mixtape
mlcsv
0
360
HDC tutorial
michielstock
2
960
Tips & Tricks on How to Get Your First Job In Tech
honzajavorek
1
800
Unsuck your backbone
ammeep
672
58k
Building AI with AI
inesmontani
PRO
1
1.3k
Primal Persuasion: How to Engage the Brain for Learning That Lasts
tmiket
0
500
Transcript
End-to-end Monitoring with the Prometheus Operator By @mxinden
Max Inden Test-Engineer at CoreOS @mxinden
[email protected]
Secure, simplify and automate container infrastructure
Secure, simplify and automate container infrastructure
Secure, simplify and automate container infrastructure
Secure, simplify and automate container infrastructure
None
Why Monitoring?
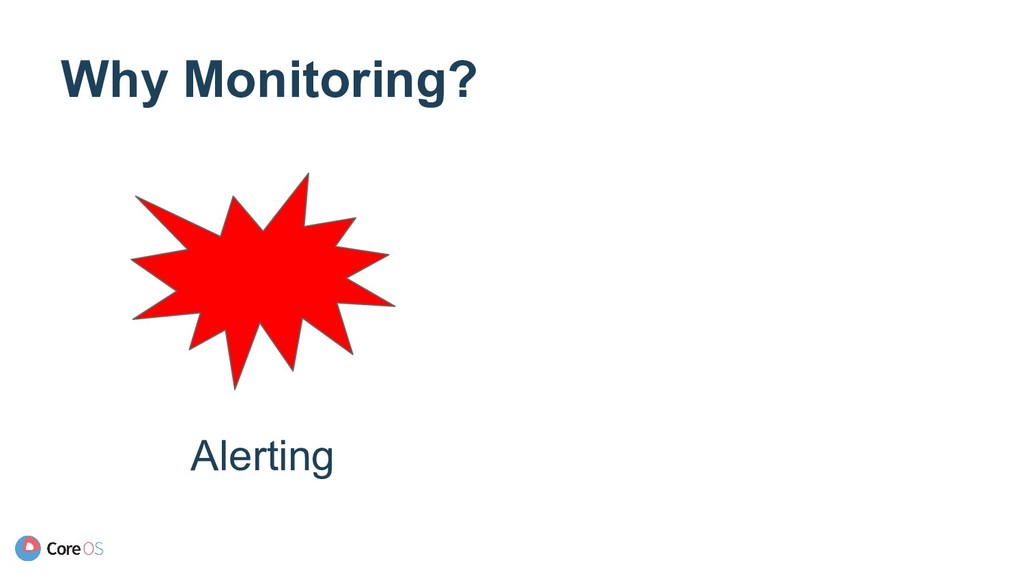
Why Monitoring? Alerting
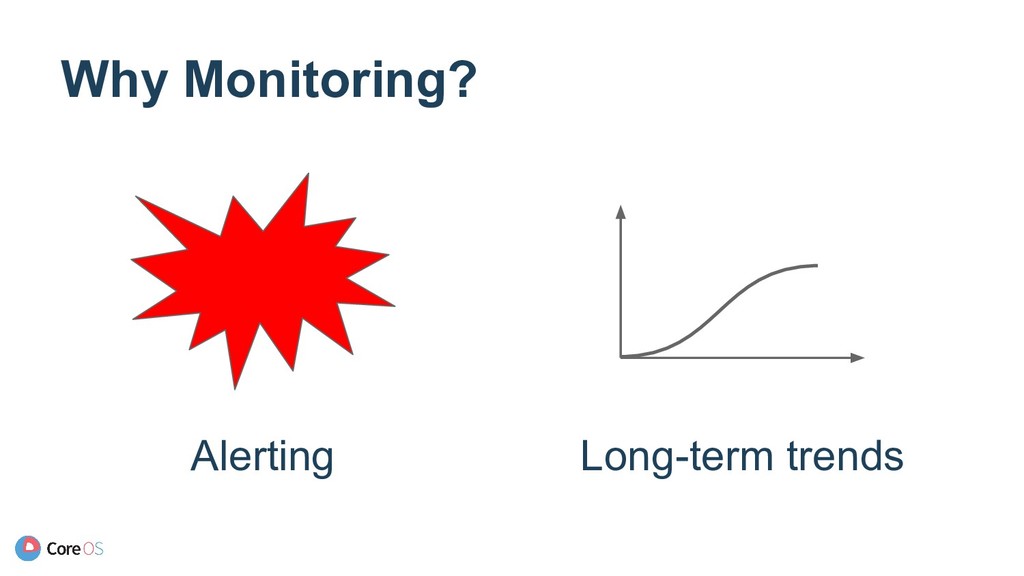
Why Monitoring? Long-term trends Alerting
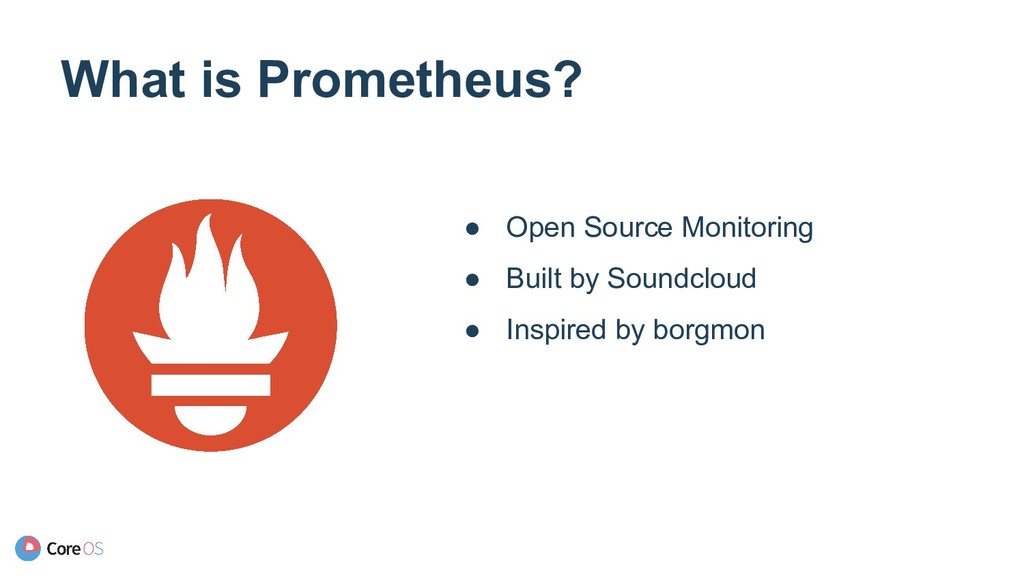
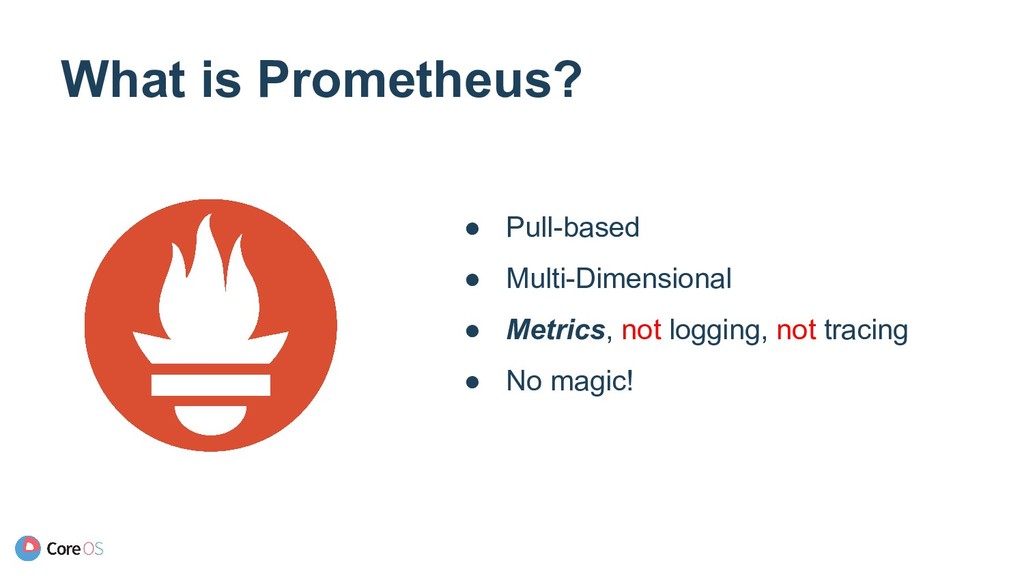
What is Prometheus? • Open Source Monitoring • Built by
Soundcloud • Inspired by borgmon •
What is Prometheus? • Pull-based •
What is Prometheus? • Pull-based • Multi-Dimensional •
What is Prometheus? • Pull-based • Multi-Dimensional • Metrics, not
logging, not tracing •
What is Prometheus? • Pull-based • Multi-Dimensional • Metrics, not
logging, not tracing • No magic! •
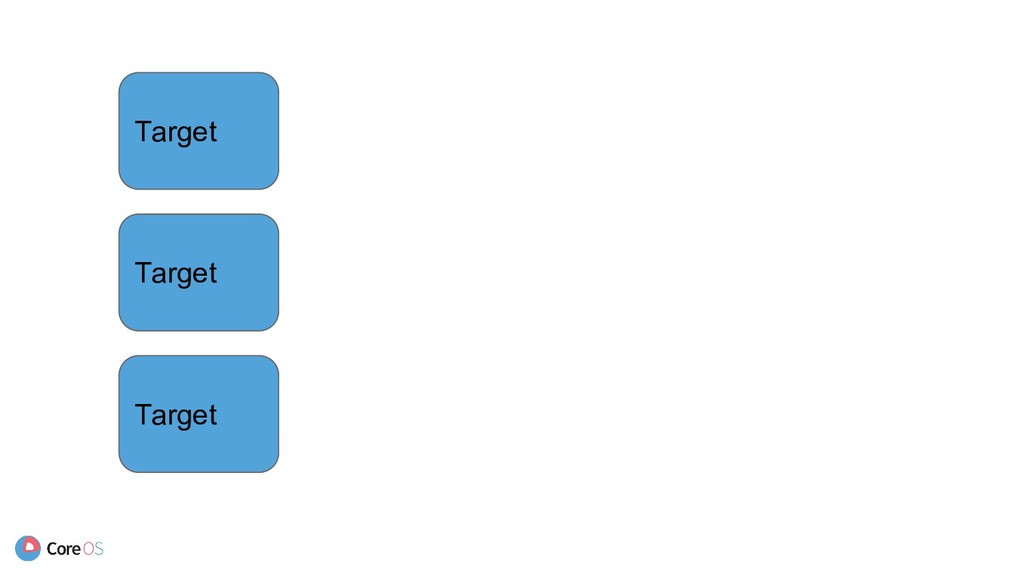
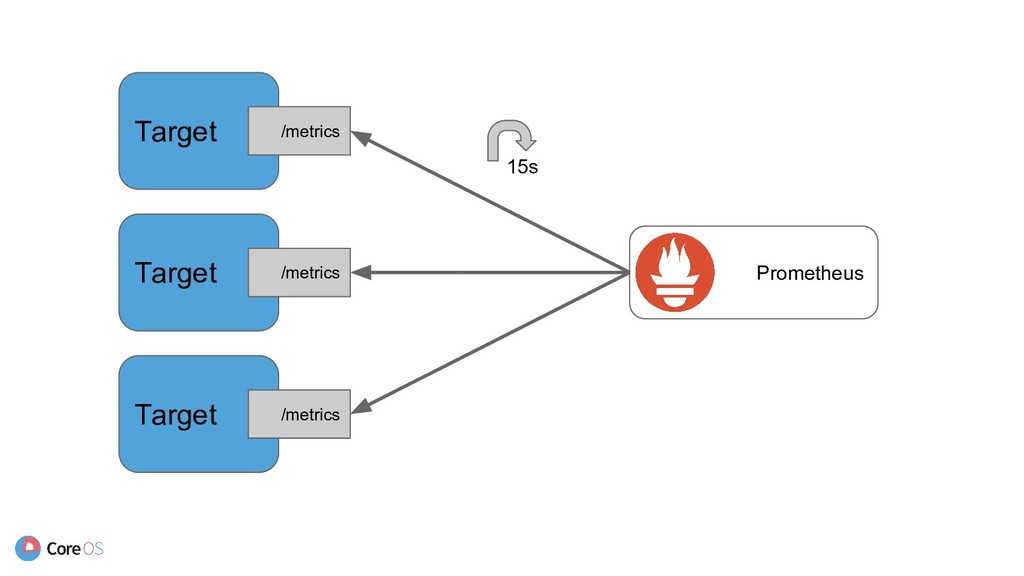
Target Target Target
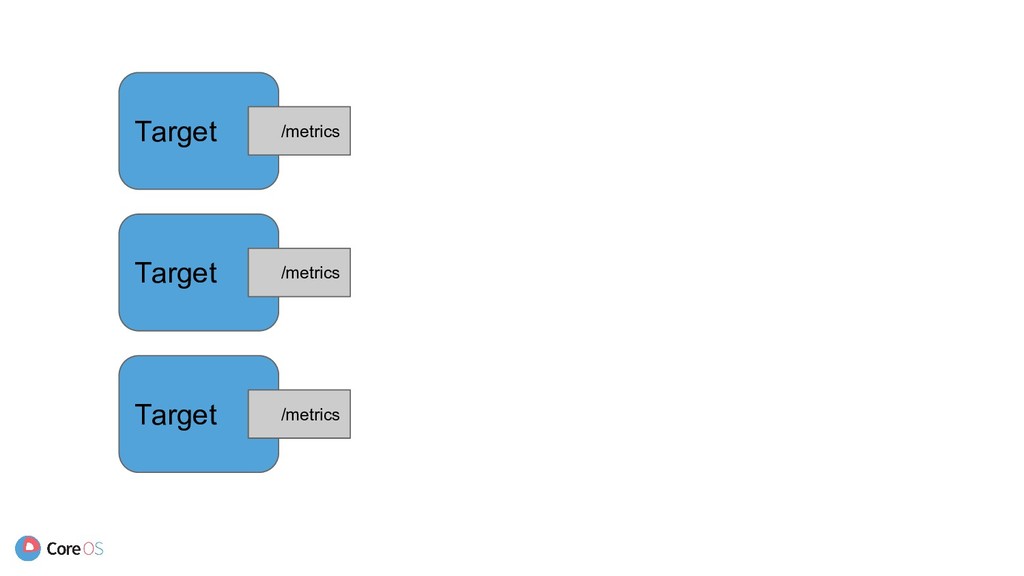
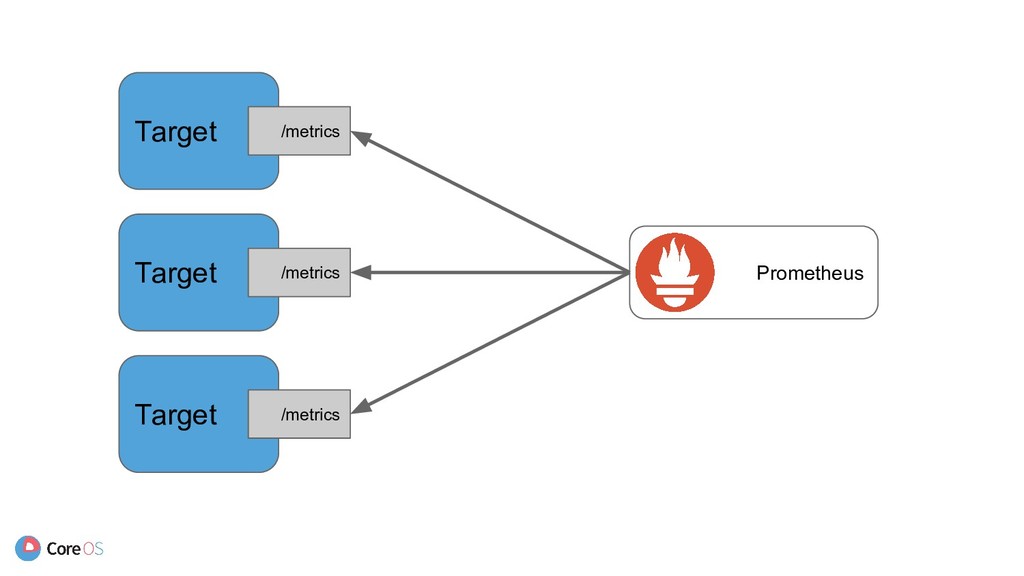
Target /metrics Target /metrics Target /metrics
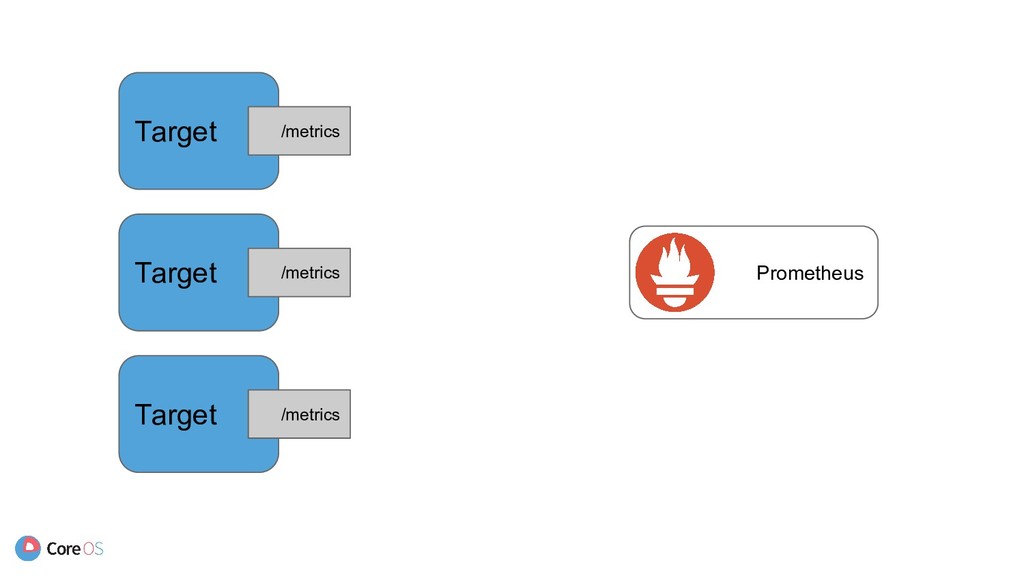
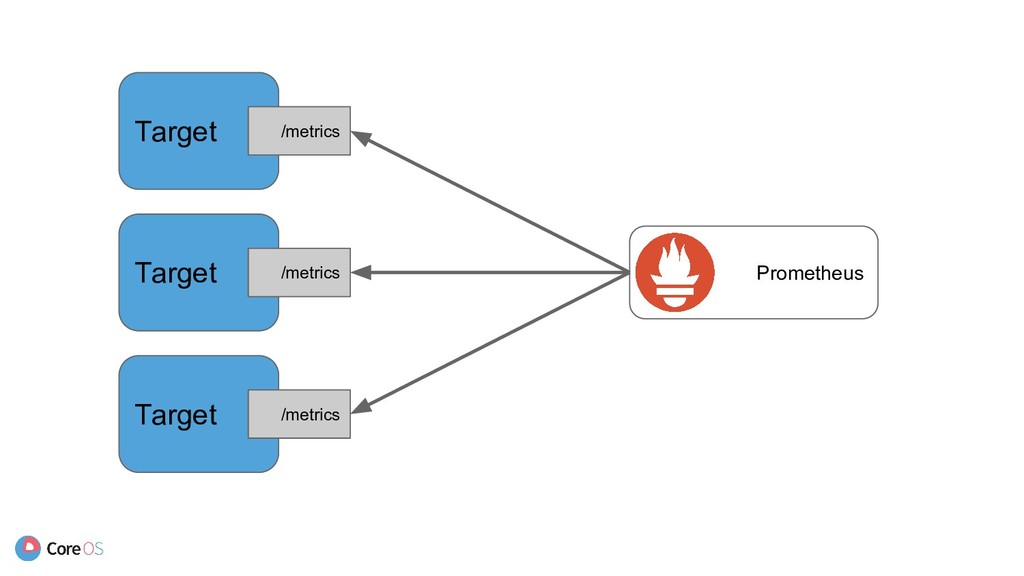
Prometheus Target /metrics Target /metrics Target /metrics
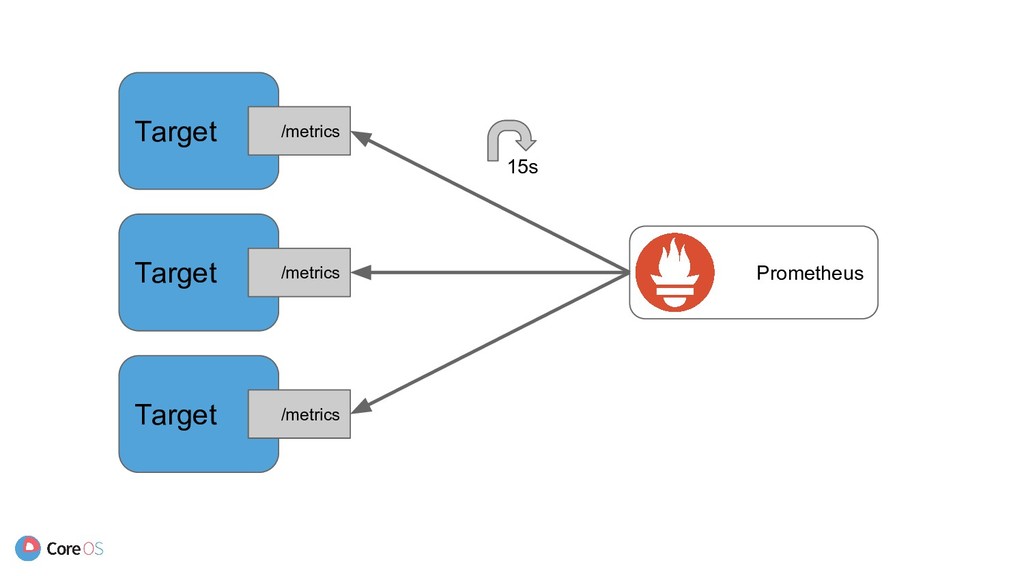
Prometheus Target /metrics Target /metrics Target /metrics 15s
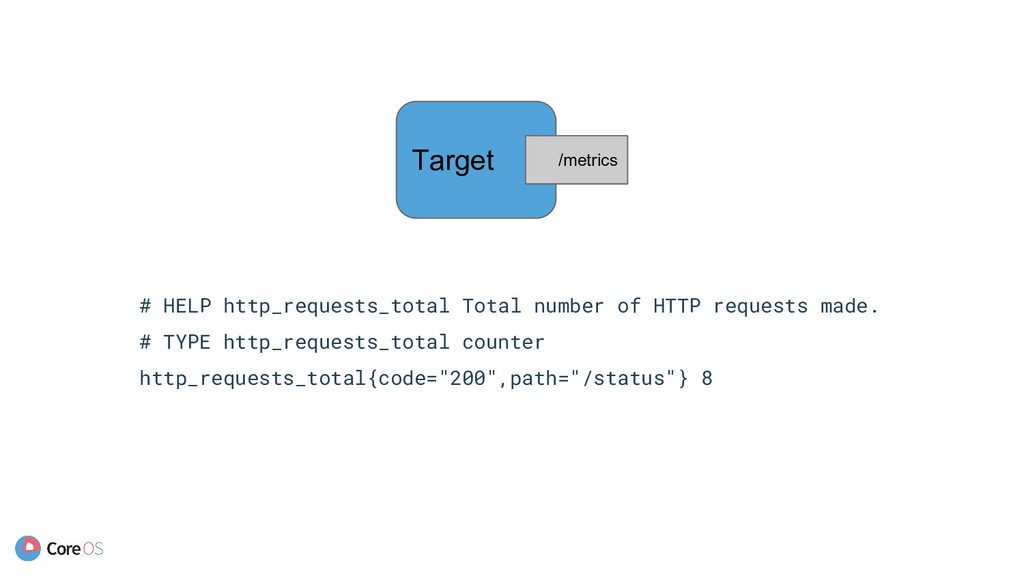
Target /metrics # HELP http_requests_total Total number of HTTP requests
made. # TYPE http_requests_total counter http_requests_total{code="200",path="/status"} 8
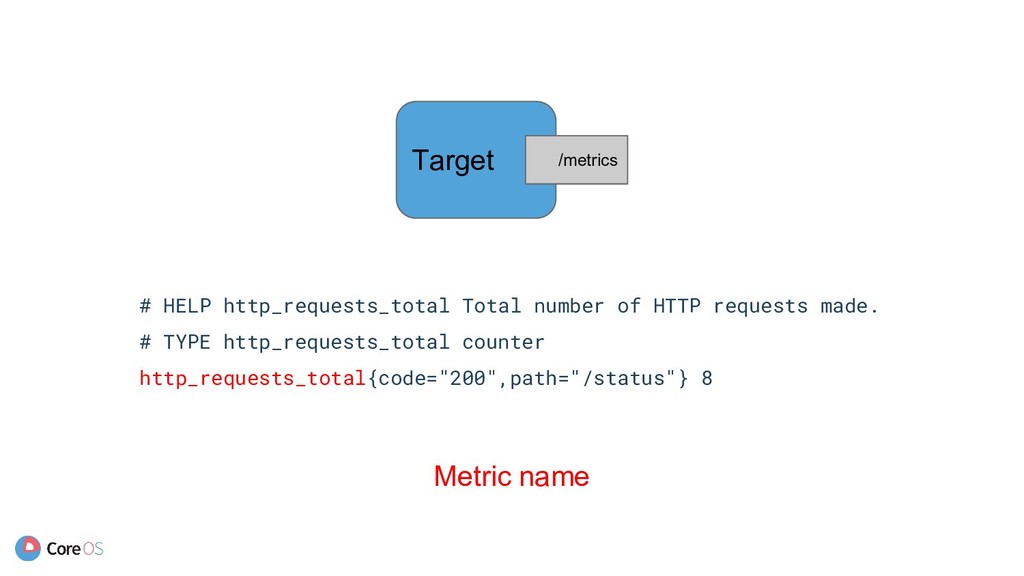
Target /metrics # HELP http_requests_total Total number of HTTP requests
made. # TYPE http_requests_total counter http_requests_total{code="200",path="/status"} 8 Metric name
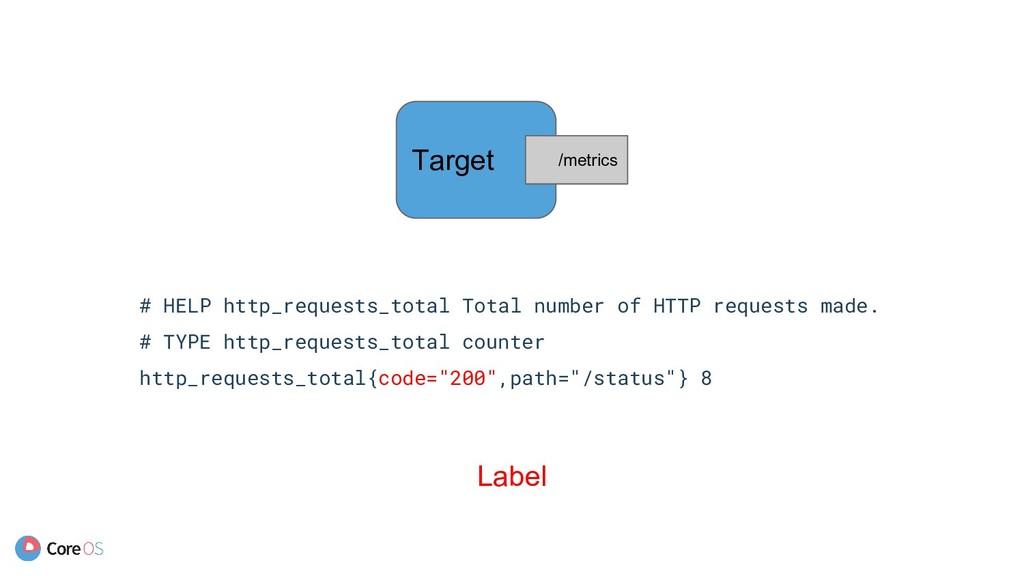
Target /metrics # HELP http_requests_total Total number of HTTP requests
made. # TYPE http_requests_total counter http_requests_total{code="200",path="/status"} 8 Label
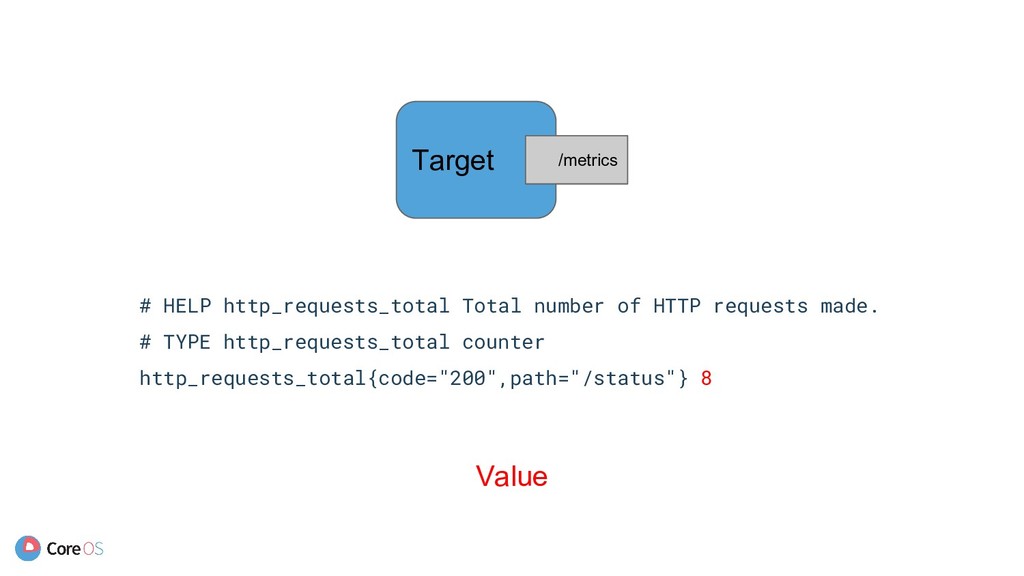
Target /metrics # HELP http_requests_total Total number of HTTP requests
made. # TYPE http_requests_total counter http_requests_total{code="200",path="/status"} 8 Value
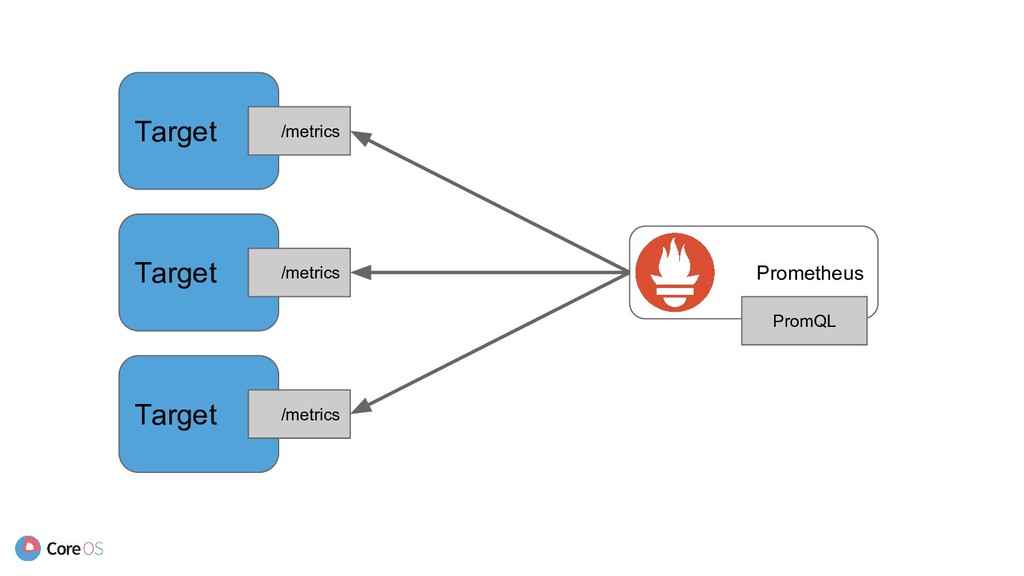
Prometheus Target /metrics Target /metrics Target /metrics
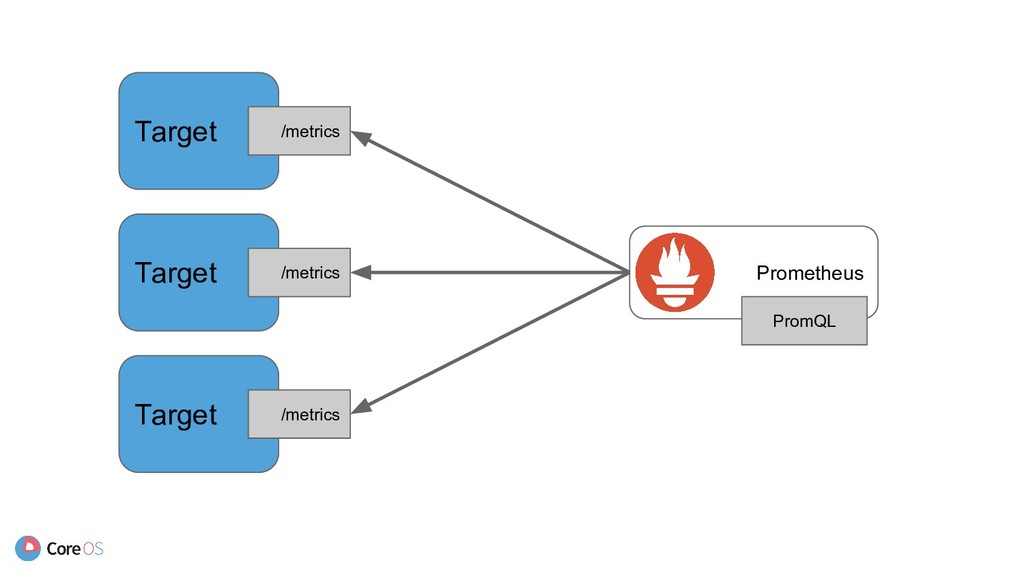
Prometheus Target /metrics Target /metrics Target /metrics PromQL
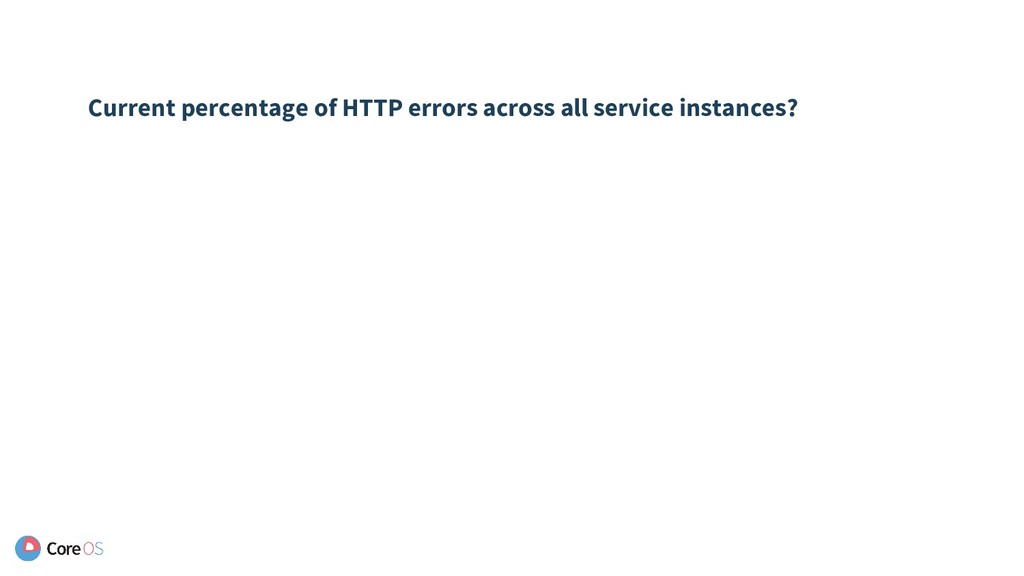
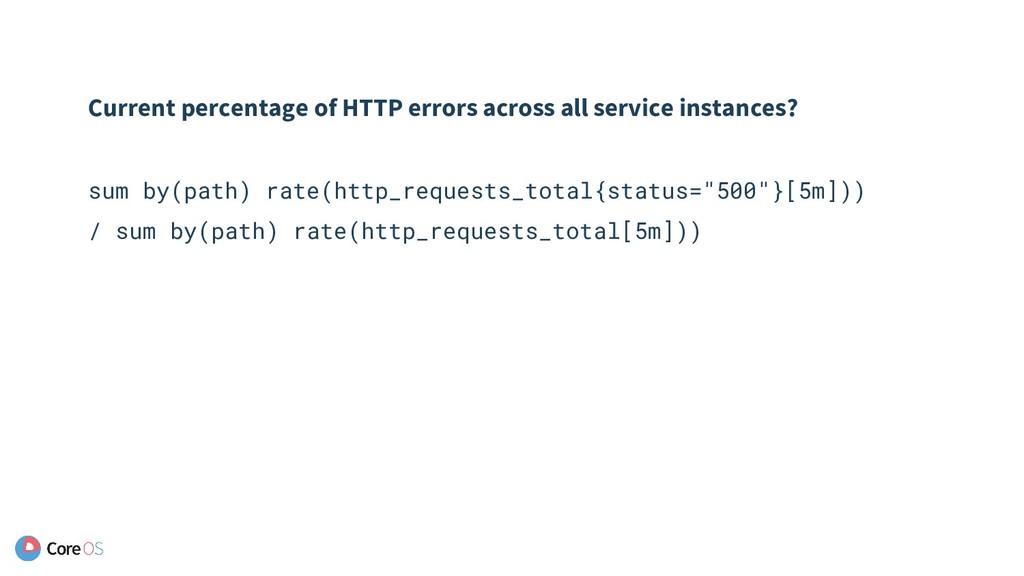
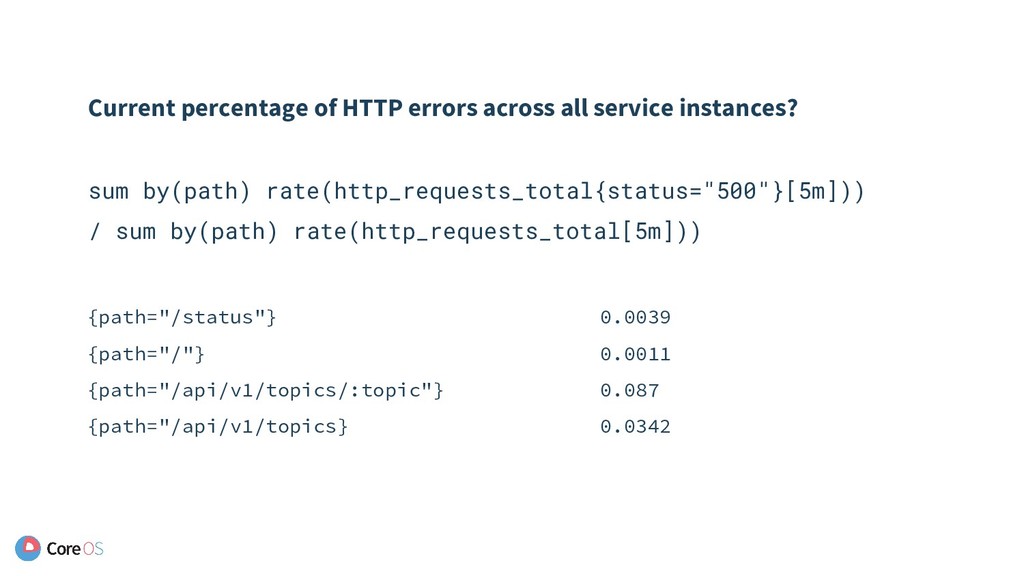
Current percentage of HTTP errors across all service instances?
Current percentage of HTTP errors across all service instances? sum
by(path) rate(http_requests_total{status="500"}[5m])) / sum by(path) rate(http_requests_total[5m]))
Current percentage of HTTP errors across all service instances? {path="/status"}
0.0039 {path="/"} 0.0011 {path="/api/v1/topics/:topic"} 0.087 {path="/api/v1/topics} 0.0342 sum by(path) rate(http_requests_total{status="500"}[5m])) / sum by(path) rate(http_requests_total[5m]))
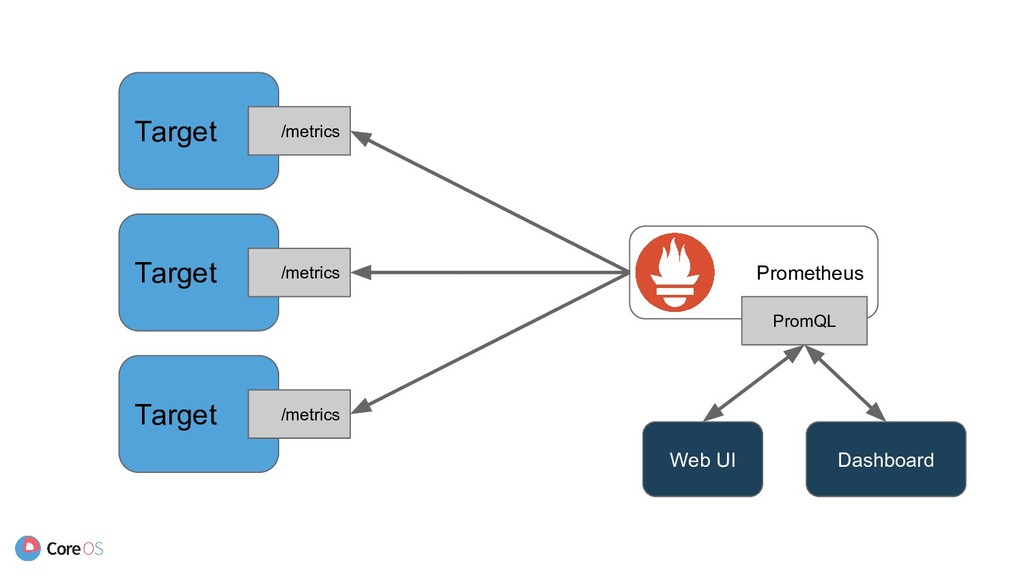
Prometheus Target /metrics Target /metrics Target /metrics PromQL
Prometheus Target /metrics Target /metrics Target /metrics PromQL Web UI
Dashboard
Prometheus Target /metrics Target /metrics Target /metrics
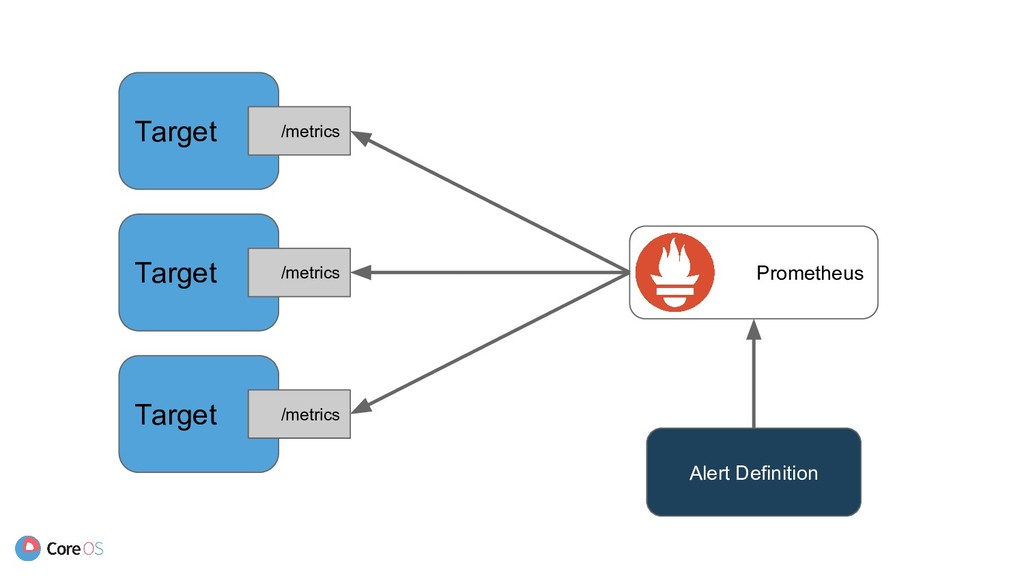
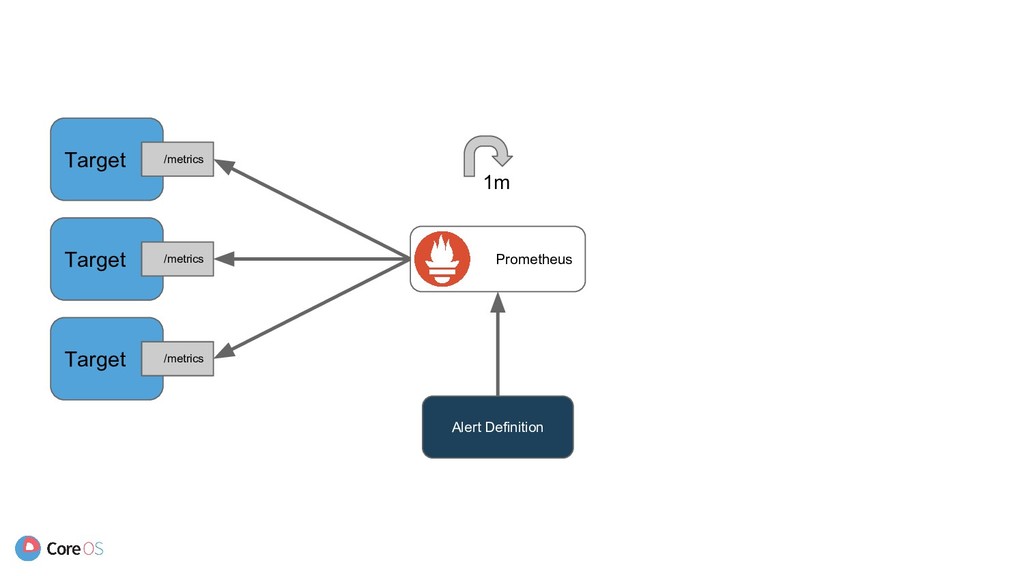
Prometheus Target /metrics Target /metrics Target /metrics Alert Definition
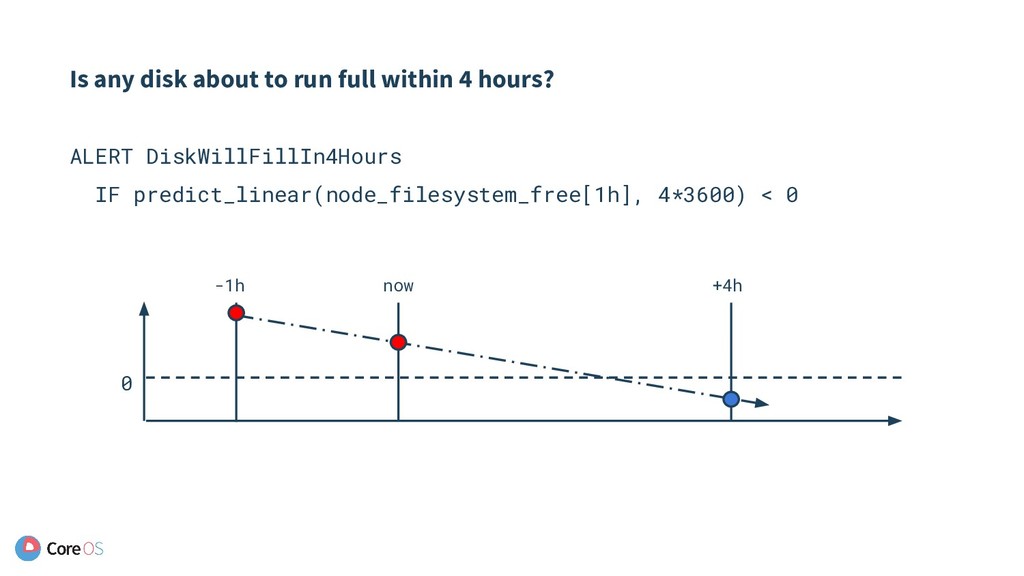
ALERT DiskWillFillIn4Hours IF predict_linear(node_filesystem_free[1h], 4*3600) < 0 Is any disk
about to run full within 4 hours? 0 now -1h +4h
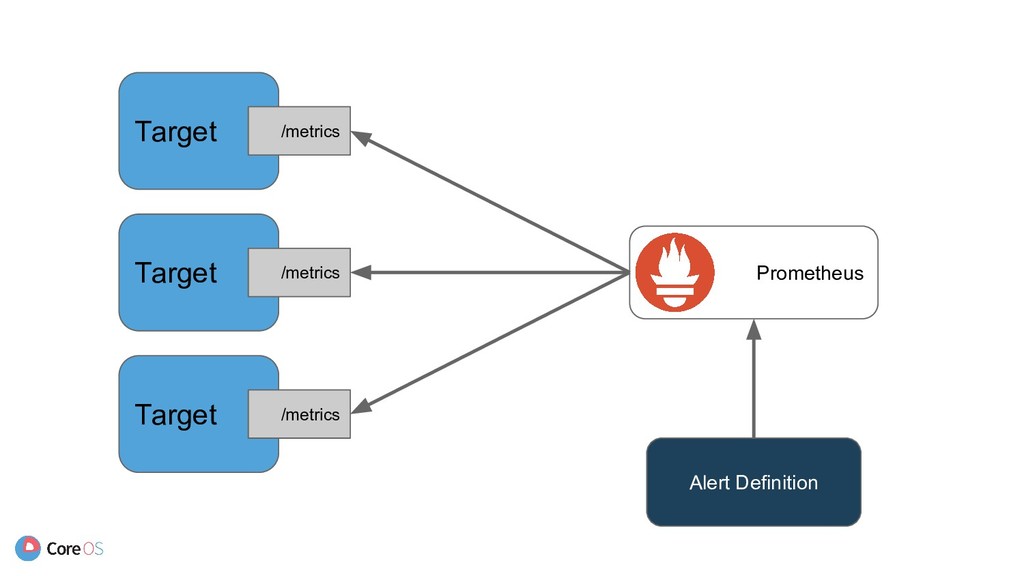
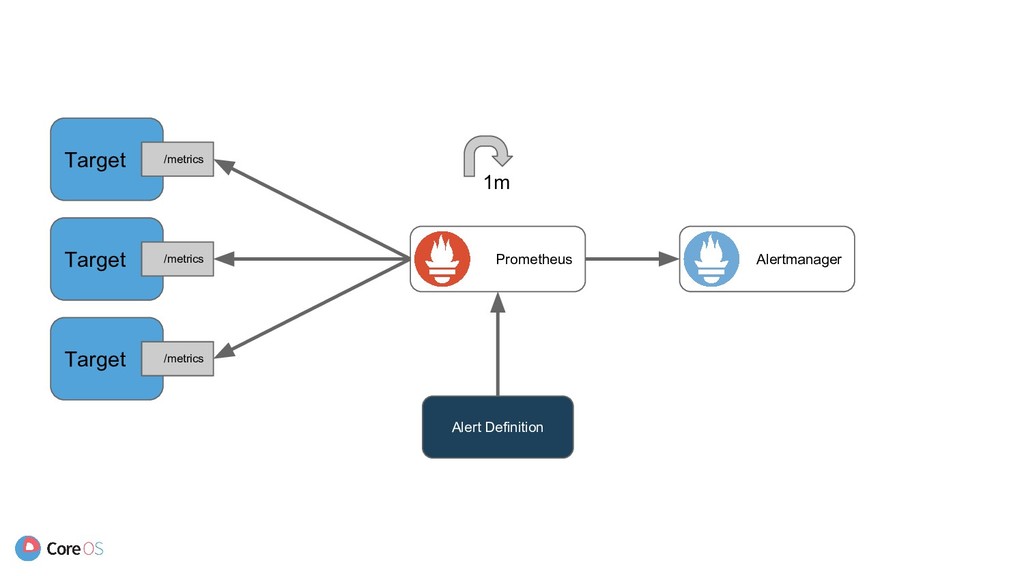
Prometheus Target /metrics Target /metrics Target /metrics Alert Definition
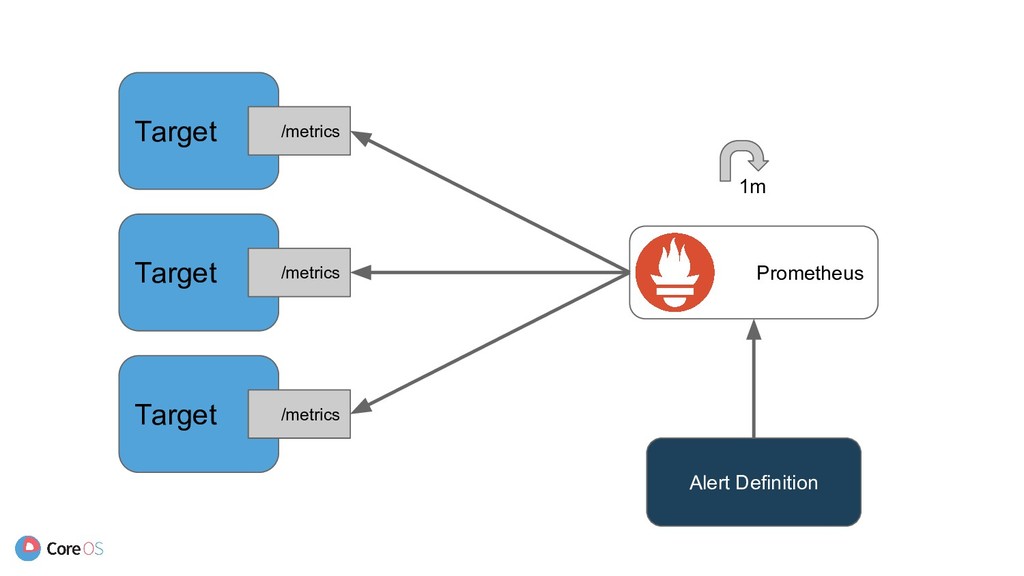
Prometheus Target /metrics Target /metrics Target /metrics Alert Definition 1m
Prometheus Target /metrics Target /metrics Target /metrics Alert Definition 1m
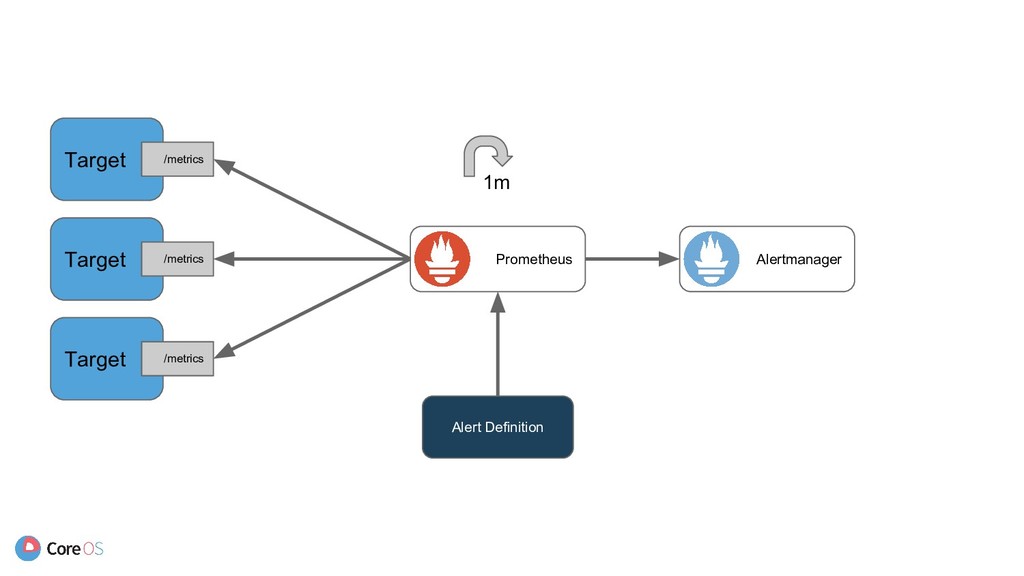
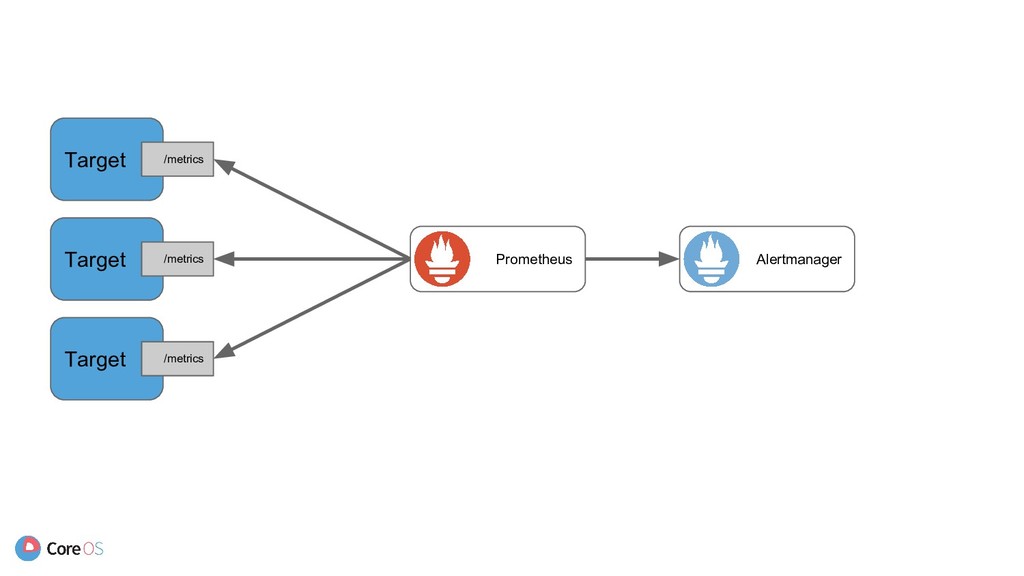
Prometheus Target /metrics Target /metrics Target /metrics Alert Definition Alertmanager
1m
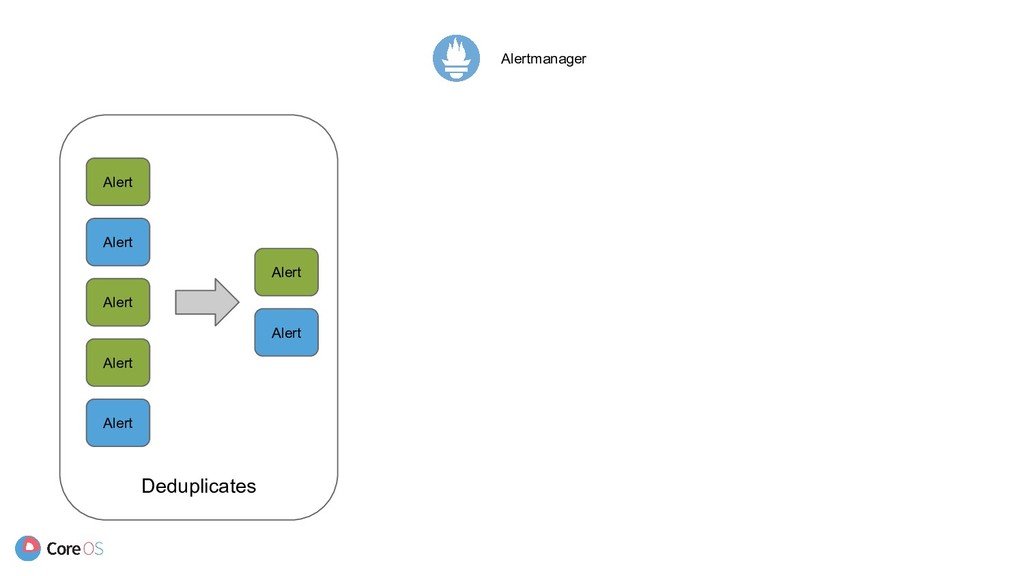
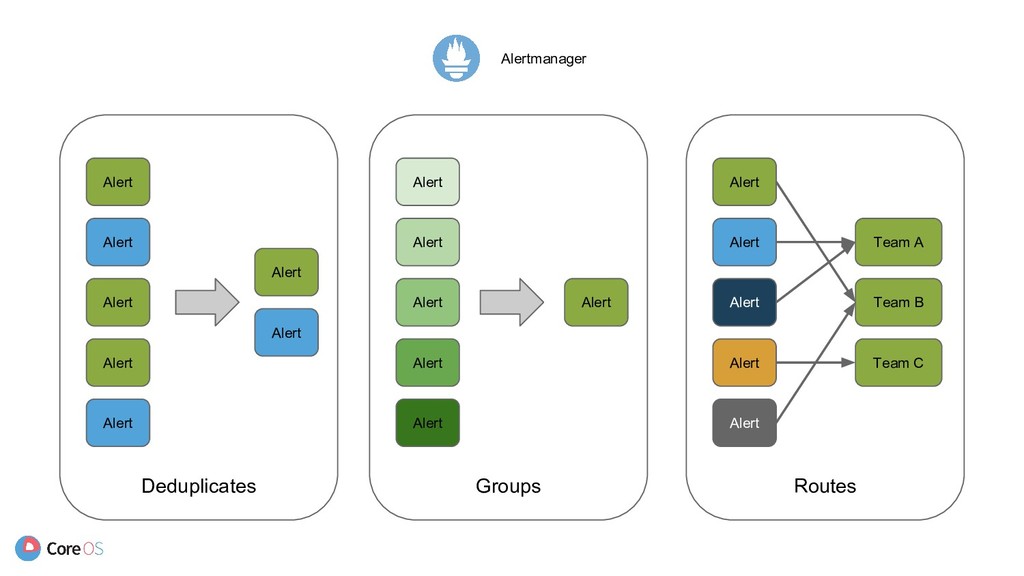
Alertmanager Deduplicates Alert Alert Alert Alert Alert Alert Alert
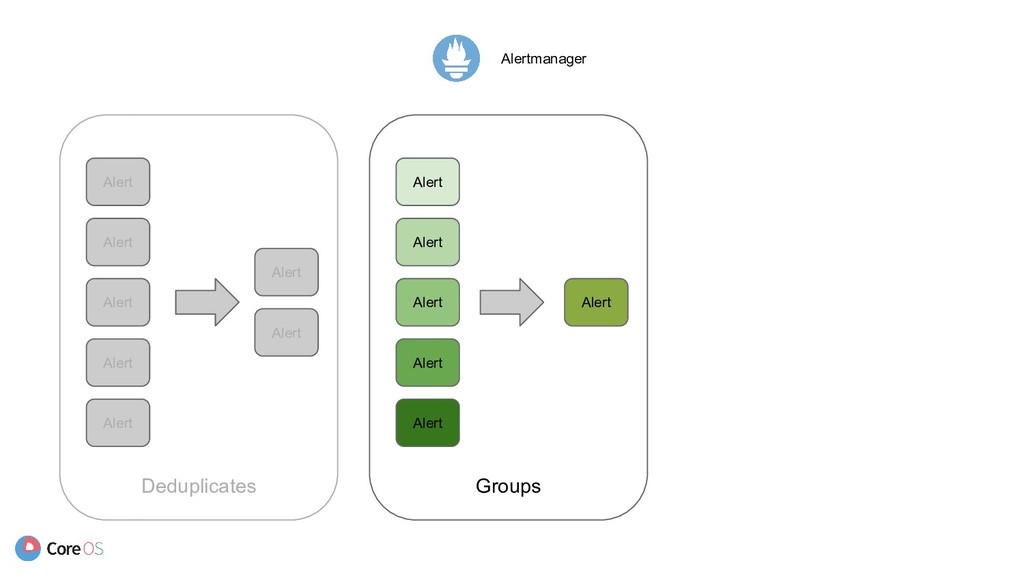
Alertmanager Deduplicates Alert Alert Alert Alert Alert Alert Alert Groups
Alert Alert Alert Alert Alert Alert
Alertmanager Deduplicates Alert Alert Alert Alert Alert Alert Alert Groups
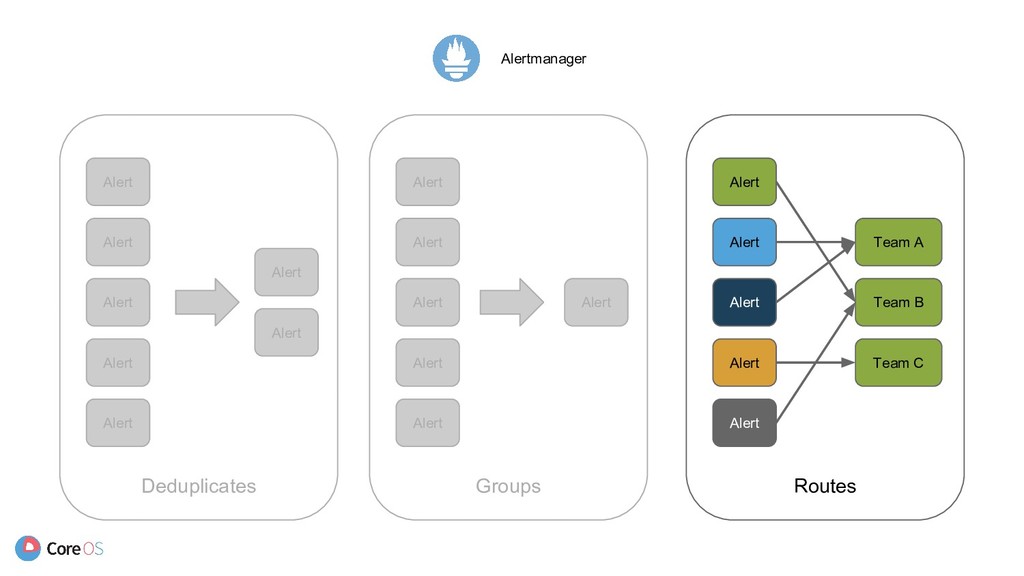
Alert Alert Alert Alert Alert Alert Routes Alert Alert Alert Alert Alert Team A Team B Team C
Alertmanager Deduplicates Alert Alert Alert Alert Alert Alert Alert Groups
Alert Alert Alert Alert Alert Alert Routes Alert Alert Alert Alert Alert Team A Team B Team C
Prometheus Target /metrics Target /metrics Target /metrics Alertmanager
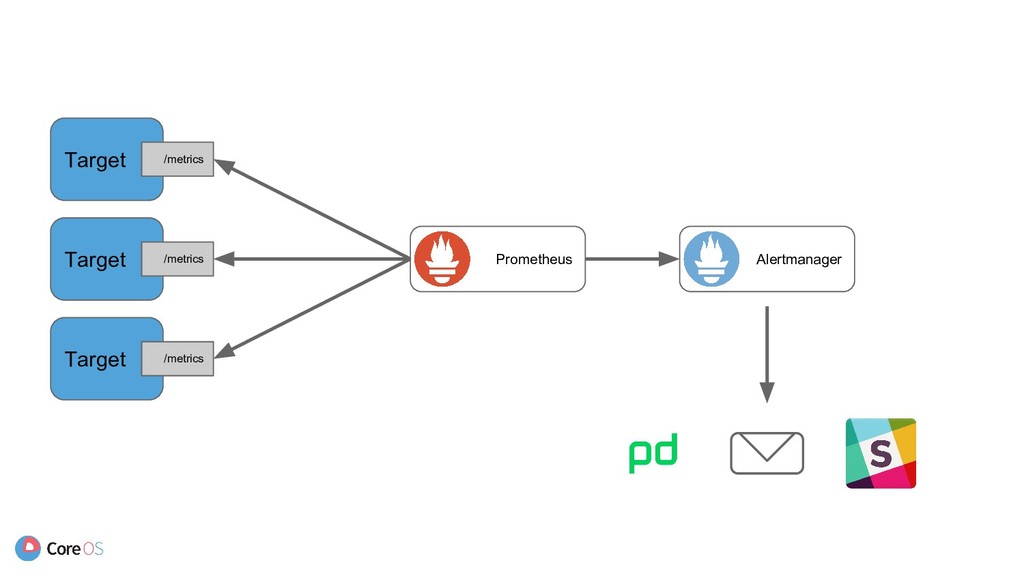
Prometheus Target /metrics Target /metrics Target /metrics Alertmanager
None
Monitoring
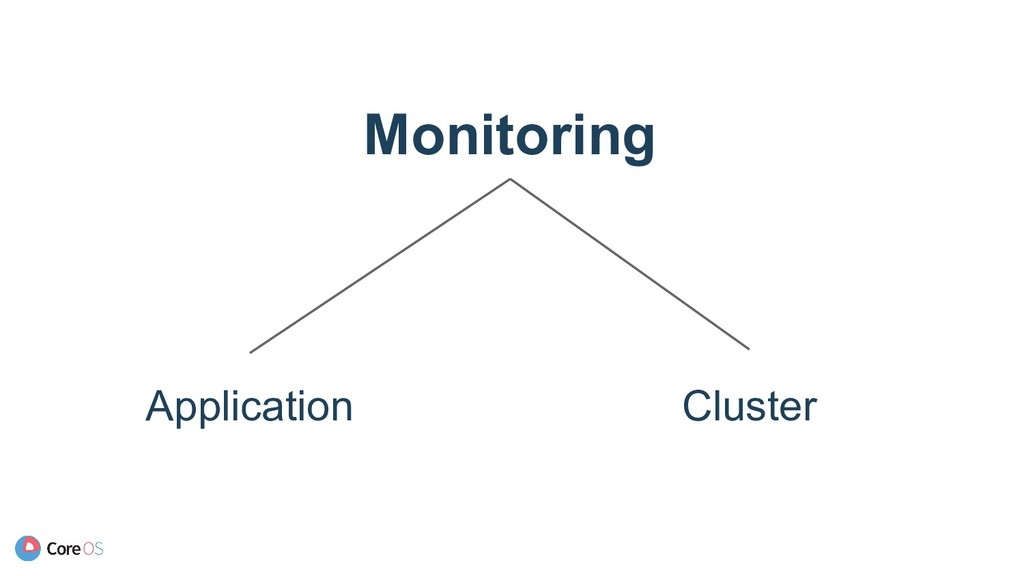
Application Cluster Monitoring
Cluster Monitoring
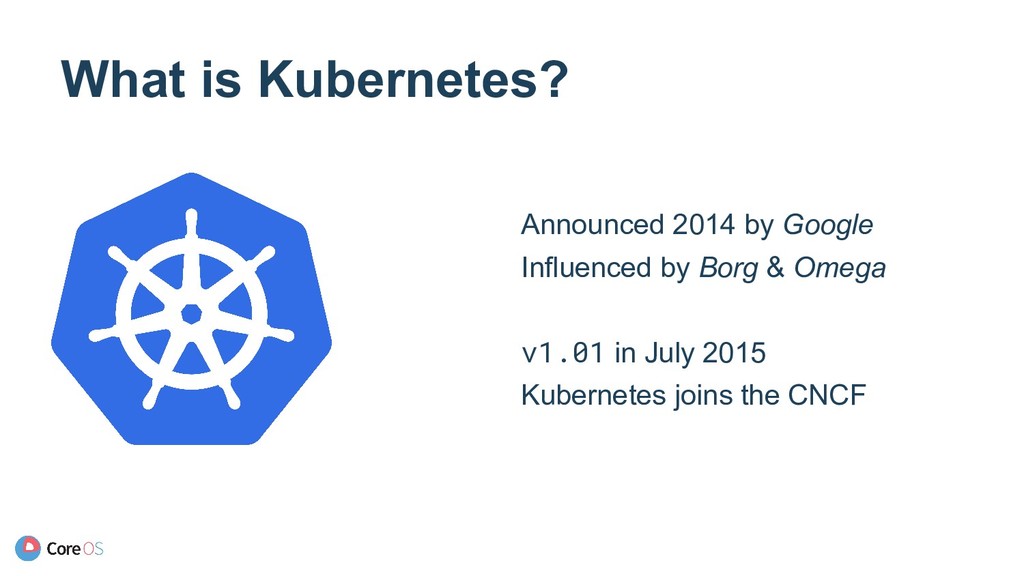
What is Kubernetes? Platform for running containerized applications
What is Kubernetes? Announced 2014 by Google Influenced by Borg
& Omega v1.01 in July 2015 Kubernetes joins the CNCF
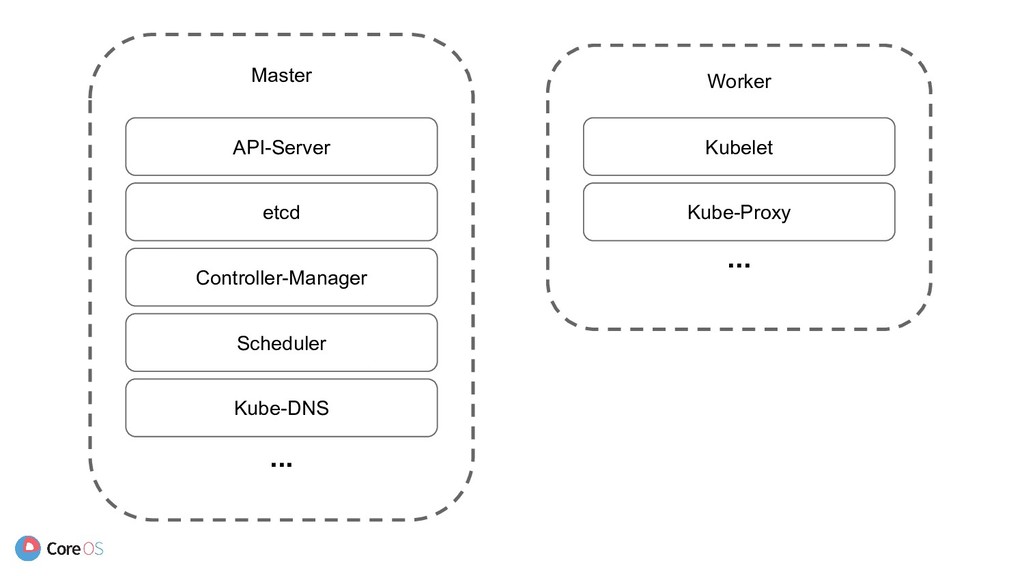
Master
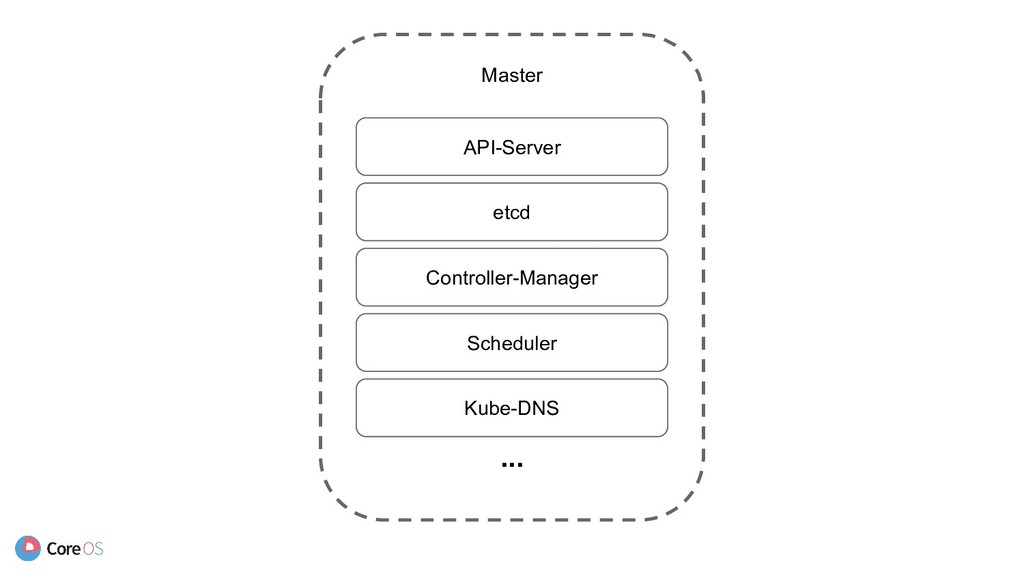
Master API-Server etcd Controller-Manager Scheduler Kube-DNS ...
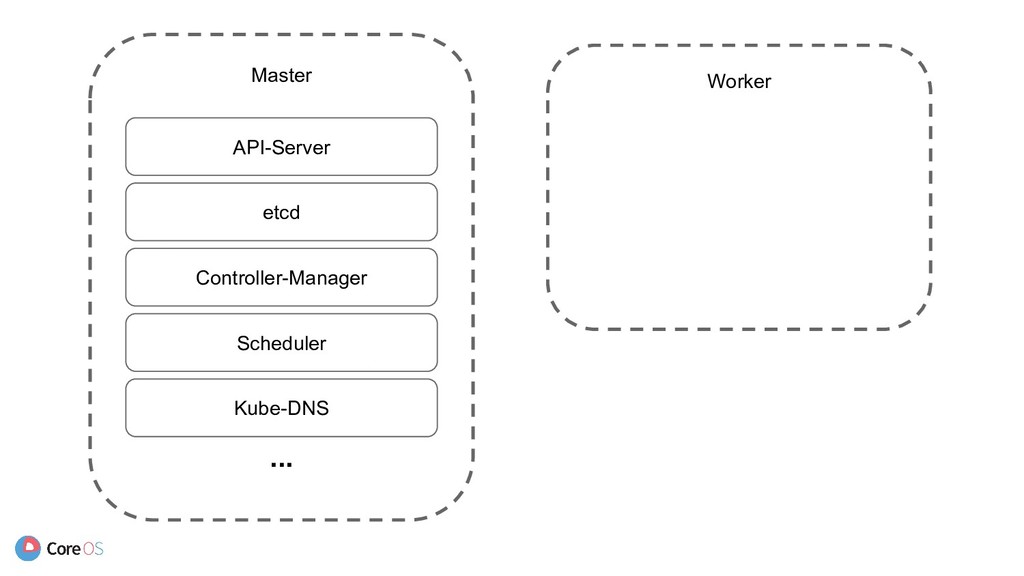
Master API-Server etcd Controller-Manager Scheduler Kube-DNS ... Worker
Master API-Server etcd Controller-Manager Scheduler Kube-DNS ... Worker Kubelet Kube-Proxy
...
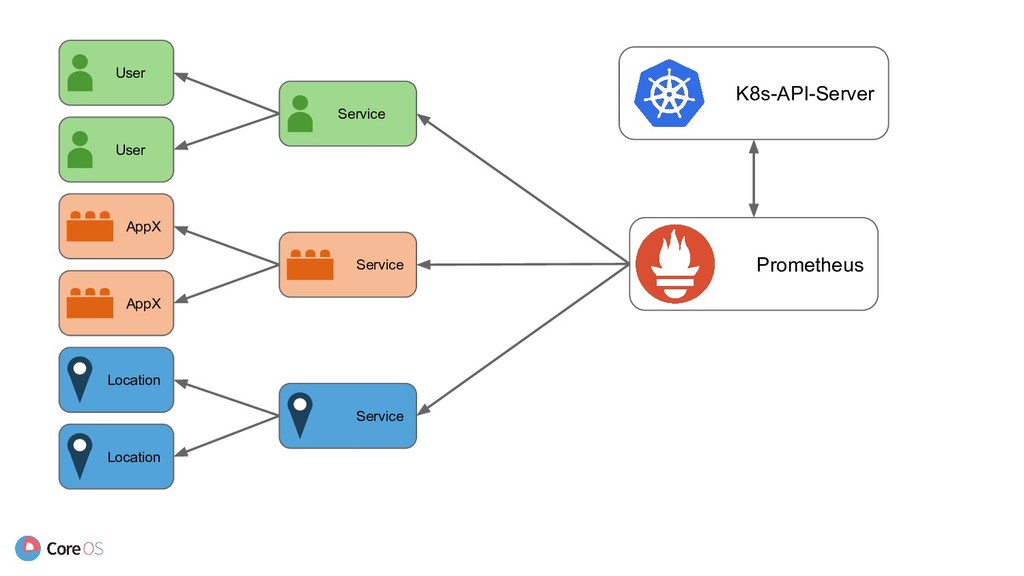
Application Monitoring
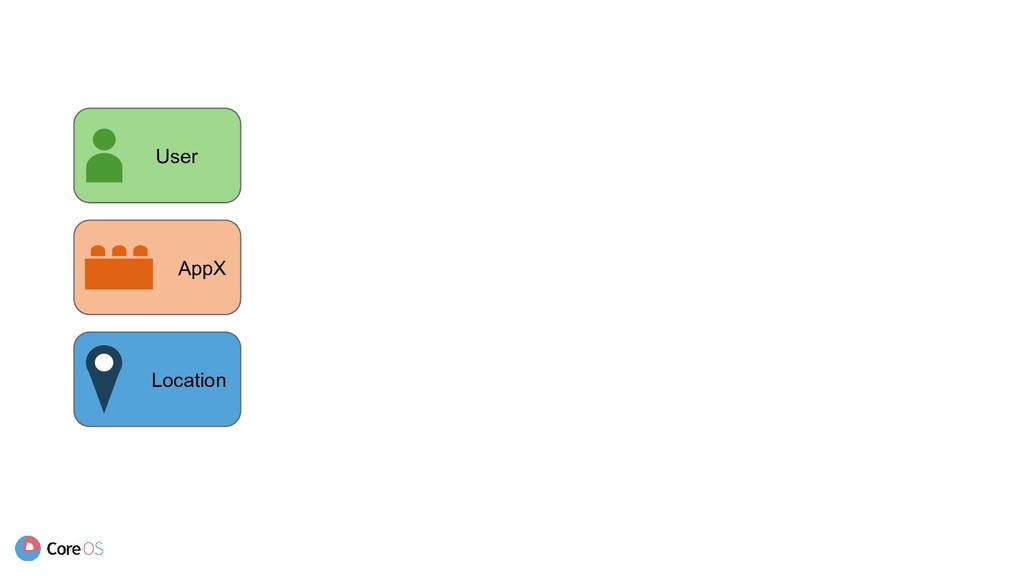
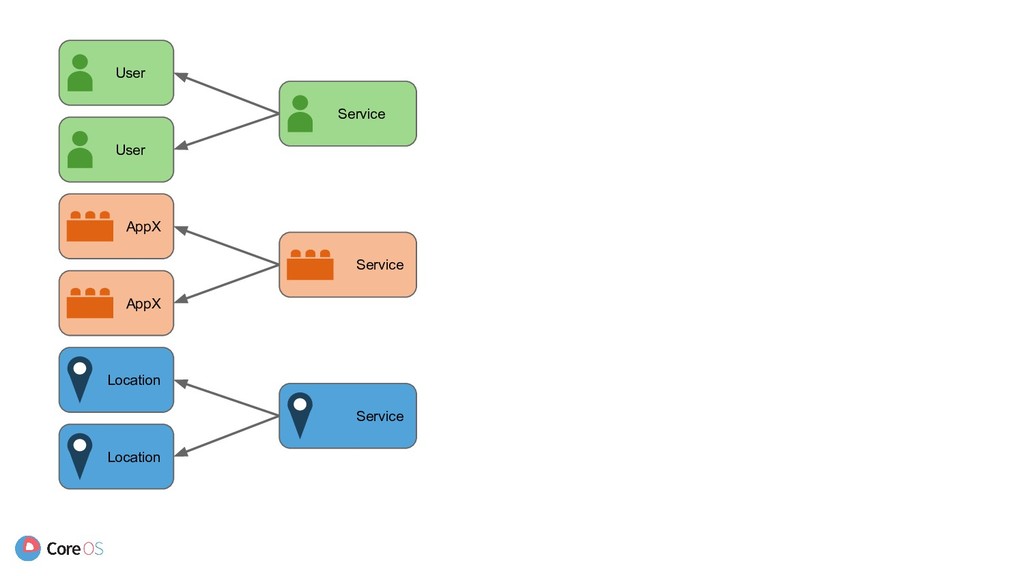
Location User AppX
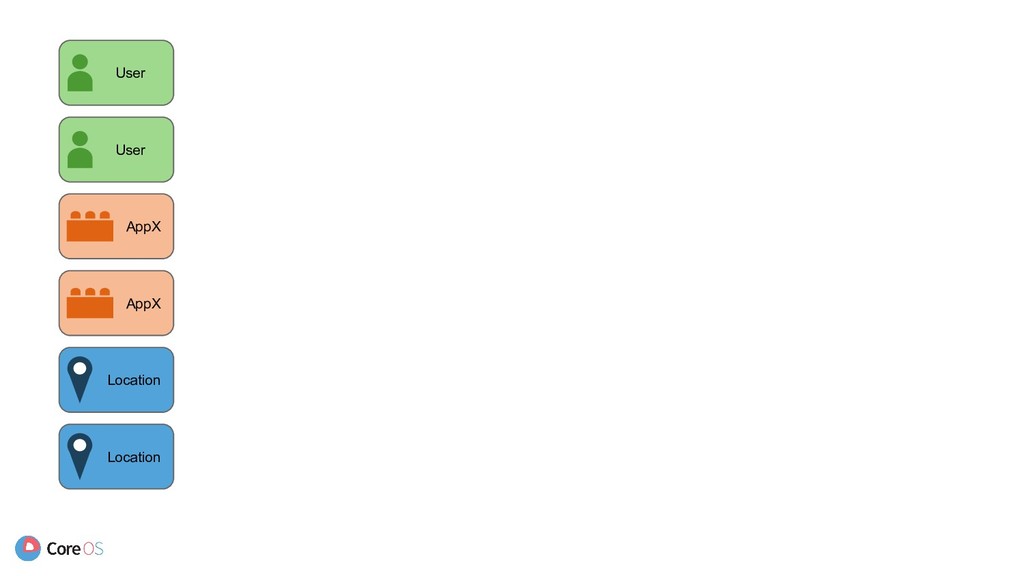
Location User AppX User AppX Location
Location User AppX User AppX Location Service Service Service
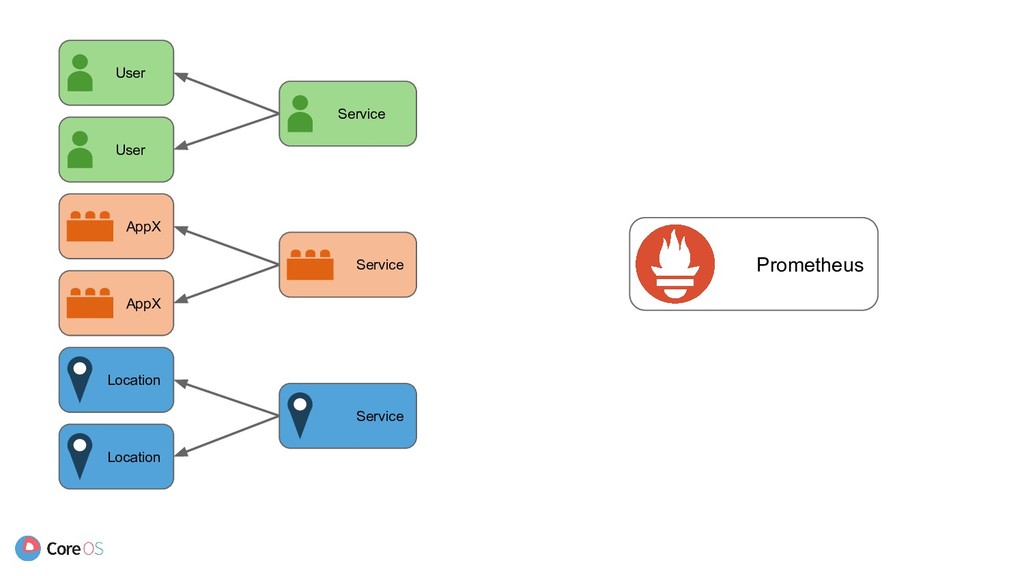
Location User AppX User AppX Location Service Service Service Prometheus
Location User AppX User AppX Location Service Service Service Prometheus
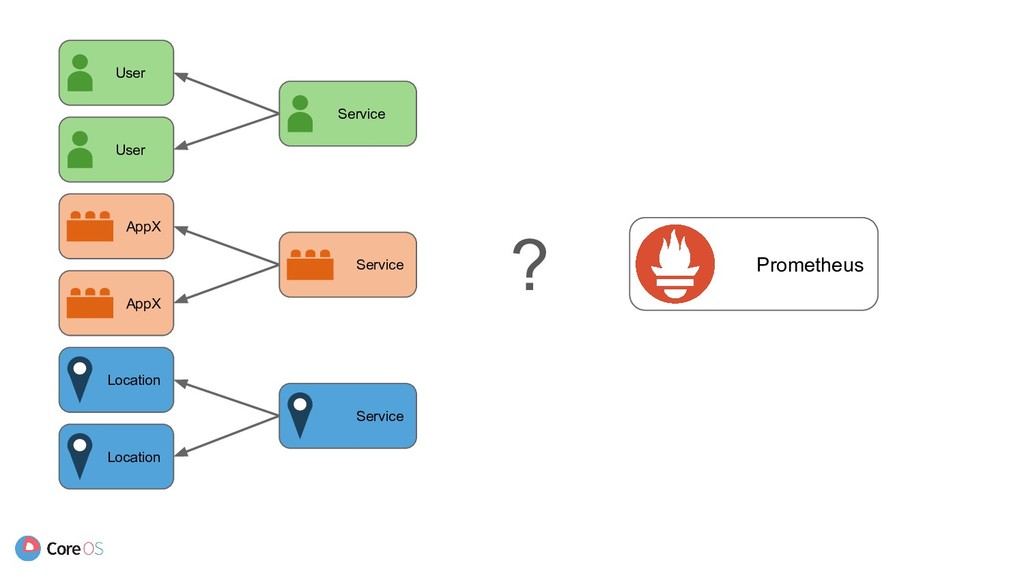
?
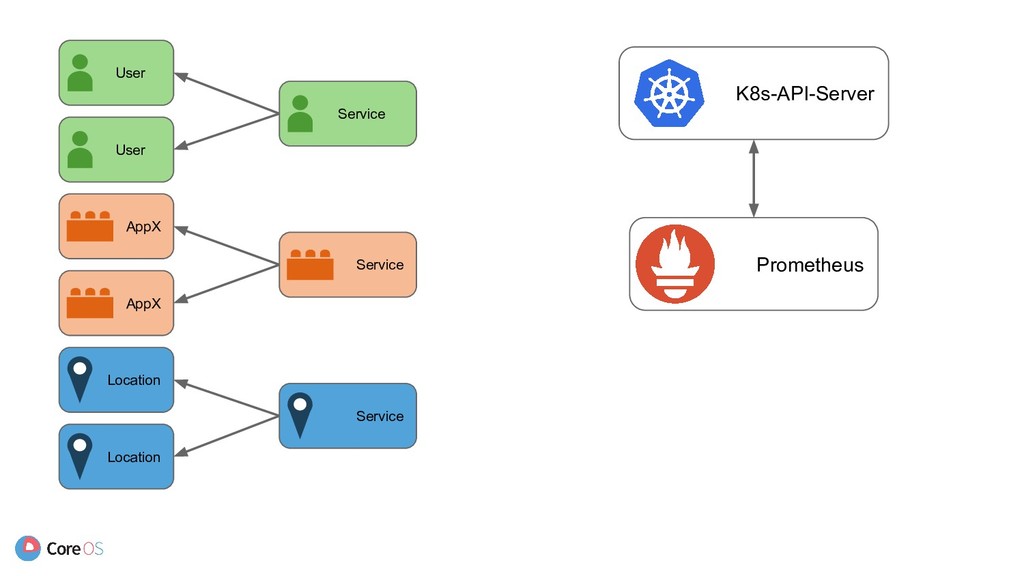
K8s-API-Server Location User AppX User AppX Location Service Service Service
Prometheus
Location User AppX User AppX Location Service Service Service Prometheus
K8s-API-Server
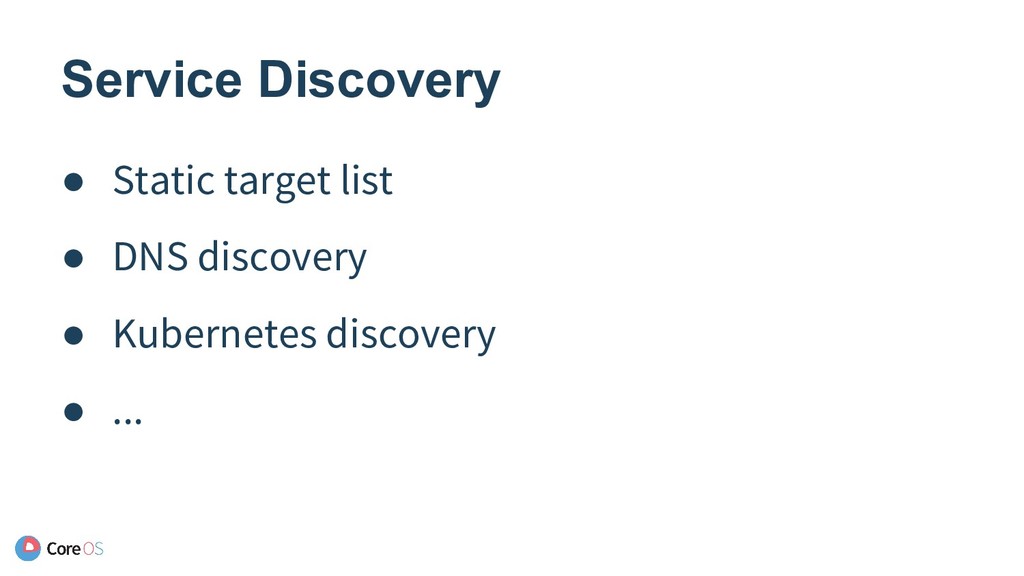
Service Discovery • Static target list • DNS discovery •
Kubernetes discovery • ...
None
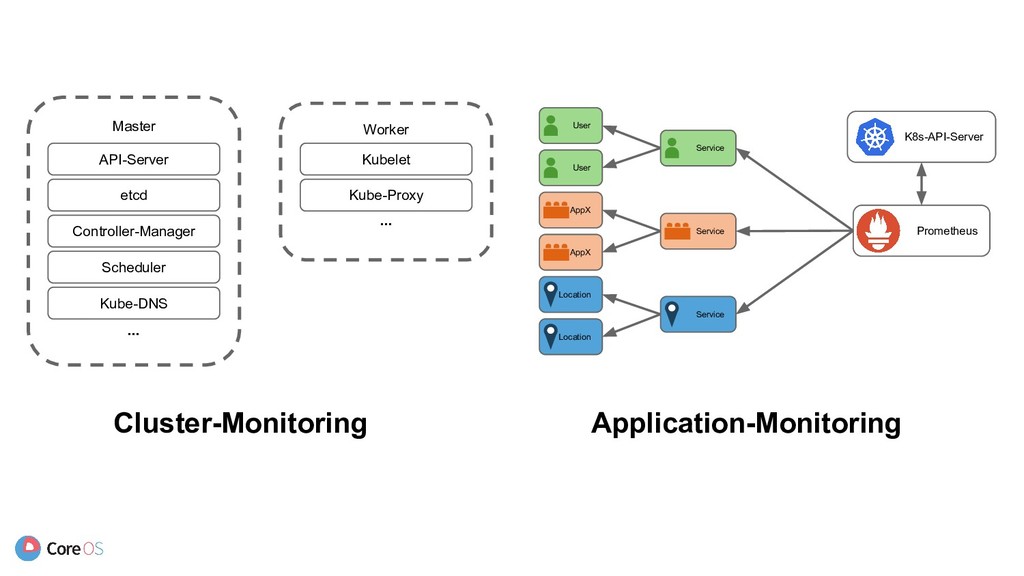
Master API-Server etcd Controller-Manager Scheduler Kube-DNS ... Worker Kubelet Kube-Proxy
... Location User AppX User AppX Location Service Service Service Prometheus K8s-API-Server Application-Monitoring Cluster-Monitoring
Problem Prometheus is stateful and difficult to configure!
Introducing the Prometheus Operator
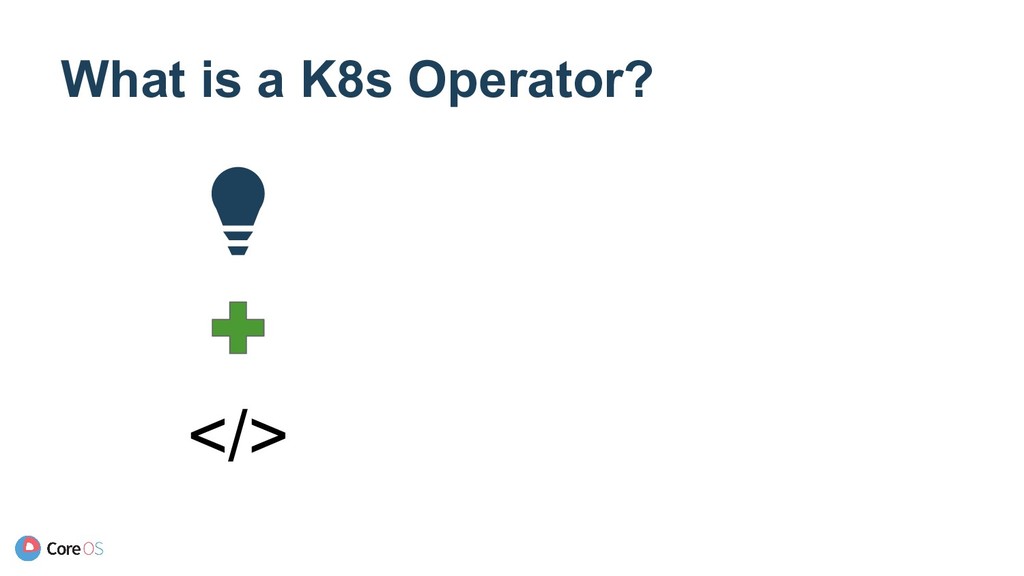
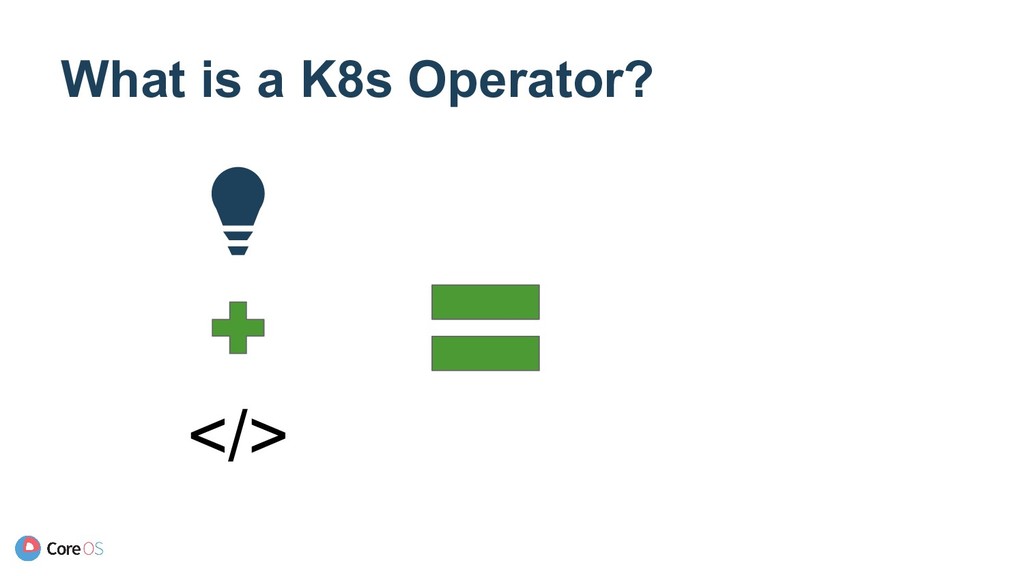
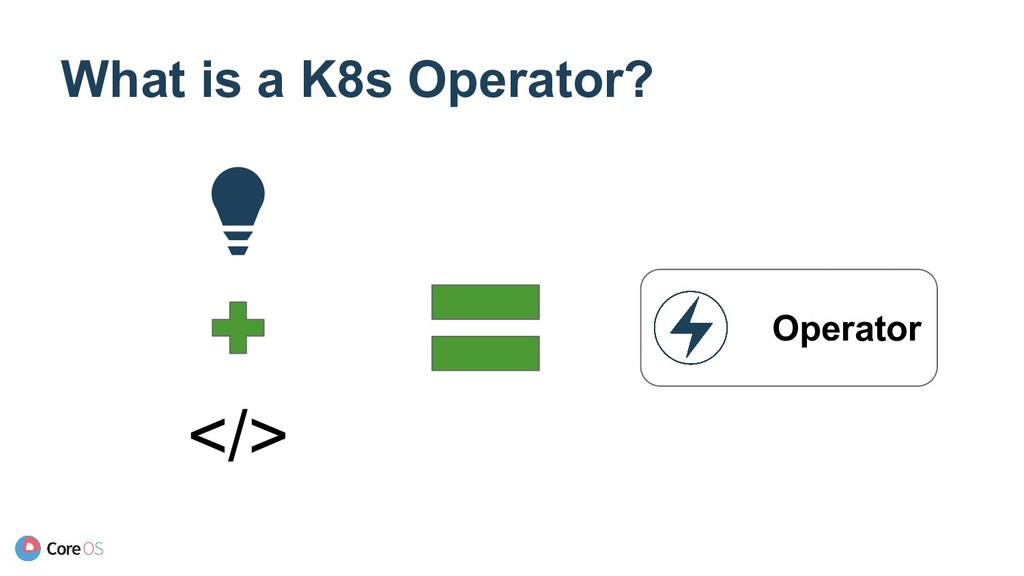
What is a K8s Operator?
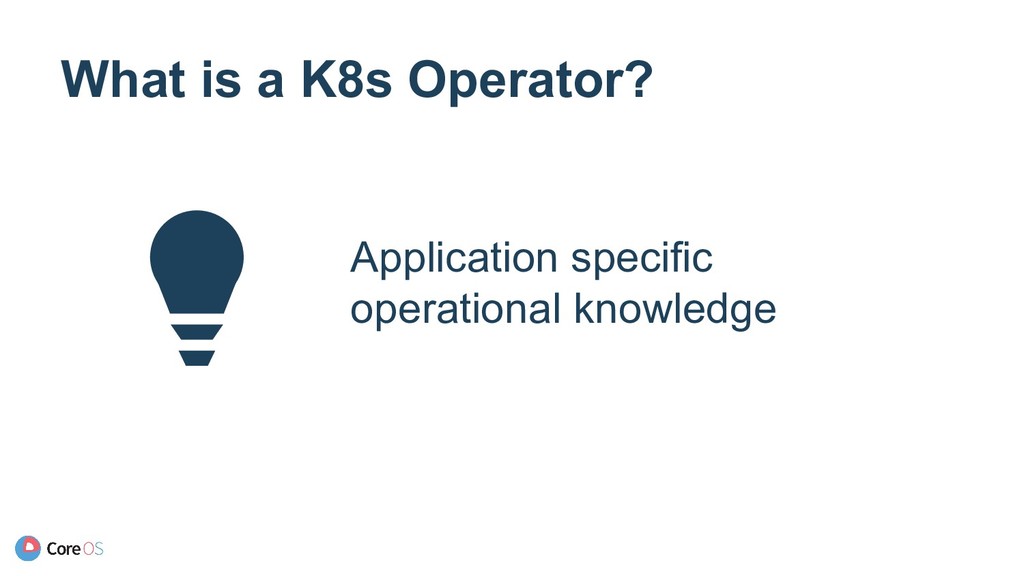
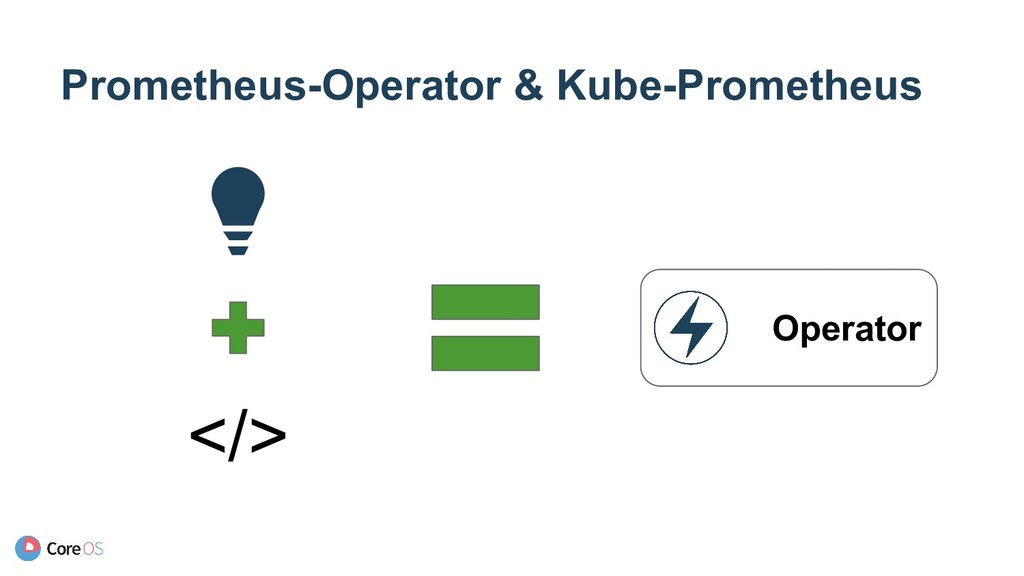
What is a K8s Operator? Application specific operational knowledge
What is a K8s Operator?
What is a K8s Operator? </>
What is a K8s Operator? </>
What is a K8s Operator? </> Operator
None
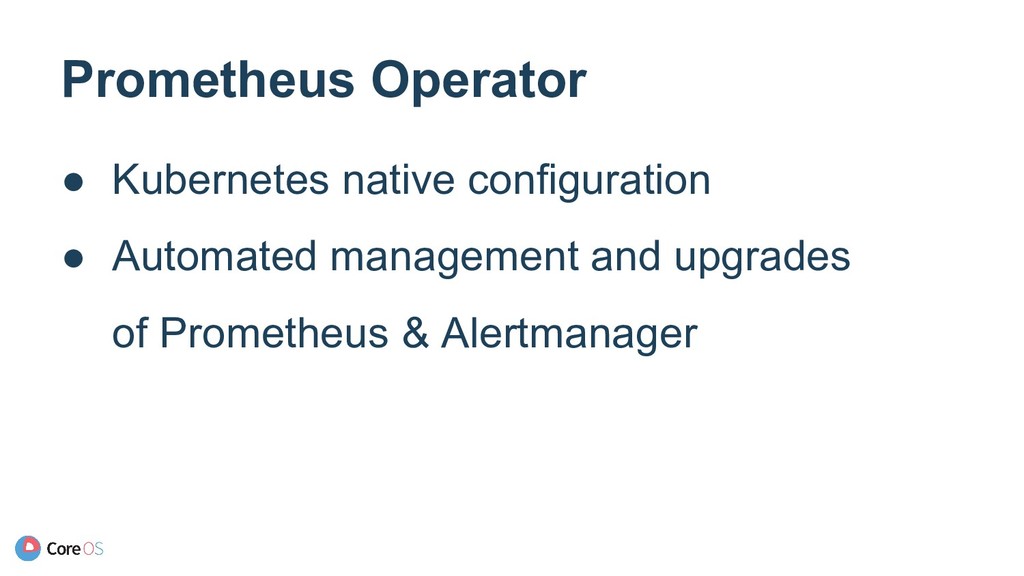
Prometheus Operator • Kubernetes native configuration • Automated management and
upgrades of Prometheus & Alertmanager
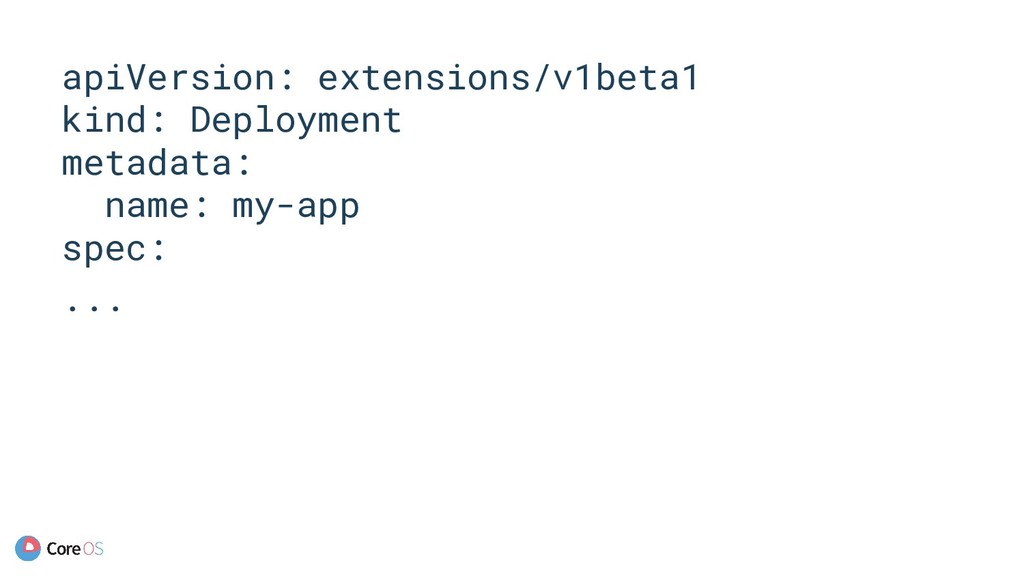
apiVersion: extensions/v1beta1 kind: Deployment metadata: name: my-app spec: ...
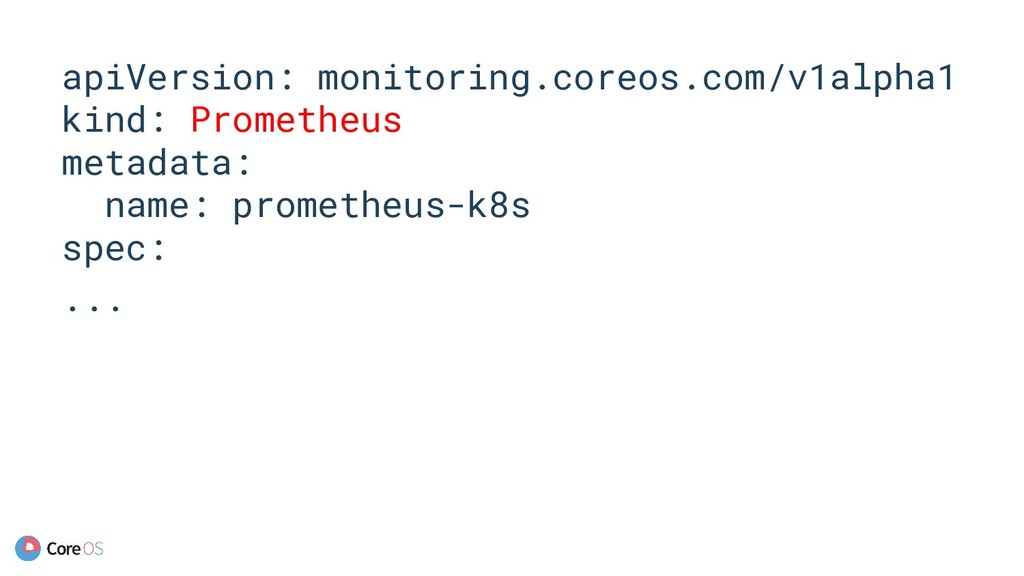
apiVersion: monitoring.coreos.com/v1alpha1 kind: Prometheus metadata: name: prometheus-k8s spec: ...
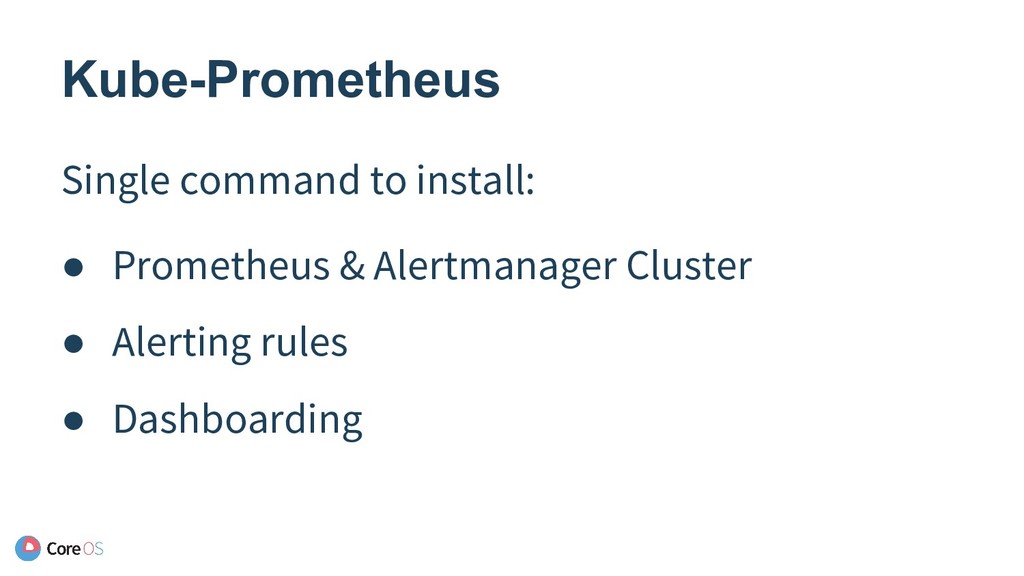
Kube-Prometheus Single command to install: • Prometheus & Alertmanager Cluster
• Alerting rules • Dashboarding
Demo
Recap
What is Prometheus? • Pull-based • Multi-Dimensional • Metrics, not
logging, not tracing • No magic! •
Prometheus Target /metrics Target /metrics Target /metrics 15s
Prometheus Target /metrics Target /metrics Target /metrics Alert Definition Alertmanager
1m
Prometheus-Operator & Kube-Prometheus </> Operator
Where to go from here? Prometheus.io /coreos/prometheus-operator
San Francisco, New York & Berlin We are hiring!
Max Inden Test-Engineer at CoreOS @mxinden
[email protected]


 pcd
 yahonda
 kenichiodo
 daidaidai
 y0hgi
 4o1sobblue
 jtakeda
 genda
 ykanoh
 kentarofujii
 yu23ki14
 puhitaku
 prog893
 szymonslowik
 inesmontani
 soysaucechin
 tmiket
 nmsamuel
 yeseniaperezcruz
 mlcsv
 michielstock
 honzajavorek
 ammeep