Upgrade to Pro
— share decks privately, control downloads, hide ads and more …
Speaker Deck
Features
Speaker Deck
PRO
Sign in
Sign up for free
Search
Search
Send More Riders
Search
peteowlett
February 02, 2016
Technology
970
4
Share
Embed
Copy iframe code
Copy JS code
Copy link
Start on current slide
Send More Riders
Predictive scheduling for an on demand delivery fleet
peteowlett
February 02, 2016
More Decks by peteowlett
See All by peteowlett
Lessons from 6 Months of using Luigi
peteowlett
4
980
Takeaway Tales
peteowlett
1
220
Other Decks in Technology
See All in Technology
SRENEXT_2026_Chairs__Talks_in_Tamachi.sre.pdf
srenext
1
150
OpenTelemetryにおけるGoのゼロコード・コンパイル時計装について #fukuokago
quiver
0
210
10年目を迎えた「ABEMA」がどのように AI 活用を推進して、AI 駆動開発にシフトしているのか / How ABEMA, entering its 10th year, is promoting the use of AI and shifting toward AI-driven development
miyukki
0
370
JAWS_ICEBERG_BASECAMP
iqbocchi
2
110
非定型なドキュメントを効率よくリファクタする 〜えぇ!?仕様書27本の移行が1日で終わったって!?〜
subroh0508
2
620
AIが当たり前の組織で エンジニアはどう育つか
nishihira
1
980
ゴールデンパスは敷いただけでは道にならない ─ 企画部門のエンジニアが技術標準を事業価値に変えるまで
mhrtech
1
260
全社でのソフトウェアサプライチェーン攻撃対策をやってみた with Takumi Guard
z63d
0
280
AI工学特論: MLOps・継続的評価
asei
5
1.3k
StepFunctionsとGraphRAGを活用した暗黙知活用のためのRAG基盤
yakumo
0
140
AIツールを導入しても生産性はあがらない? カオナビが直面した 3つの壁と乗り越え方。/ Overcoming 3 Barriers to AI-Driven Productivity at kaonavi
kaonavi
0
190
仕様駆動開発、導入半年。「本当に速くなってるの?」にデータで答える / AICon2026_hirakawa
rakus_dev
0
320
Featured
See All Featured
The Mindset for Success: Future Career Progression
greggifford
PRO
0
430
Breaking role norms: Why Content Design is so much more than writing copy - Taylor Woolridge
uxyall
0
350
Context Engineering - Making Every Token Count
addyosmani
9
1k
Building a A Zero-Code AI SEO Workflow
portentint
PRO
0
640
How Software Deployment tools have changed in the past 20 years
geshan
0
34k
Build The Right Thing And Hit Your Dates
maggiecrowley
39
3.3k
Understanding Cognitive Biases in Performance Measurement
bluesmoon
32
3k
Bootstrapping a Software Product
garrettdimon
PRO
307
120k
Keith and Marios Guide to Fast Websites
keithpitt
413
23k
4 Signs Your Business is Dying
shpigford
187
22k
A Modern Web Designer's Workflow
chriscoyier
698
190k
RailsConf 2023
tenderlove
30
1.5k
Transcript
Send More Riders! Predictive scheduling for an on demand delivery
fleet @PeterOwlett
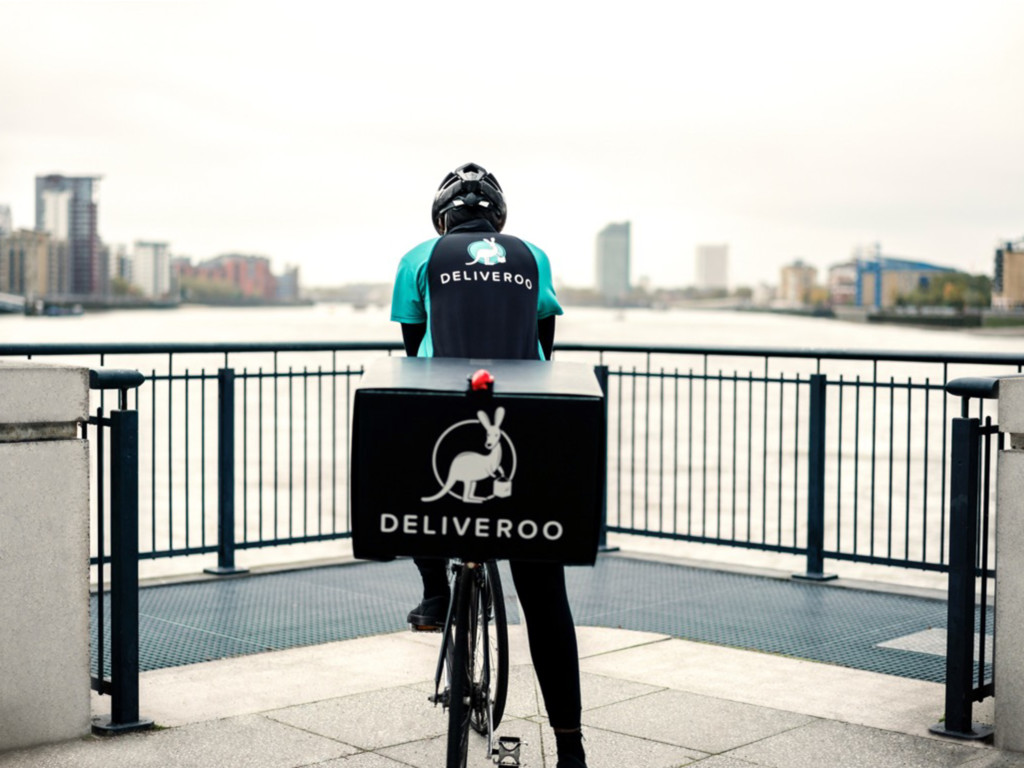
High quality food, delivered fast and on demand
None
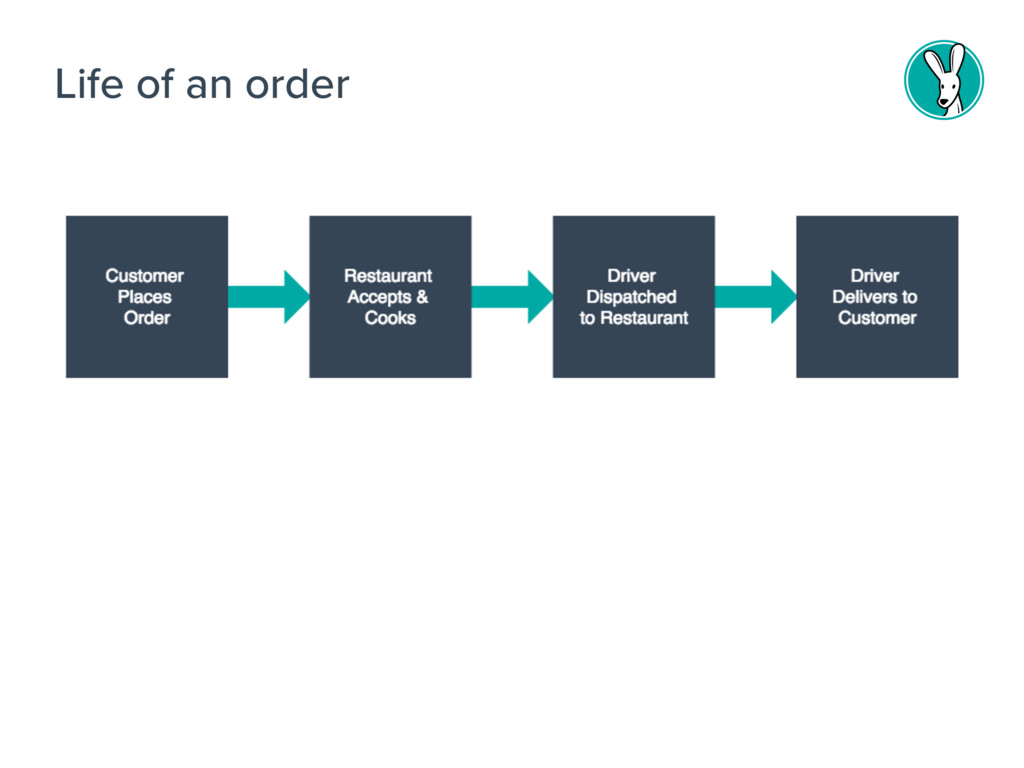
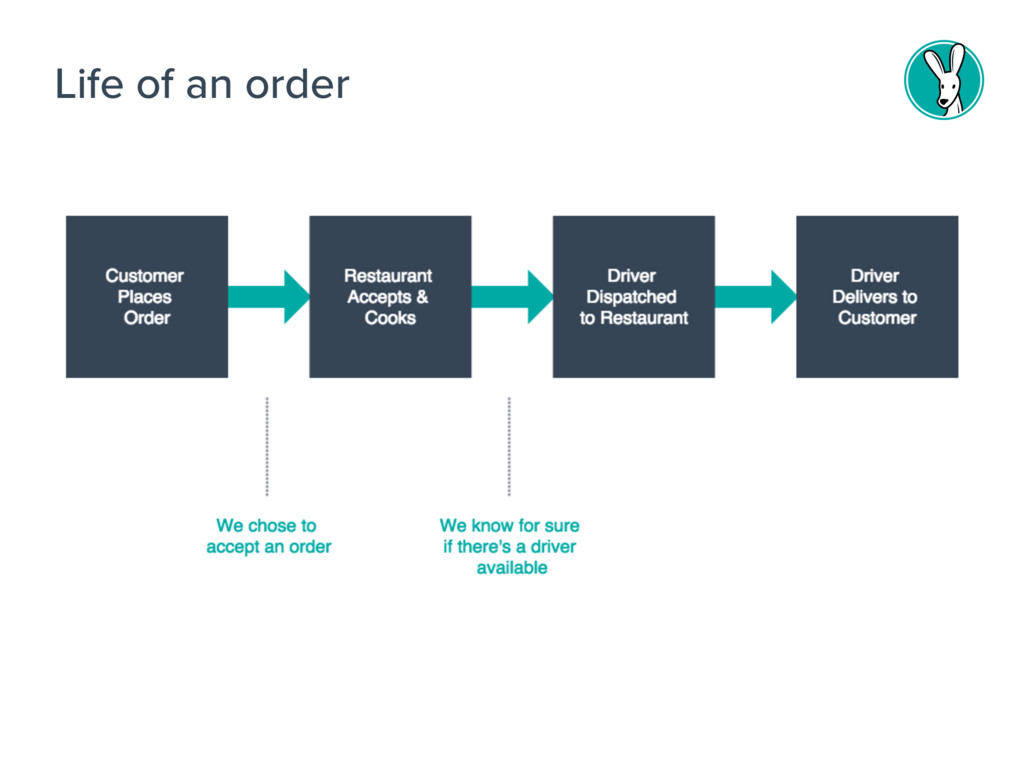
Life of an order
Life of an order
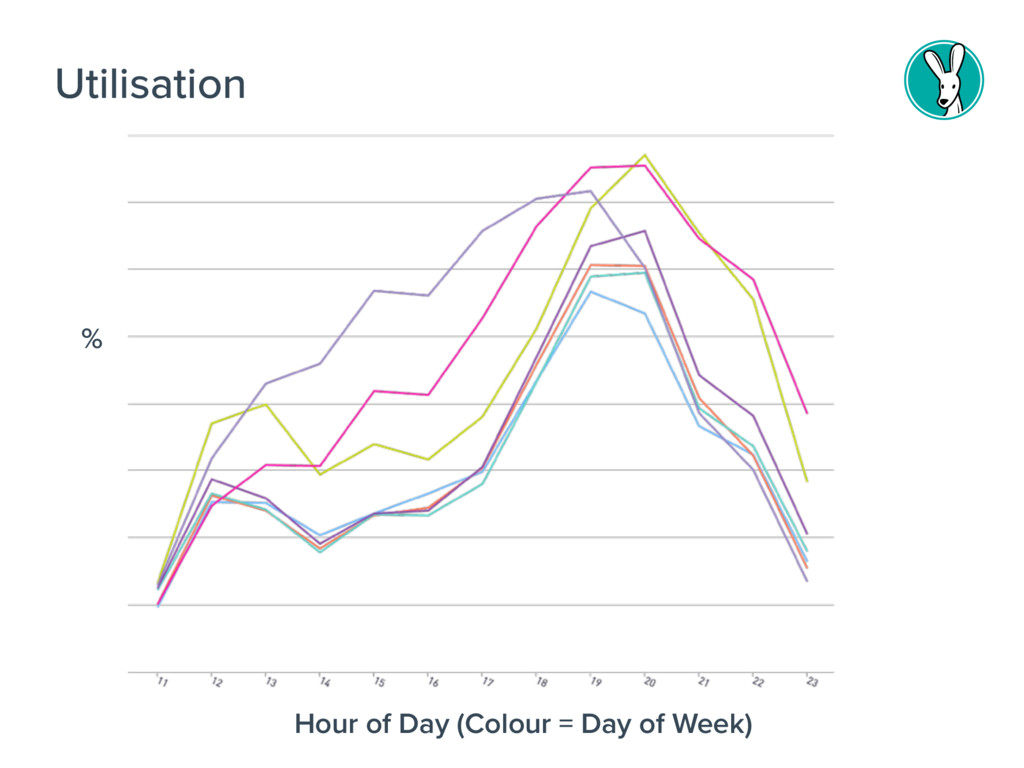
Utilisation % Hour of Day (Colour = Day of Week)
We need enough drivers to deliver on time, but not
so many we lose money
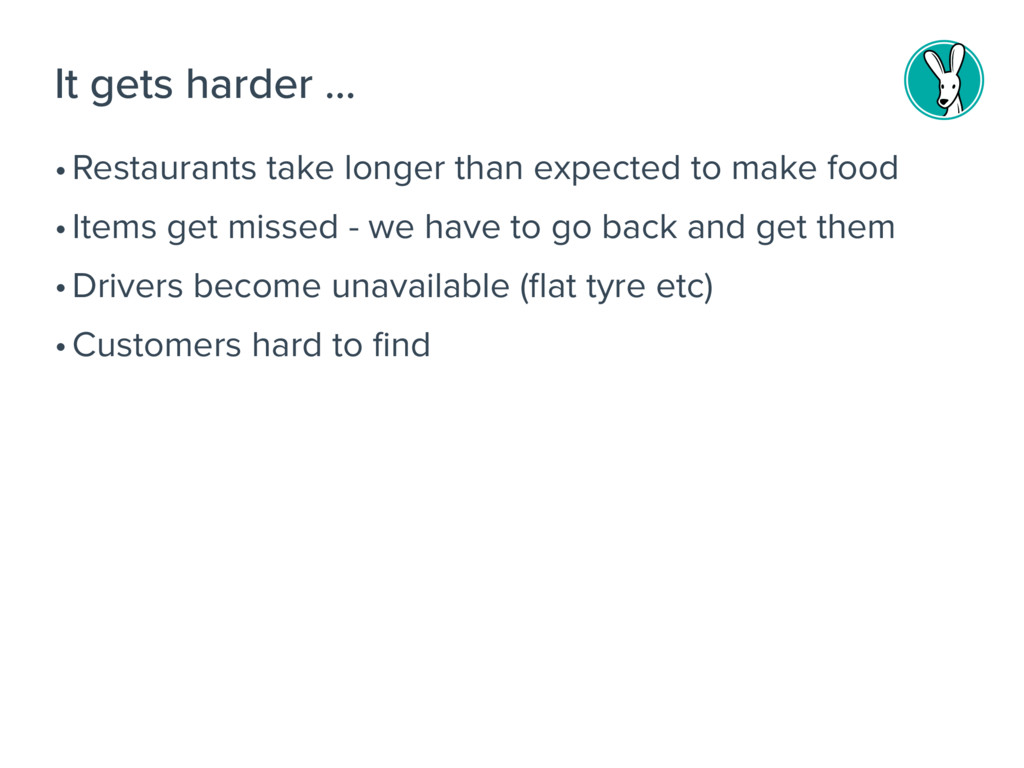
•Restaurants take longer than expected to make food •Items get
missed - we have to go back and get them •Drivers become unavailable (flat tyre etc) •Customers hard to find It gets harder …
Exam question How many drivers should we schedule for the
next two weeks in each part of London over 15 minute blocks?
Before we dive in - a quick apology
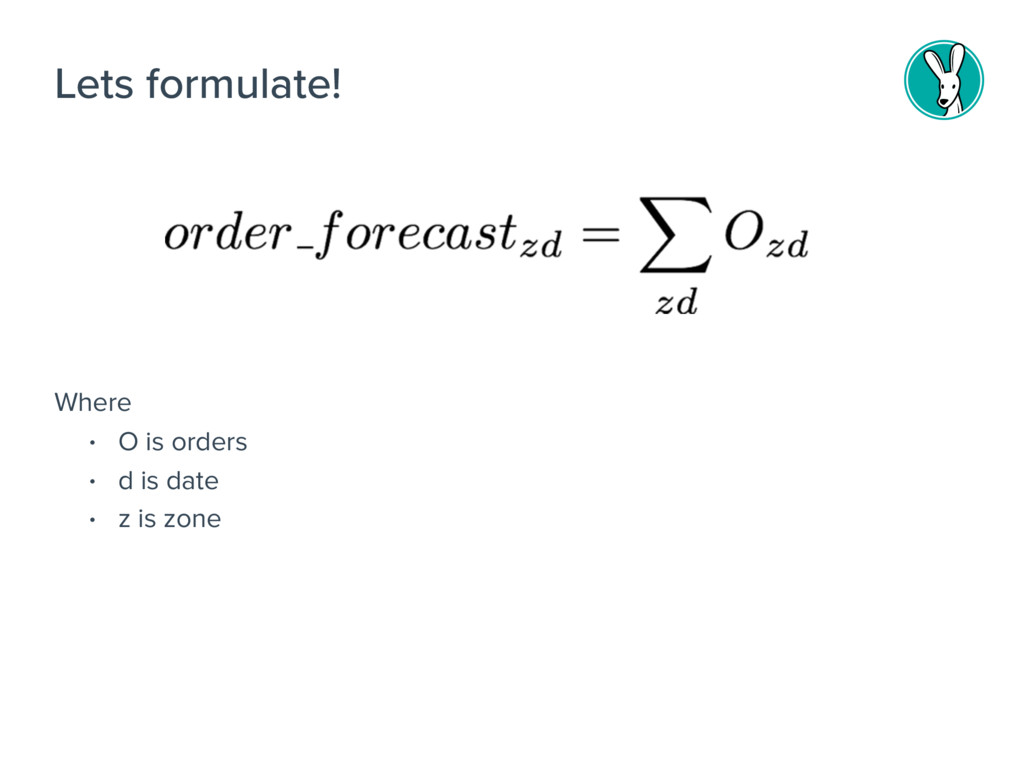
Lets formulate! Where • O is orders • d is
date • z is zone
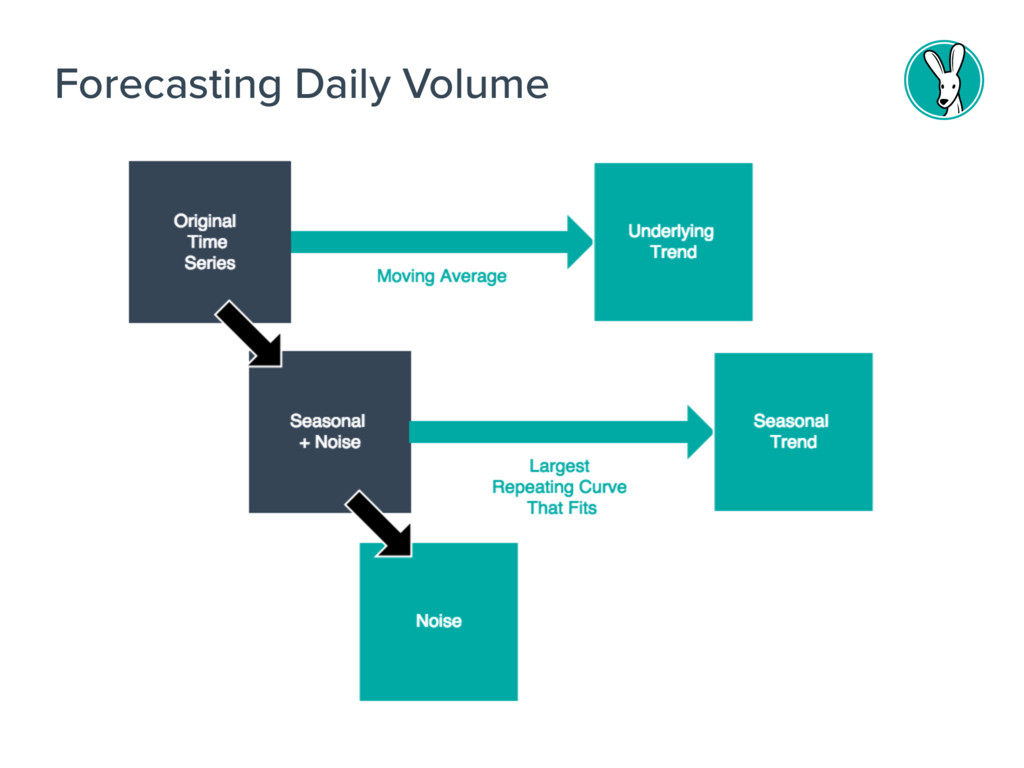
Forecasting Daily Volume
This book is awesome And Free!!! - https://www.otexts.org/fpp
Forecasting Daily Volume
None
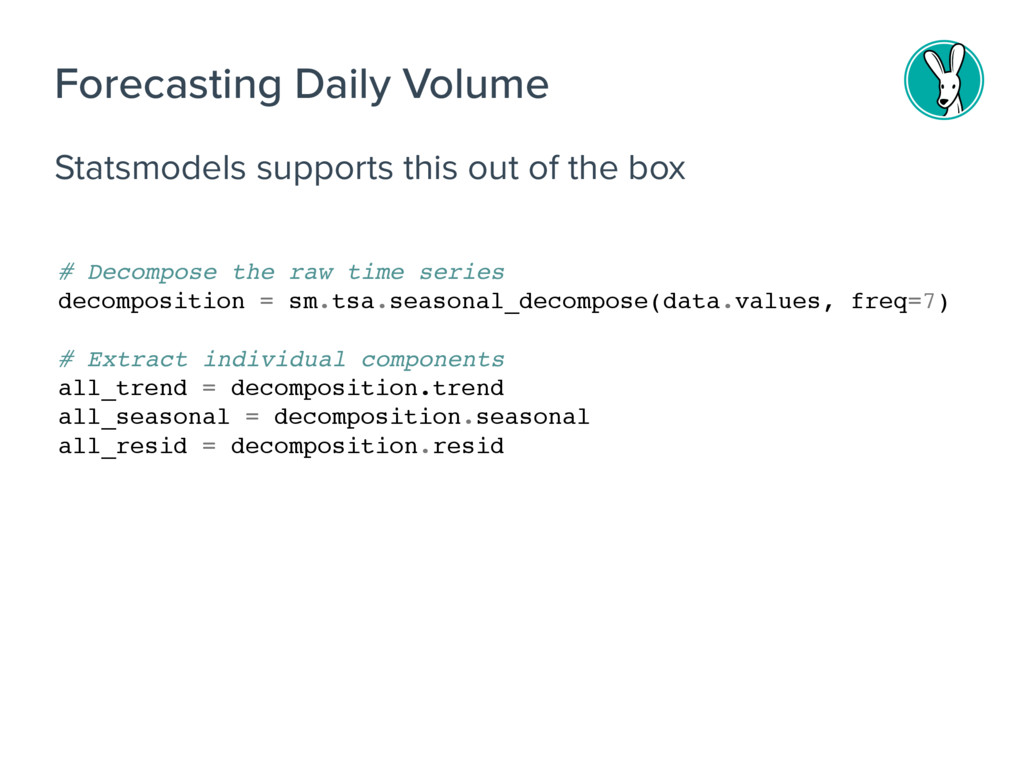
Statsmodels supports this out of the box Forecasting Daily Volume
# Decompose the raw time series decomposition = sm.tsa.seasonal_decompose(data.values, freq=7) # Extract individual components all_trend = decomposition.trend all_seasonal = decomposition.seasonal all_resid = decomposition.resid
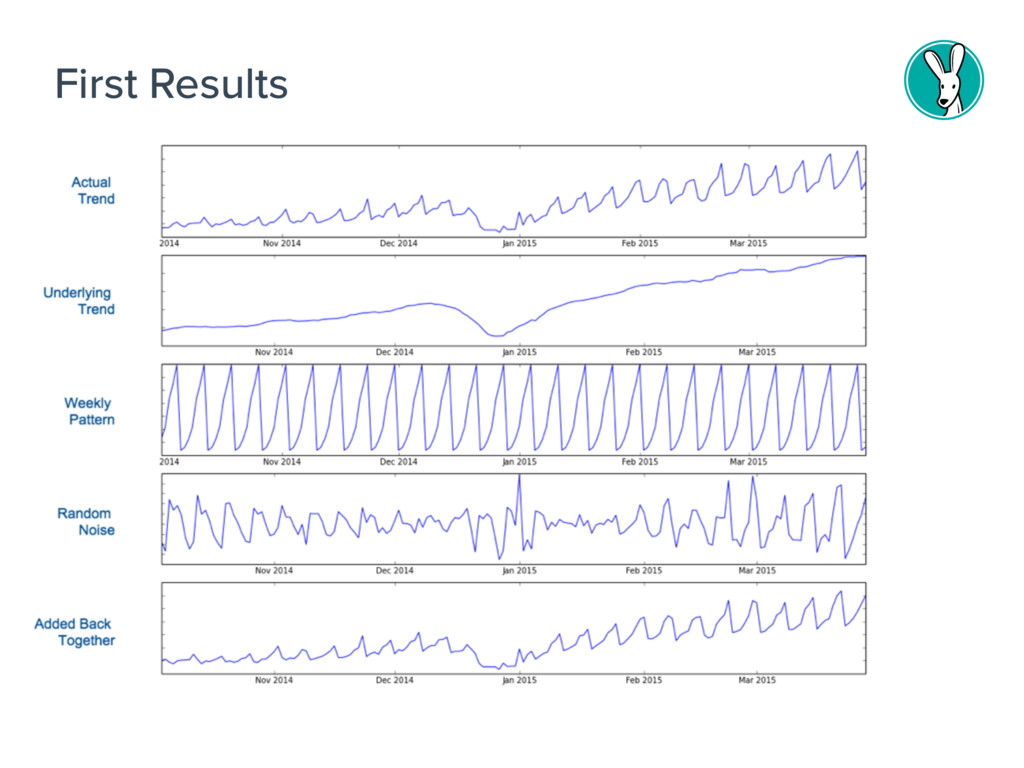
First Results
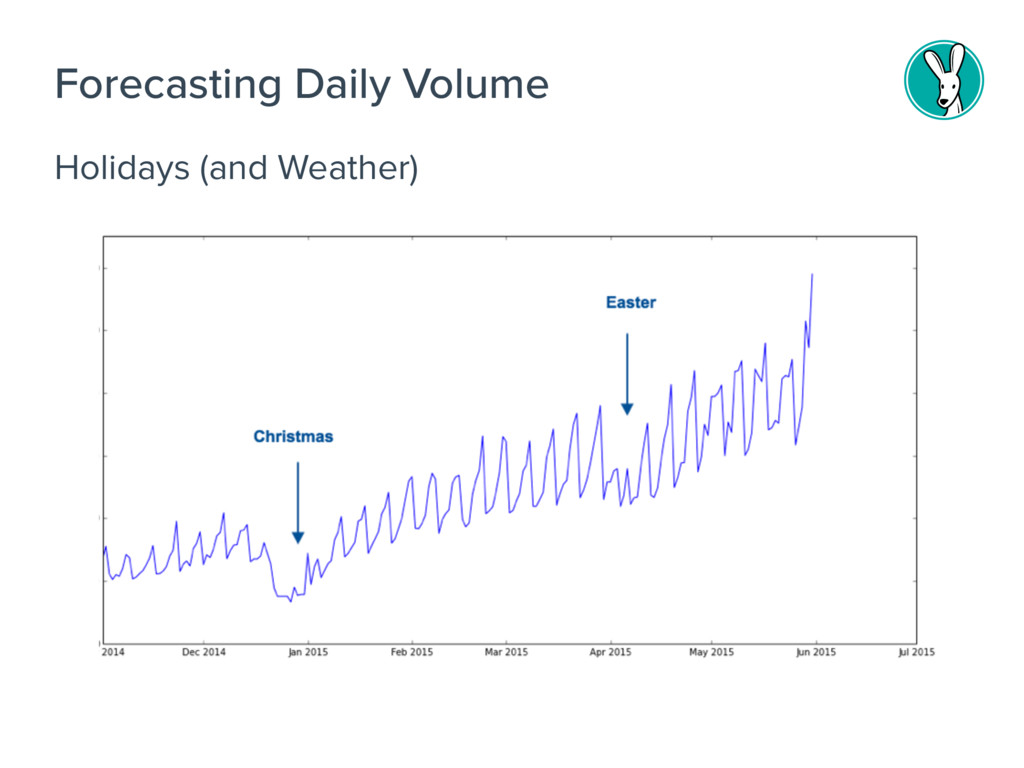
Holidays (and Weather) Forecasting Daily Volume
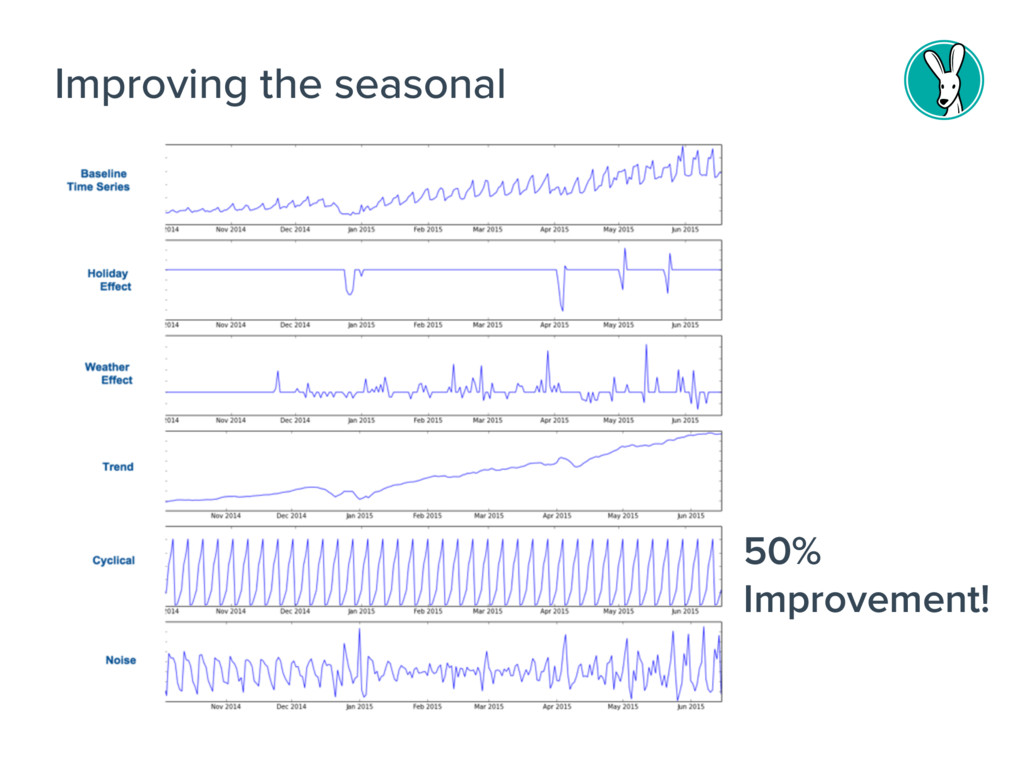
Improving the seasonal 50% Improvement!
•Vary the training range •Train on np.log(series) and transform back
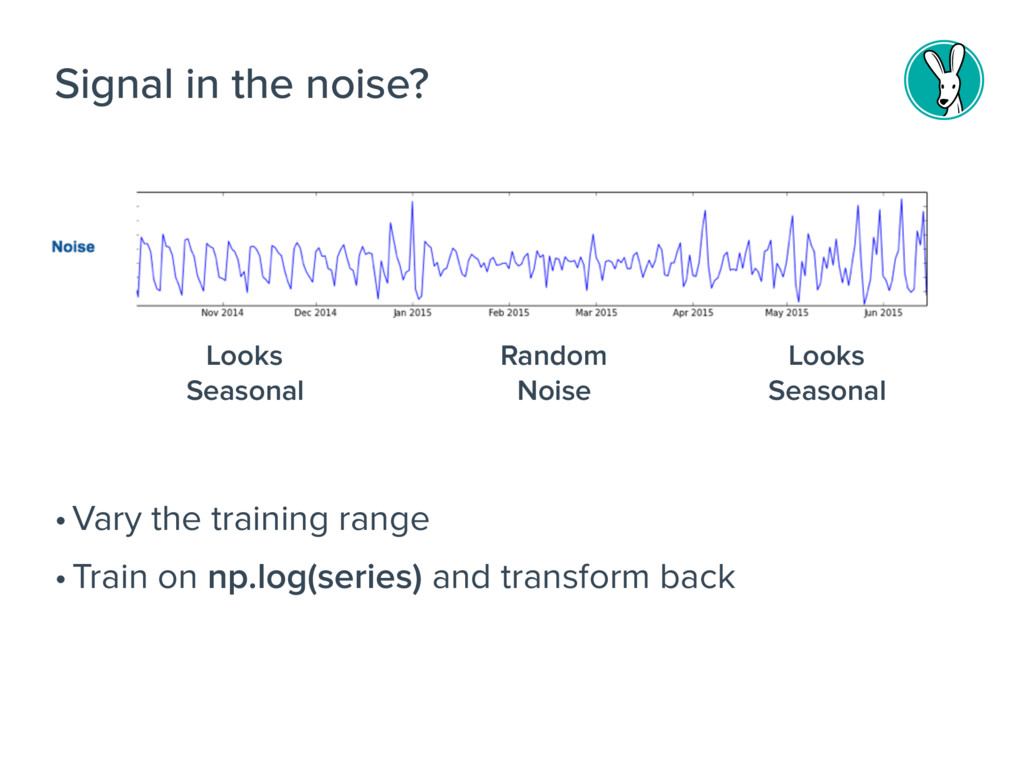
Signal in the noise? Looks Seasonal Looks Seasonal Random Noise
Because we can chart each series, we can reason about
how to improve our model
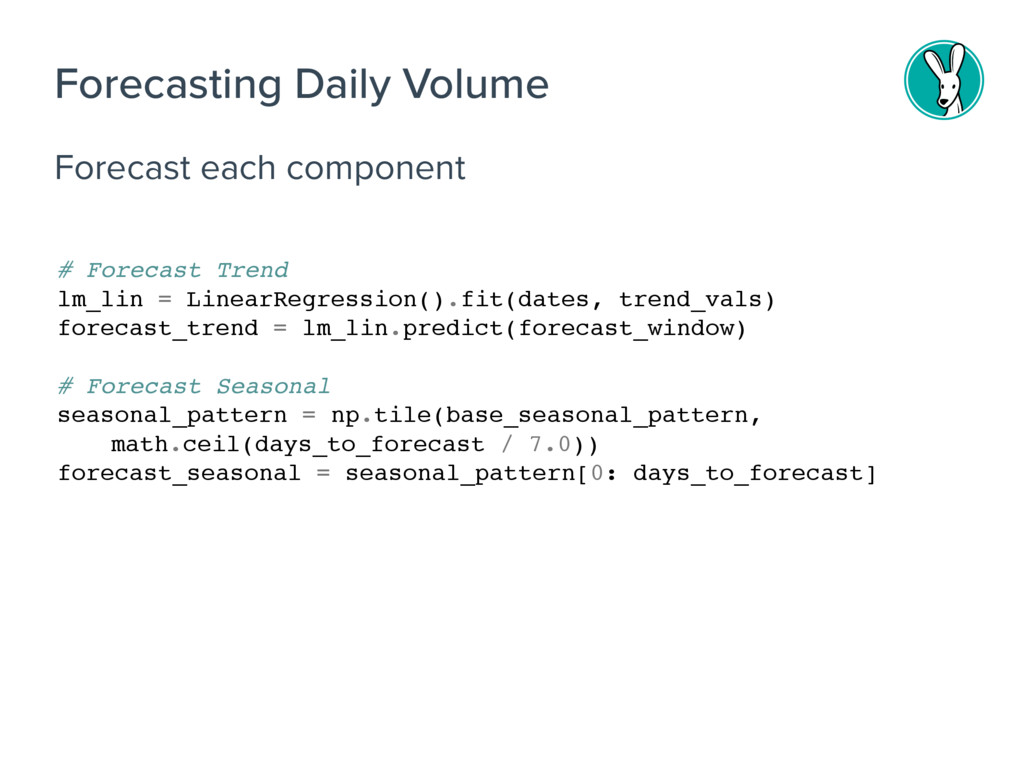
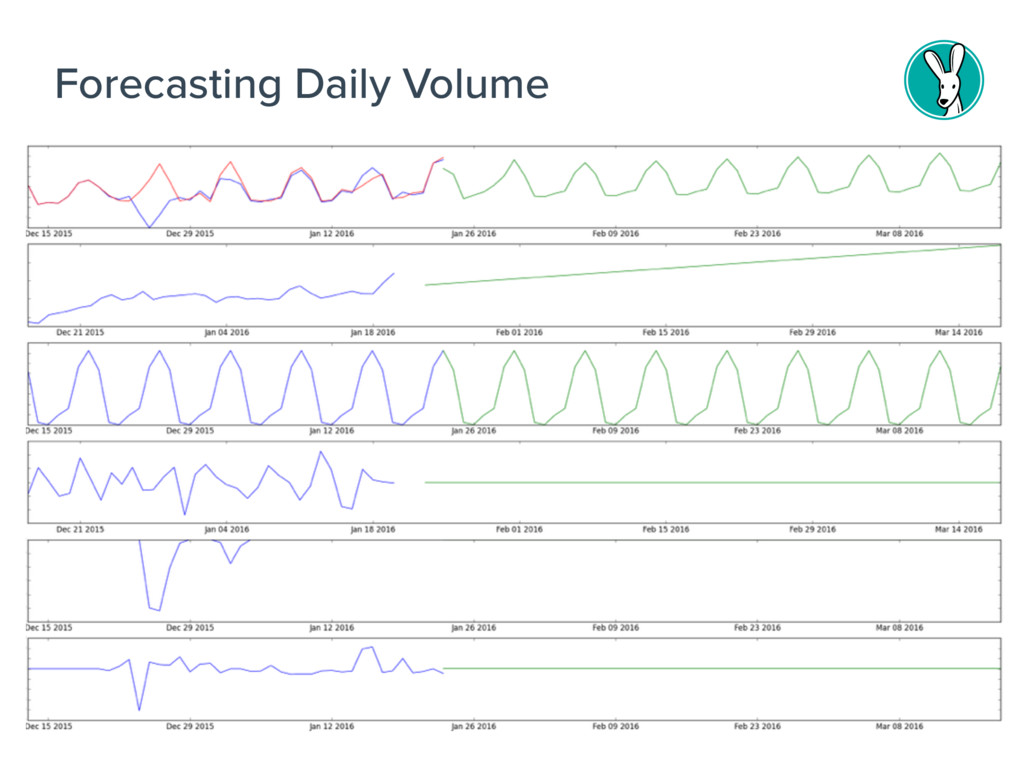
Forecast each component Forecasting Daily Volume # Forecast Trend lm_lin
= LinearRegression().fit(dates, trend_vals) forecast_trend = lm_lin.predict(forecast_window) # Forecast Seasonal seasonal_pattern = np.tile(base_seasonal_pattern, math.ceil(days_to_forecast / 7.0)) forecast_seasonal = seasonal_pattern[0: days_to_forecast]
Forecasting Daily Volume
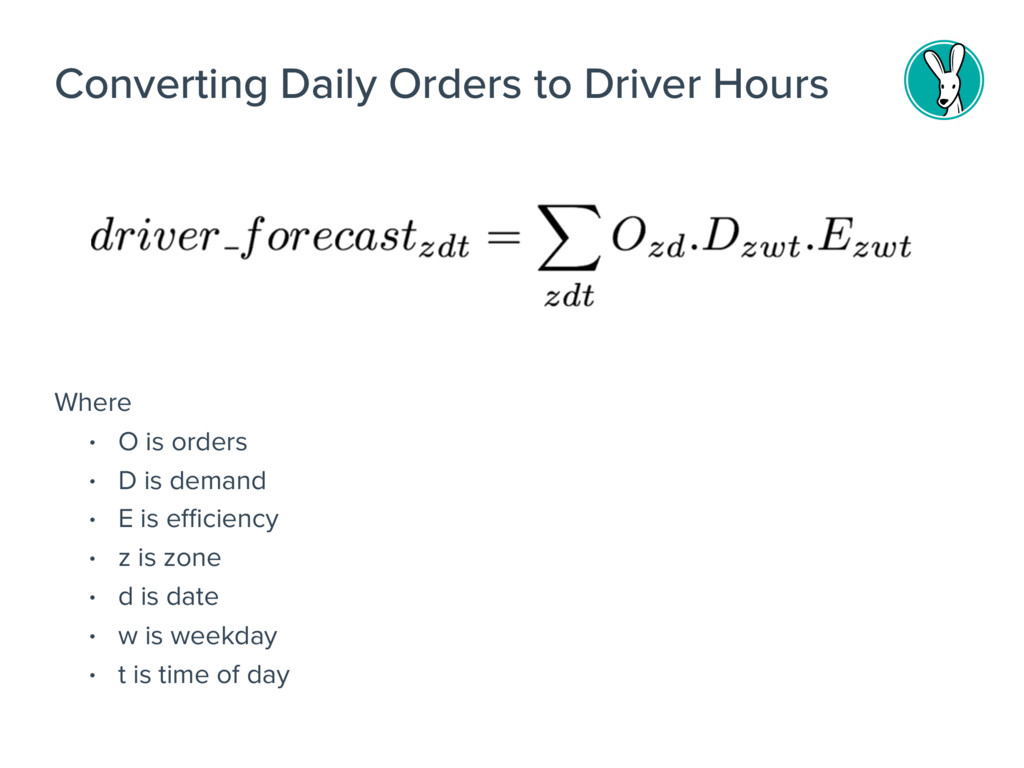
Where • O is orders • D is demand •
E is efficiency • z is zone • d is date • w is weekday • t is time of day Converting Daily Orders to Driver Hours
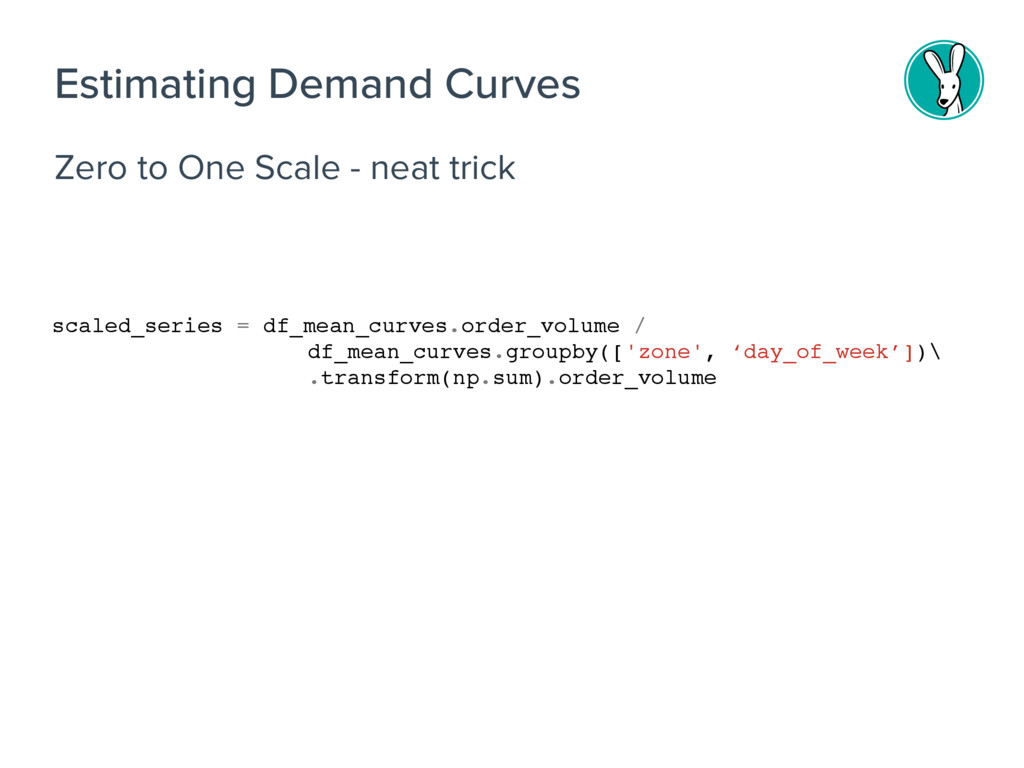
Zero to One Scale - neat trick Estimating Demand Curves
scaled_series = df_mean_curves.order_volume / df_mean_curves.groupby(['zone', ‘day_of_week’])\ .transform(np.sum).order_volume
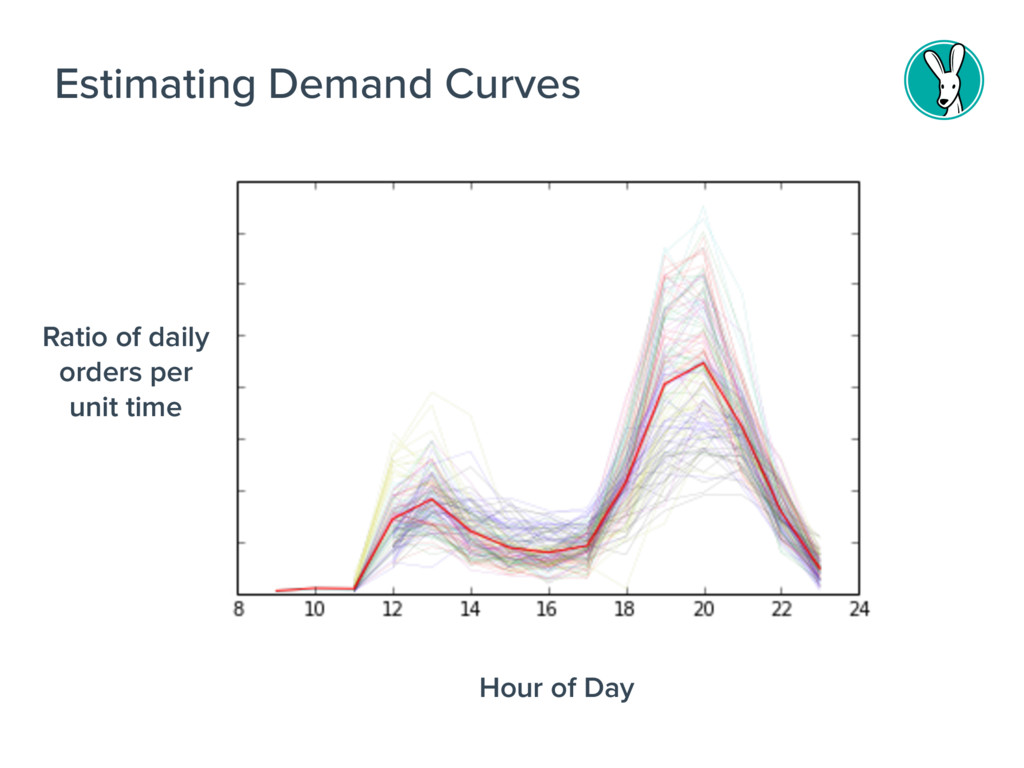
Estimating Demand Curves Ratio of daily orders per unit time
Hour of Day
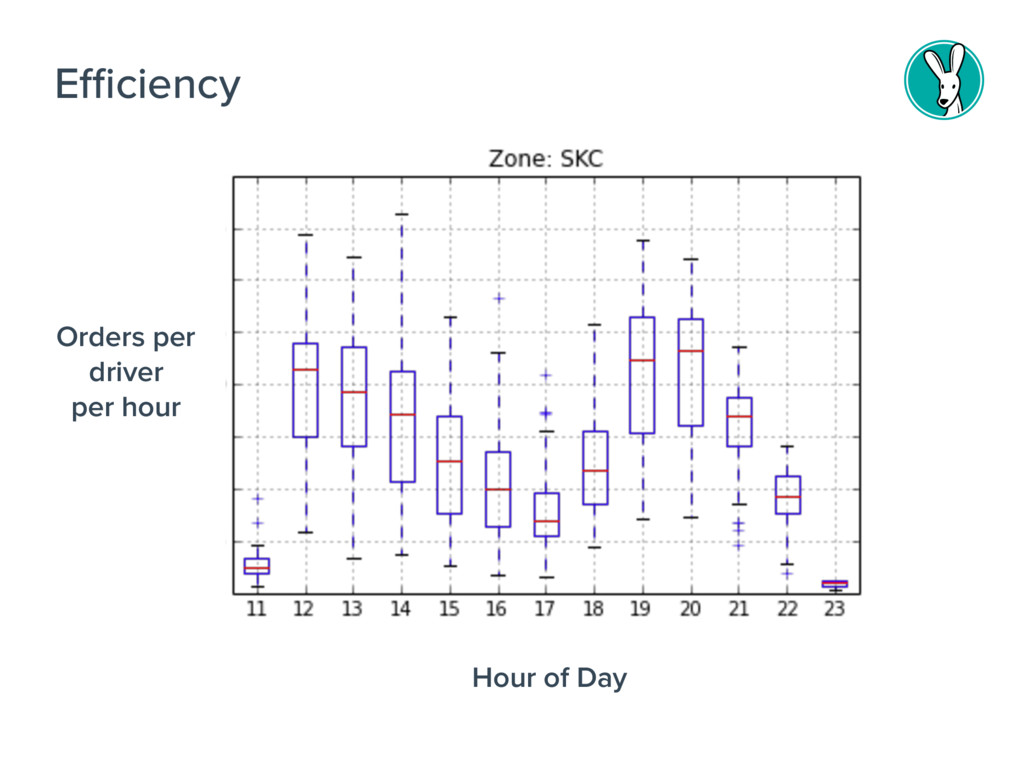
Efficiency Orders per driver per hour Hour of Day
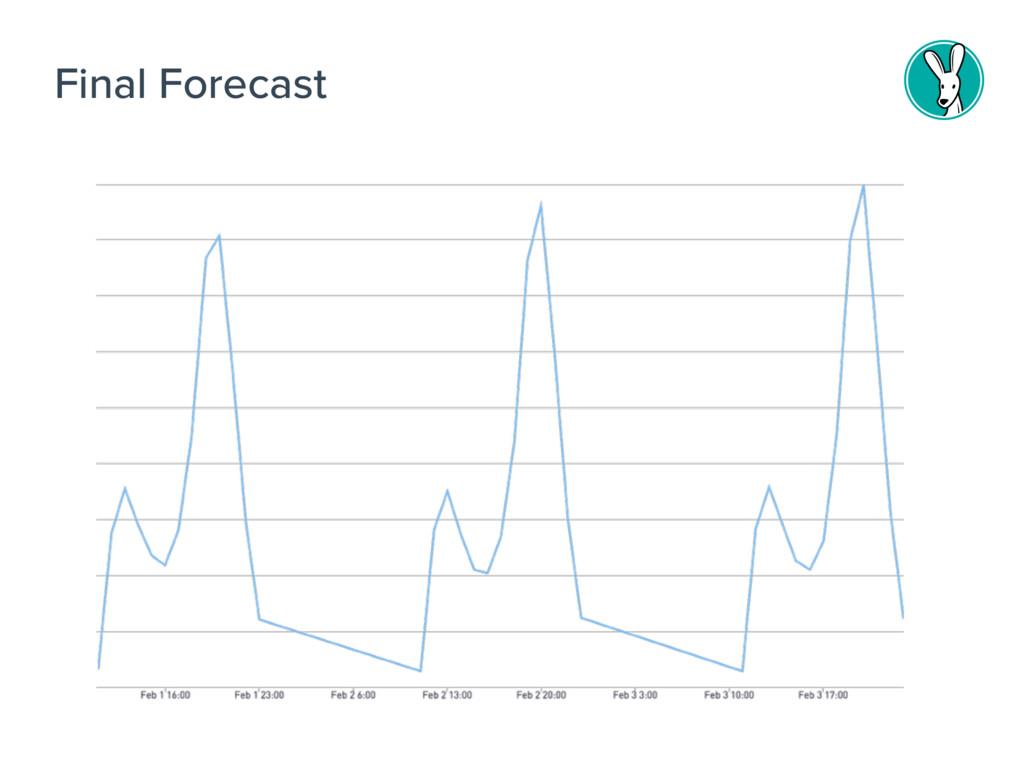
Final Forecast
Getting the forecast out into the real world
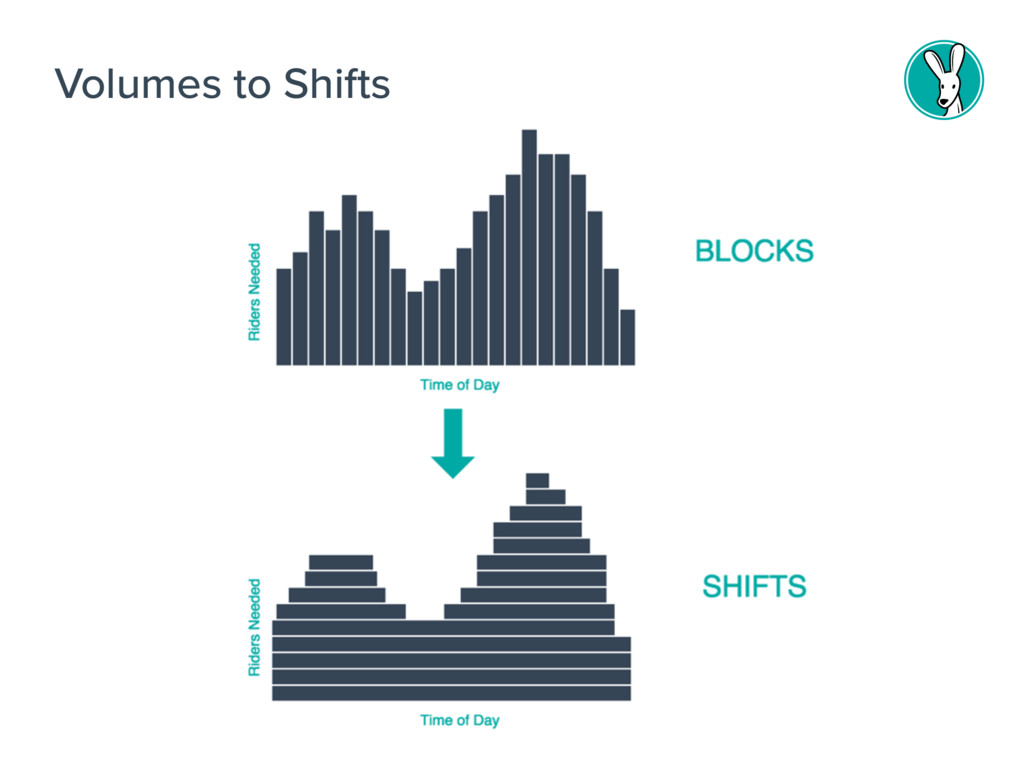
Volumes to Shifts
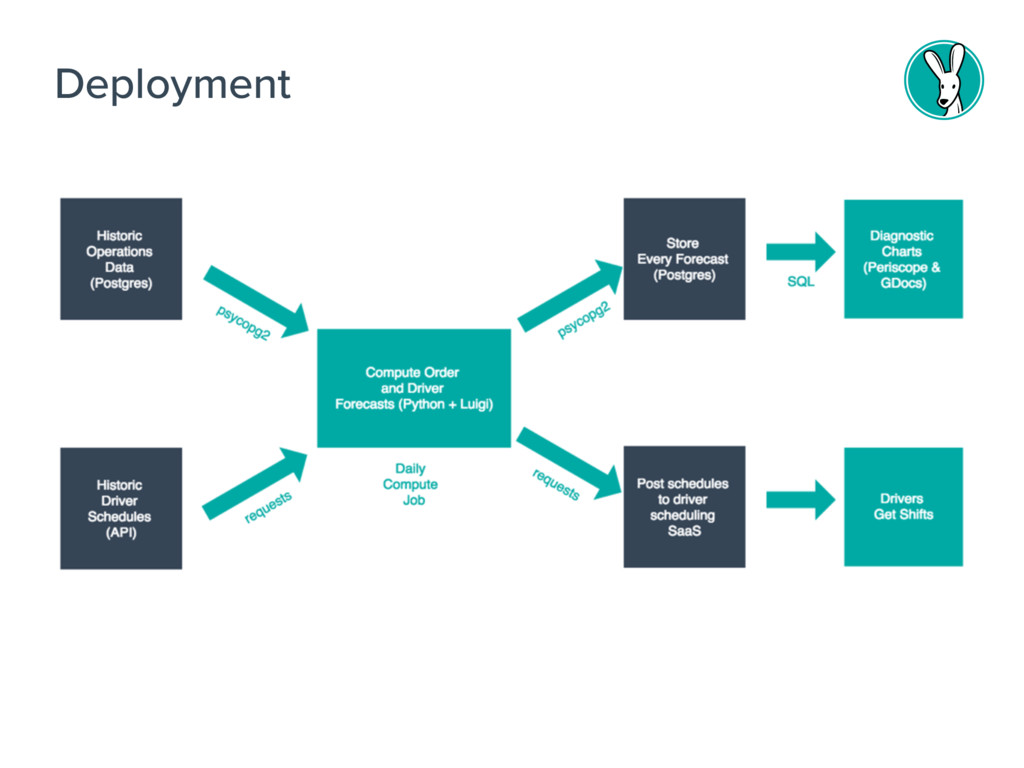
Deployment
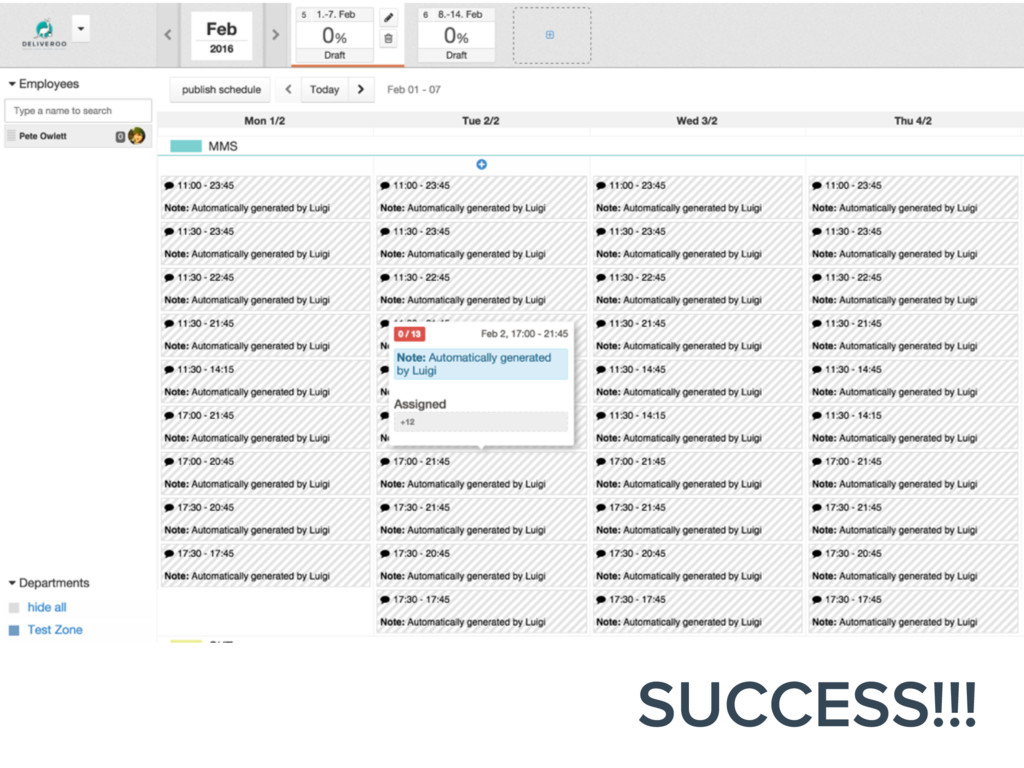
SUCCESS!!!
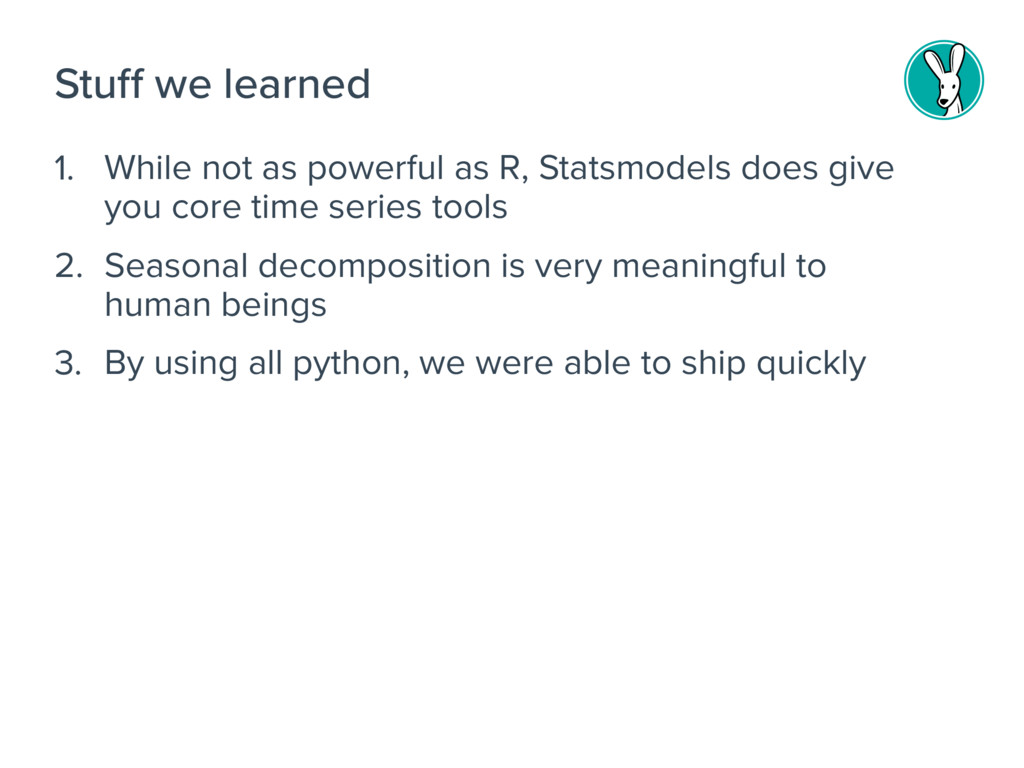
1. While not as powerful as R, Statsmodels does give
you core time series tools 2. Seasonal decomposition is very meaningful to human beings 3. By using all python, we were able to ship quickly Stuff we learned
Thanks!