do we need to use to effectively evaluate the stability of MABs ? What do we need to consider when interpreting the results from these techniques? What amount/type of degradation is significant/important? - Acceptance criteria
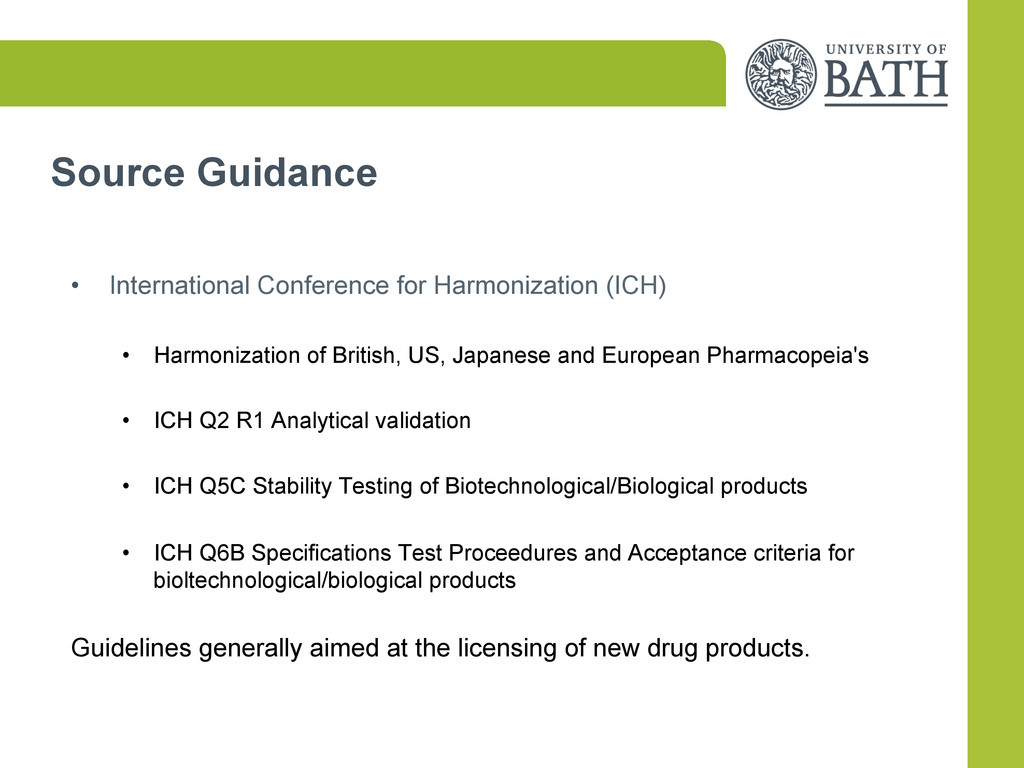
of British, US, Japanese and European Pharmacopeia's • ICH Q2 R1 Analytical validation • ICH Q5C Stability Testing of Biotechnological/Biological products • ICH Q6B Specifications Test Proceedures and Acceptance criteria for bioltechnological/biological products Guidelines generally aimed at the licensing of new drug products.
their derivatives and products of which they are components and which are isolated from tissues, body fluids, cell cultures, or produced using rDNA technology Ø cytokines (interferons, interleukins, colony-‐stimulating factors, tumour necrosis factors) Ø erythropoietins Ø plasminogen activators Ø blood plasma factors Ø growth hormones and growth factors Ø insulins Ø monoclonal antibodies Ø vaccines consisting of well-‐characterised proteins or polypeptides
‘recipe’ for how to analyse or interpret MAB stability DOES : Outline criteria for a sound approach to designing protocols for determining stability. • Primary data to support a requested storage period, long-term, real-time and real-condition stability studies • Preferable NOT to use accelerated/stressed stability testing
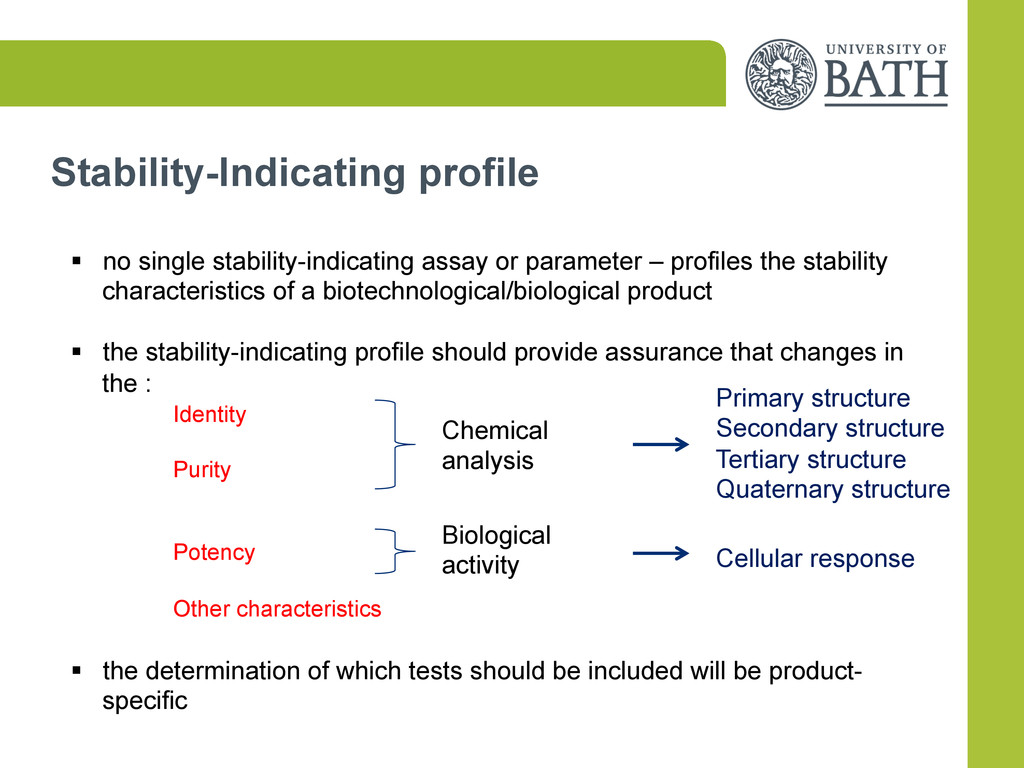
profiles the stability characteristics of a biotechnological/biological product § the stability-indicating profile should provide assurance that changes in the : Identity Purity Potency Other characteristics § the determination of which tests should be included will be product- specific Chemical analysis Biological activity Cellular response Primary structure Secondary structure Tertiary structure Quaternary structure
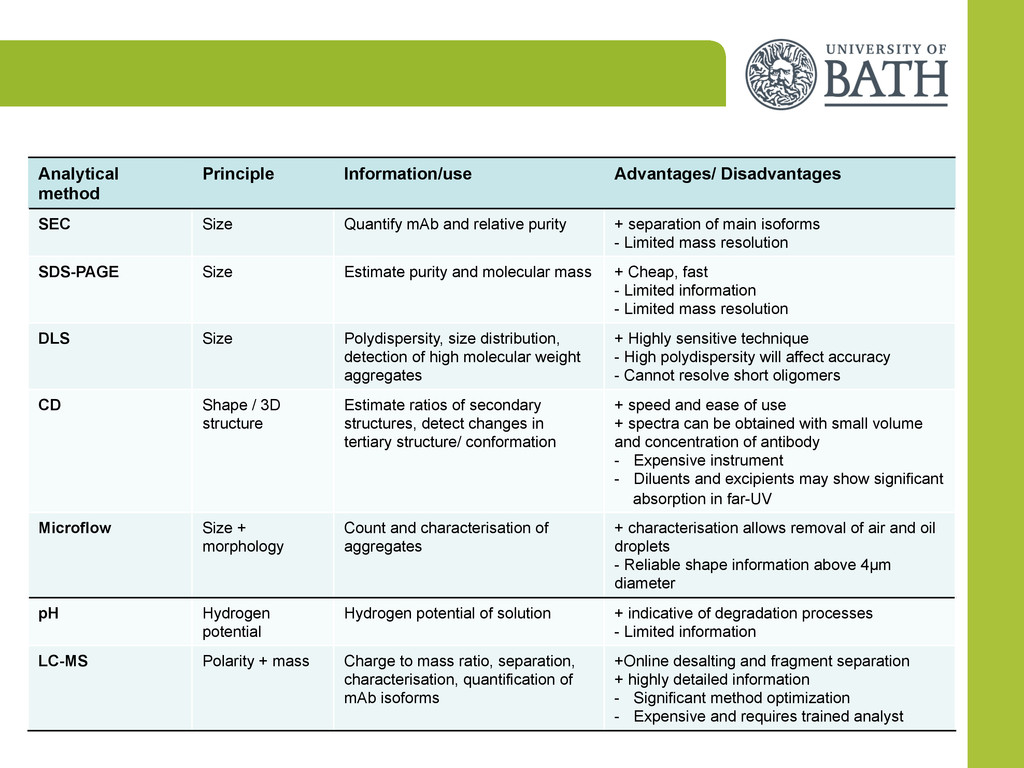
and relative purity + separation of main isoforms - Limited mass resolution SDS-PAGE Size Estimate purity and molecular mass + Cheap, fast - Limited information - Limited mass resolution DLS Size Polydispersity, size distribution, detection of high molecular weight aggregates + Highly sensitive technique - High polydispersity will affect accuracy - Cannot resolve short oligomers CD Shape / 3D structure Estimate ratios of secondary structures, detect changes in tertiary structure/ conformation + speed and ease of use + spectra can be obtained with small volume and concentration of antibody - Expensive instrument - Diluents and excipients may show significant absorption in far-UV Microflow Size + morphology Count and characterisation of aggregates + characterisation allows removal of air and oil droplets - Reliable shape information above 4µm diameter pH Hydrogen potential Hydrogen potential of solution + indicative of degradation processes - Limited information LC-MS Polarity + mass Charge to mass ratio, separation, characterisation, quantification of mAb isoforms +Online desalting and fragment separation + highly detailed information - Significant method optimization - Expensive and requires trained analyst
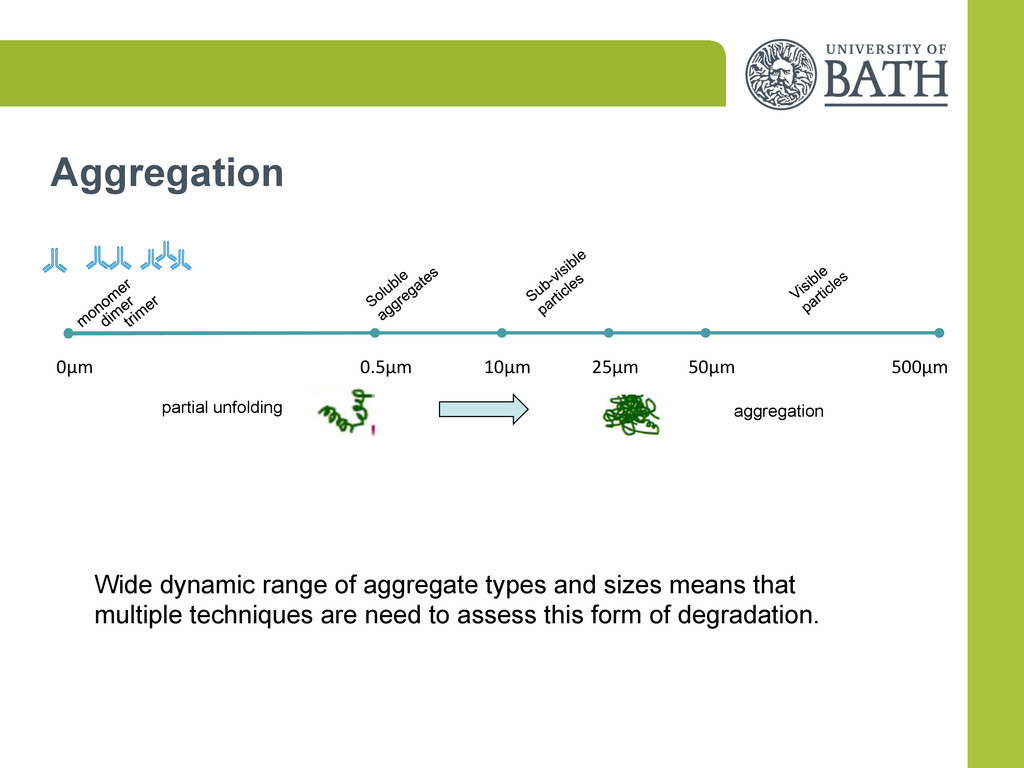
0.5µm 10µm 25µm 50µm 500µm partial unfolding aggregation Wide dynamic range of aggregate types and sizes means that multiple techniques are need to assess this form of degradation.
%PD Oligomeric Species mean r.nm High MW Aggregates mean r.nm Oligomeric Species (%Volume) High MW Aggregates (% Volume) Day A 7.98 0.07 27.33 8.67 0.00 100.00 0.00 Day D 8.27 0.10 31.56 8.75 2584.67 100.00 0.00 Day C 8.03 0.07 25.84 8.69 0.00 100.00 0.00 Day D 8.05 0.08 28.27 8.79 0.00 100.00 0.00 Day E 7.99 0.05 23.15 8.53 0.00 100.00 0.00 Day F 8.02 0.07 26.12 8.67 0.00 100.00 0.00 Day G 8.87 0.17 41.58 9.63 2323.33 99.98 0.02 Day H 7.97 0.05 22.53 8.50 0.00 100.00 0.00 Day I 7.95 0.05 21.93 8.49 0.00 100.00 0.00 Day J 8.09 0.08 27.97 8.79 0.00 100.00 0.00 • Sample is illuminated with a laser • Measures time dependant fluctuations in the intensity of scattered light • Fluctuations occur because particles are constantly undergoing Brownian motion • Effectively measures velocity of molecules which can be converted on to an equivalent hydrodynamic radius. The size distribution obtained is a plot of the relative intensity of light scattered by particles in various size classes. monomer aggregate
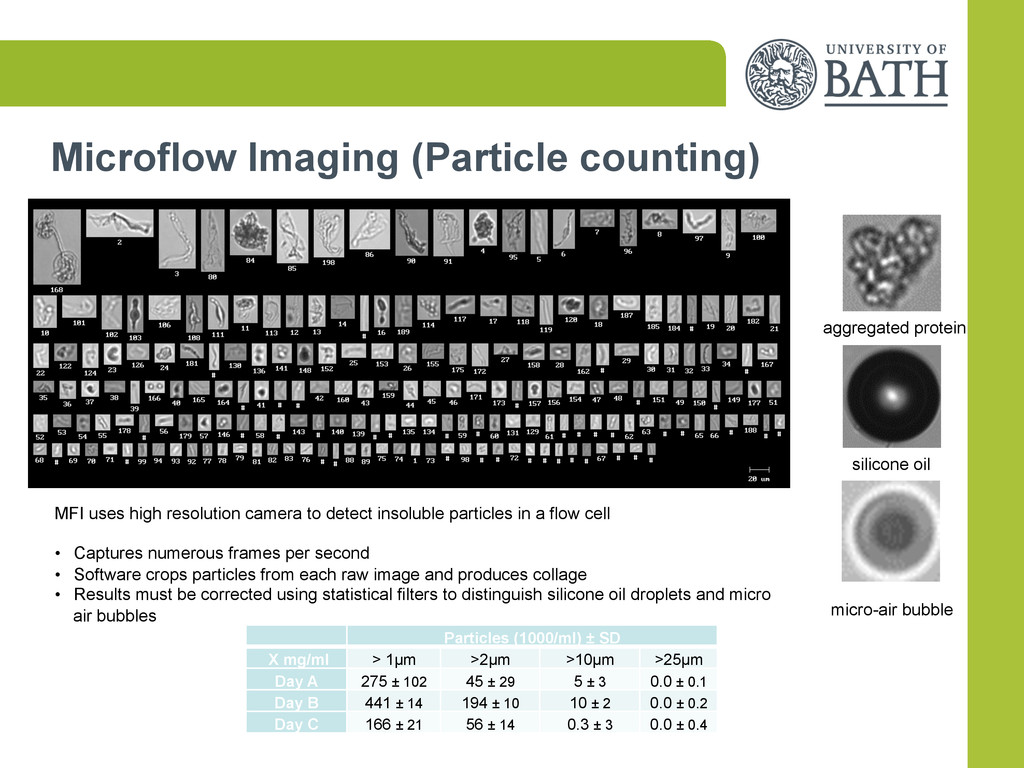
X mg/ml > 1µm >2µm >10µm >25µm Day A 275 ± 102 45 ± 29 5 ± 3 0.0 ± 0.1 Day B 441 ± 14 194 ± 10 10 ± 2 0.0 ± 0.2 Day C 166 ± 21 56 ± 14 0.3 ± 3 0.0 ± 0.4 micro-air bubble silicone oil aggregated protein MFI uses high resolution camera to detect insoluble particles in a flow cell • Captures numerous frames per second • Software crops particles from each raw image and produces collage • Results must be corrected using statistical filters to distinguish silicone oil droplets and micro air bubbles
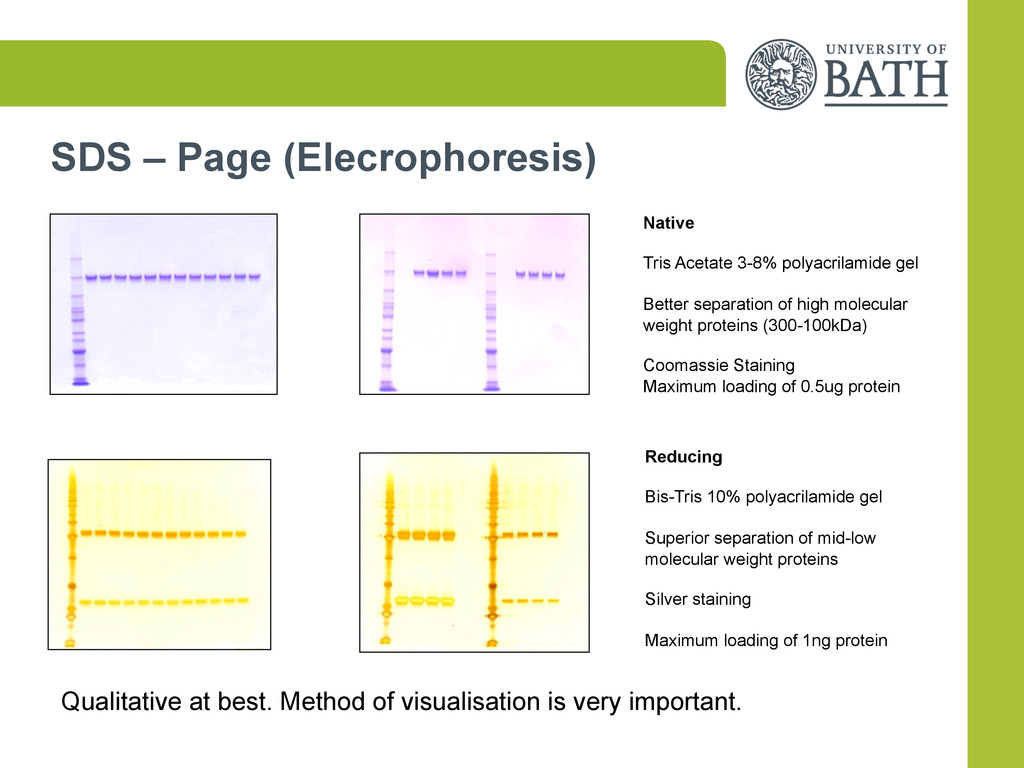
Better separation of high molecular weight proteins (300-100kDa) Coomassie Staining Maximum loading of 0.5ug protein Reducing Bis-Tris 10% polyacrilamide gel Superior separation of mid-low molecular weight proteins Silver staining Maximum loading of 1ng protein Qualitative at best. Method of visualisation is very important.
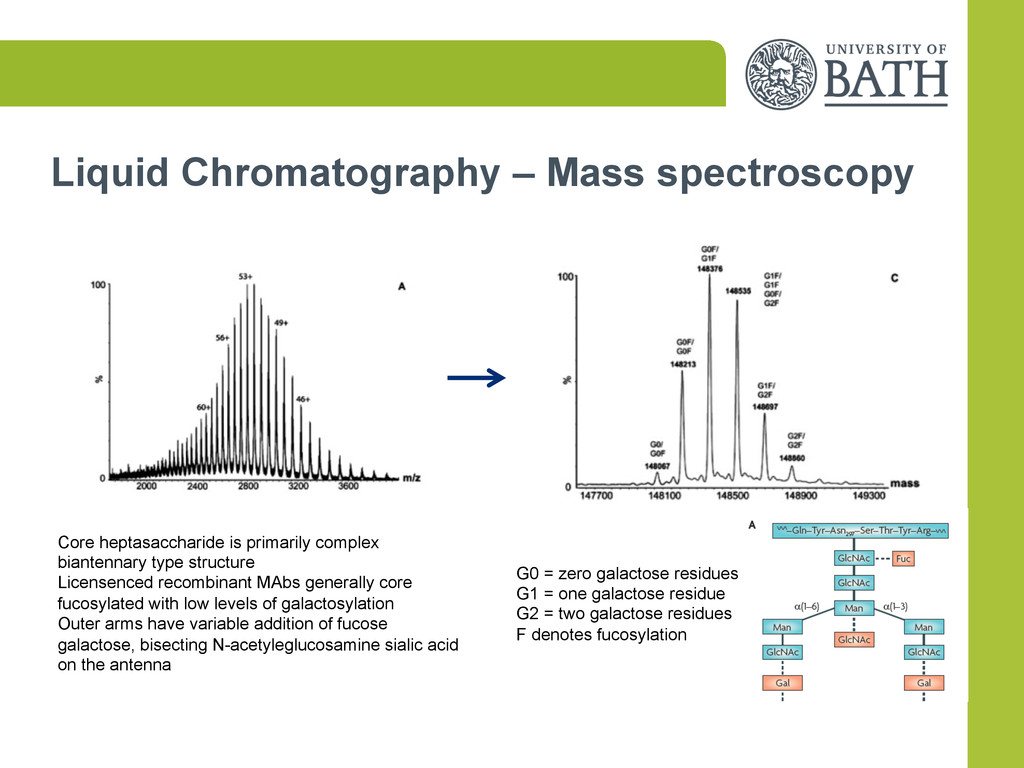
biantennary type structure Licensenced recombinant MAbs generally core fucosylated with low levels of galactosylation Outer arms have variable addition of fucose galactose, bisecting N-acetyleglucosamine sialic acid on the antenna G0 = zero galactose residues G1 = one galactose residue G2 = two galactose residues F denotes fucosylation
right hand circularly polarised light • Molecules must be chiral • Far-UV range used for analysis of secondary structure (200-260nm) • Near-UV range used for analysis of tertiary structure (260-350nm) • Use computer program to estimate ratios of secondary structures β-sheets, α-helices etc • Compare spectra between time points and also examine thermal stability
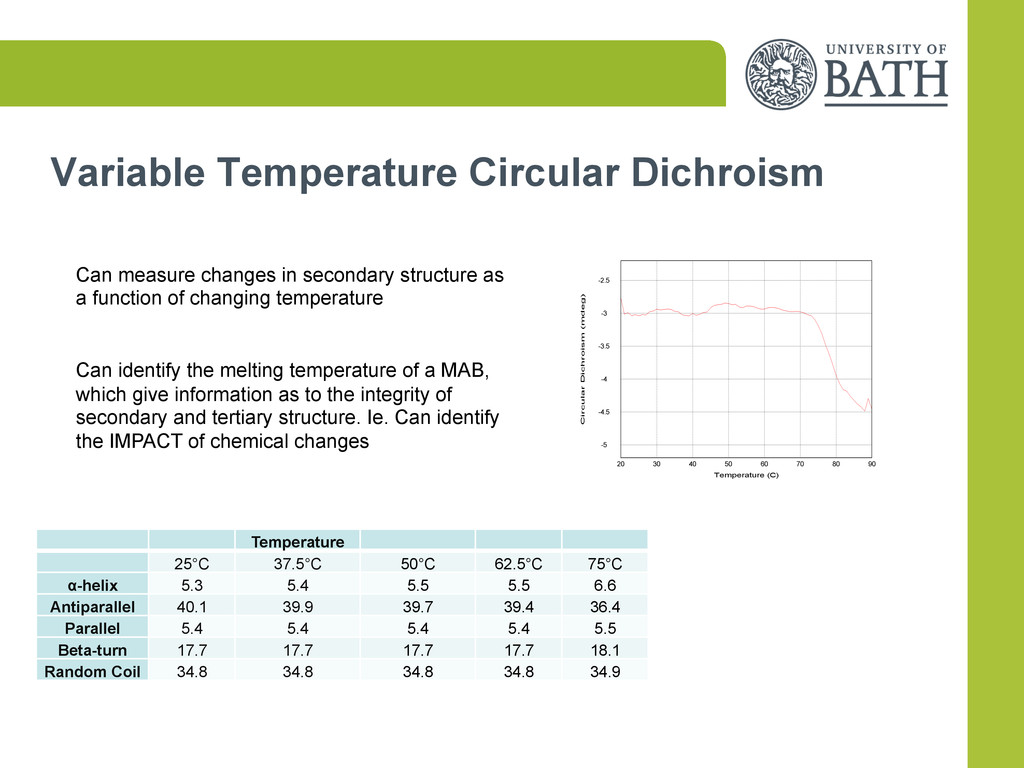
as a function of changing temperature Can identify the melting temperature of a MAB, which give information as to the integrity of secondary and tertiary structure. Ie. Can identify the IMPACT of chemical changes Temperature 25°C 37.5°C 50°C 62.5°C 75°C α-helix 5.3 5.4 5.5 5.5 6.6 Antiparallel 40.1 39.9 39.7 39.4 36.4 Parallel 5.4 5.4 5.4 5.4 5.5 Beta-turn 17.7 17.7 17.7 17.7 18.1 Random Coil 34.8 34.8 34.8 34.8 34.9
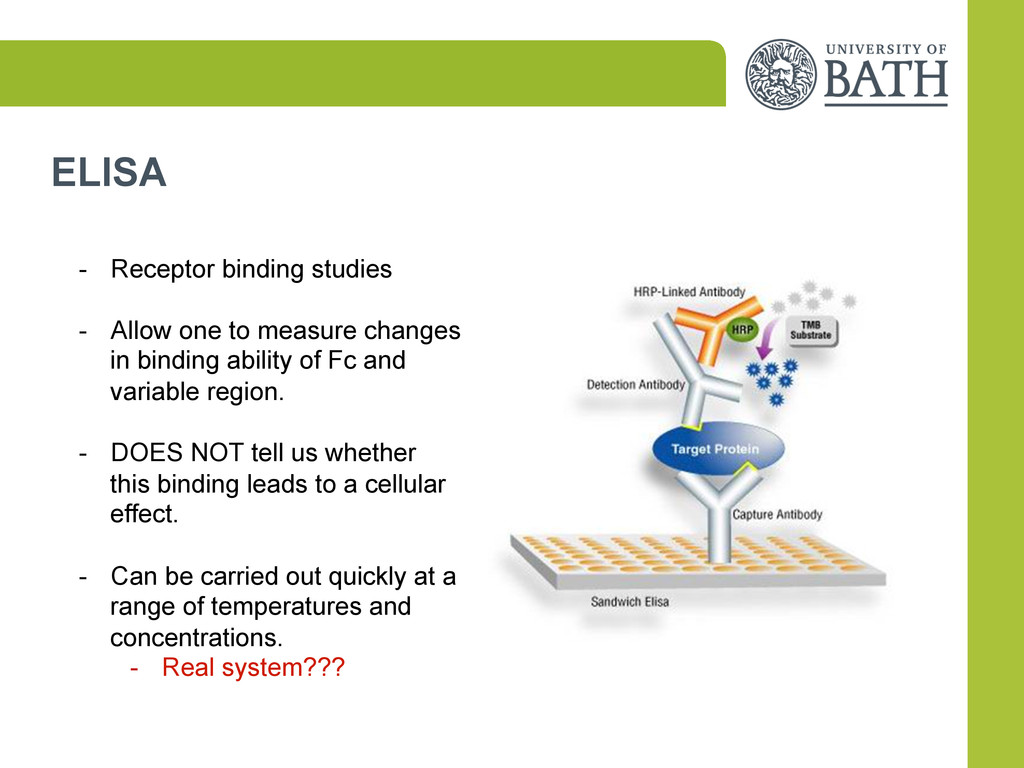
changes in binding ability of Fc and variable region. - DOES NOT tell us whether this binding leads to a cellular effect. - Can be carried out quickly at a range of temperatures and concentrations. - Real system???
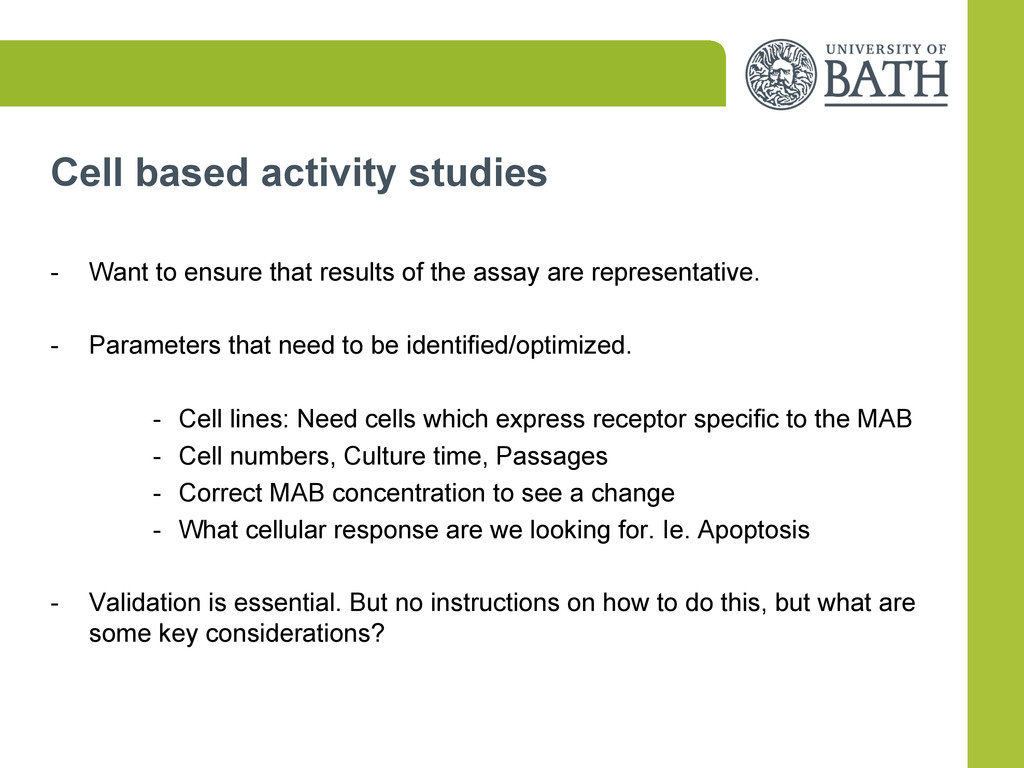
of the assay are representative. - Parameters that need to be identified/optimized. - Cell lines: Need cells which express receptor specific to the MAB - Cell numbers, Culture time, Passages - Correct MAB concentration to see a change - What cellular response are we looking for. Ie. Apoptosis - Validation is essential. But no instructions on how to do this, but what are some key considerations?
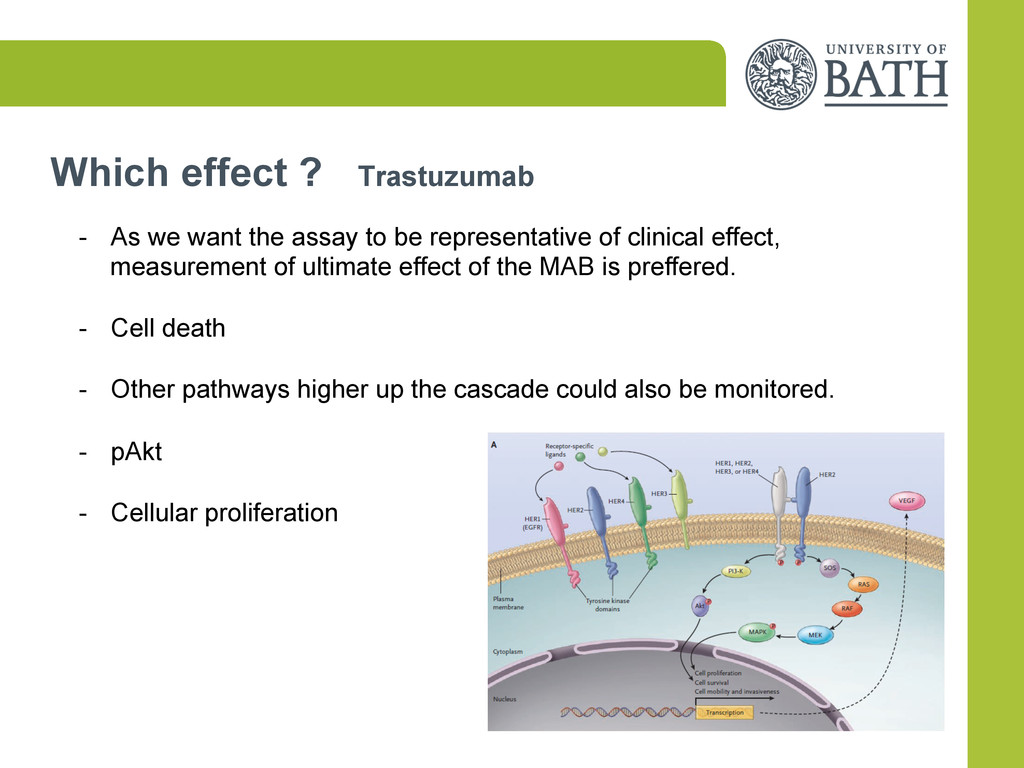
to be representative of clinical effect, measurement of ultimate effect of the MAB is preffered. - Cell death - Other pathways higher up the cascade could also be monitored. - pAkt - Cellular proliferation
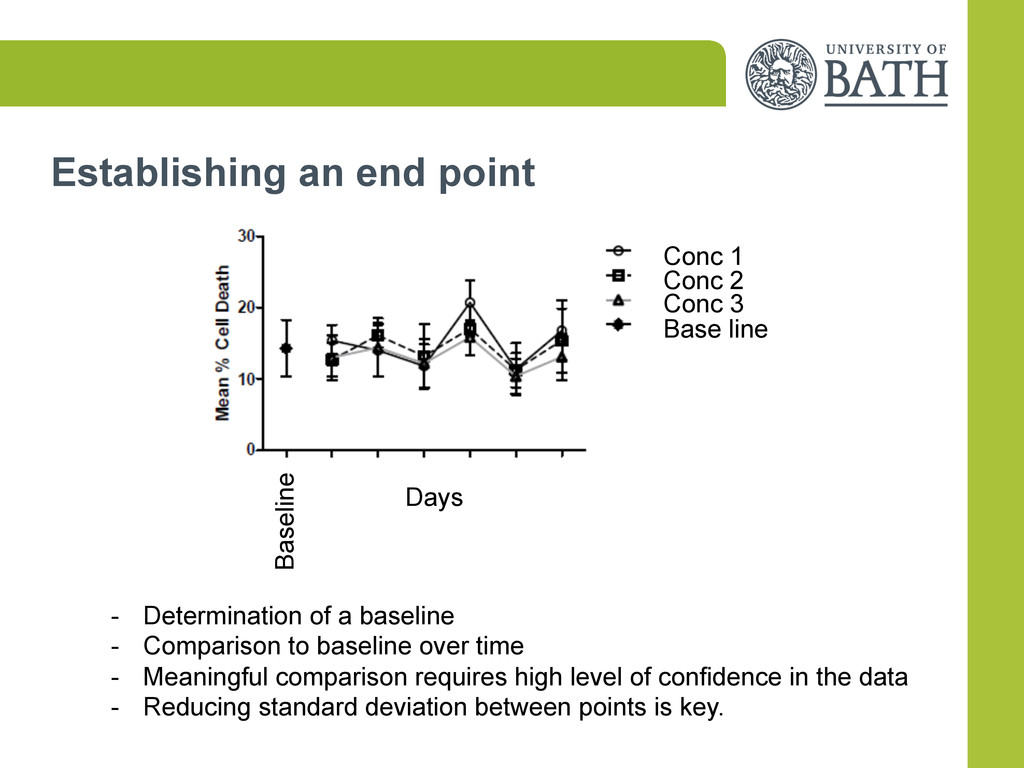
Conc 1 Days Baseline - Determination of a baseline - Comparison to baseline over time - Meaningful comparison requires high level of confidence in the data - Reducing standard deviation between points is key.