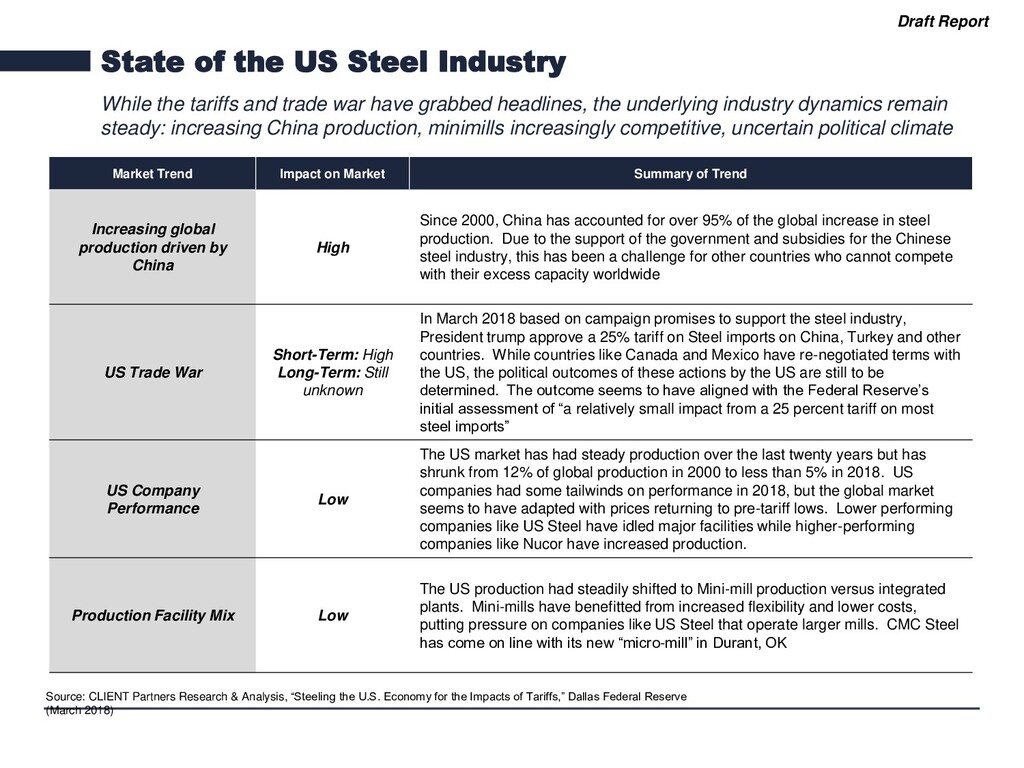
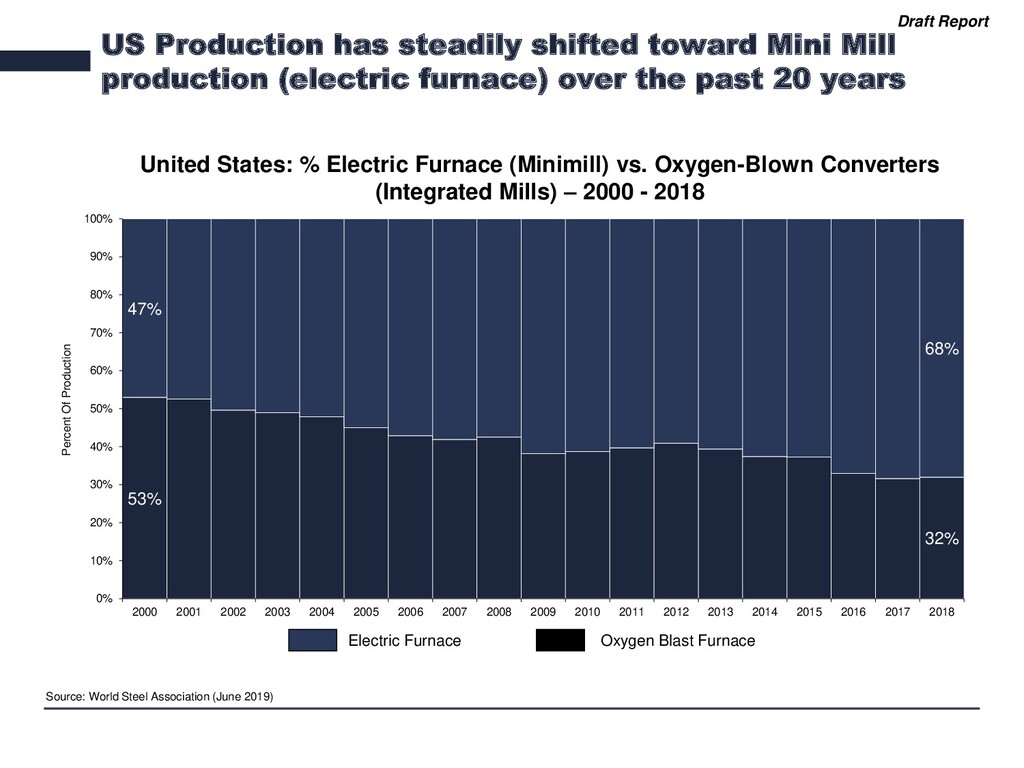
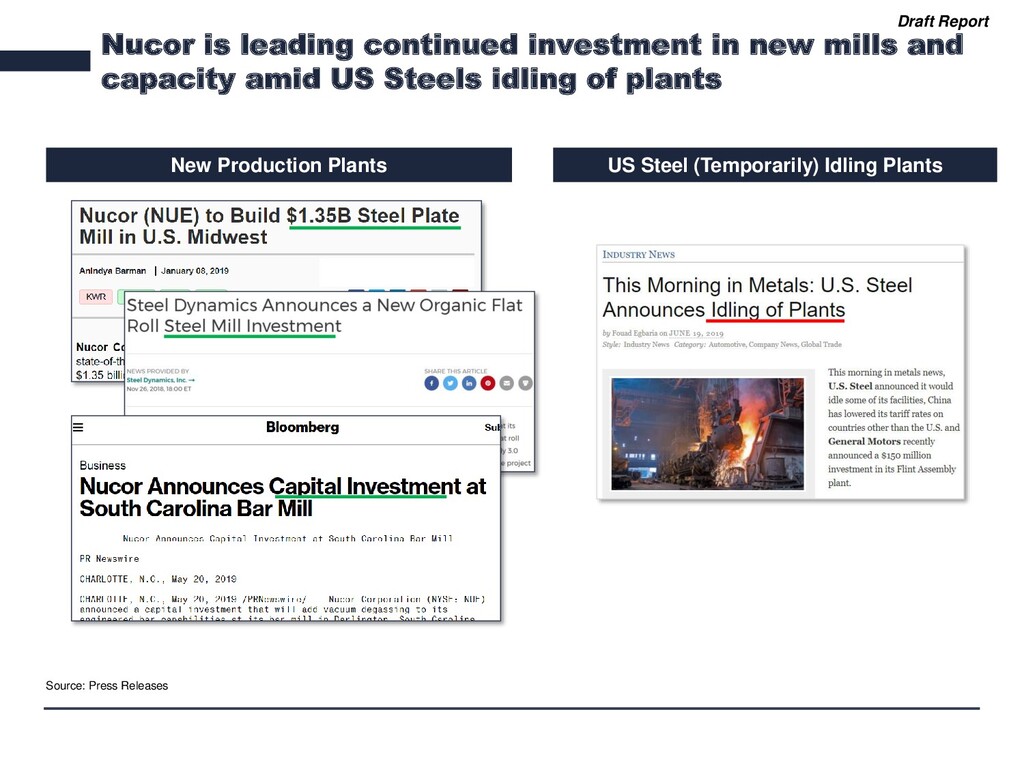
tariffs and trade war have grabbed headlines, the underlying industry dynamics remain steady: increasing China production, minimills increasingly competitive, uncertain political climate Source: CLIENT Partners Research & Analysis, “Steeling the U.S. Economy for the Impacts of Tariffs,” Dallas Federal Reserve (March 2018) Market Trend Impact on Market Summary of Trend Increasing global production driven by China High Since 2000, China has accounted for over 95% of the global increase in steel production. Due to the support of the government and subsidies for the Chinese steel industry, this has been a challenge for other countries who cannot compete with their excess capacity worldwide US Trade War Short-Term: High Long-Term: Still unknown In March 2018 based on campaign promises to support the steel industry, President trump approve a 25% tariff on Steel imports on China, Turkey and other countries. While countries like Canada and Mexico have re-negotiated terms with the US, the political outcomes of these actions by the US are still to be determined. The outcome seems to have aligned with the Federal Reserve’s initial assessment of “a relatively small impact from a 25 percent tariff on most steel imports” US Company Performance Low The US market has had steady production over the last twenty years but has shrunk from 12% of global production in 2000 to less than 5% in 2018. US companies had some tailwinds on performance in 2018, but the global market seems to have adapted with prices returning to pre-tariff lows. Lower performing companies like US Steel have idled major facilities while higher-performing companies like Nucor have increased production. Production Facility Mix Low The US production had steadily shifted to Mini-mill production versus integrated plants. Mini-mills have benefitted from increased flexibility and lower costs, putting pressure on companies like US Steel that operate larger mills. CMC Steel has come on line with its new “micro-mill” in Durant, OK
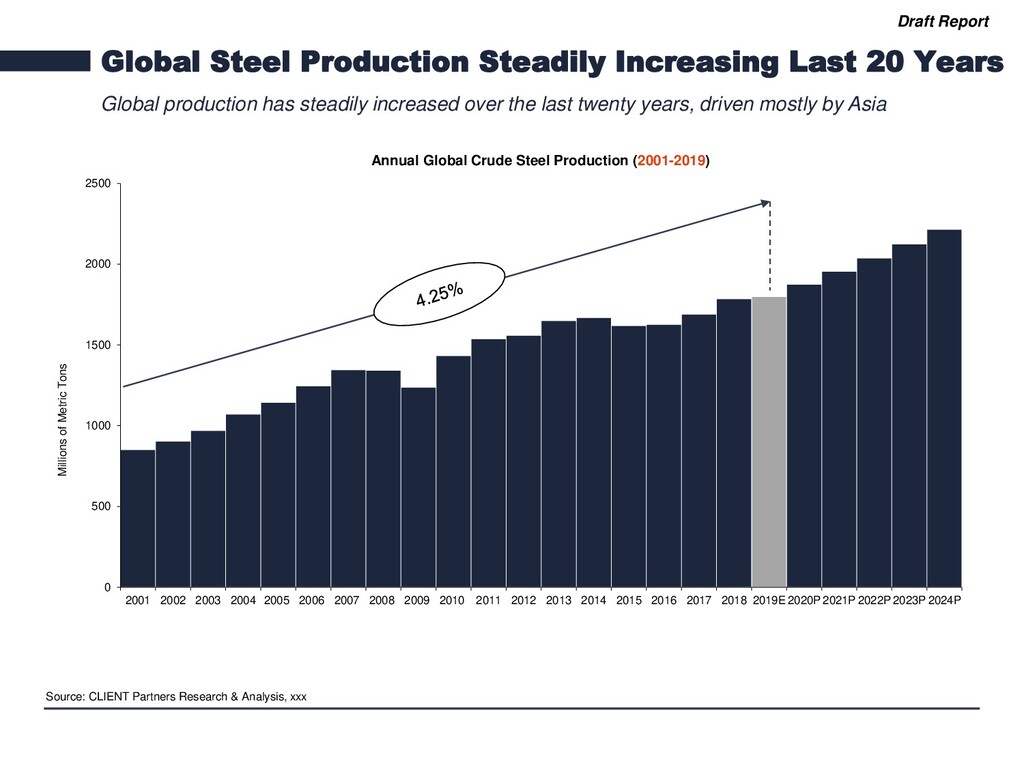
Global production has steadily increased over the last twenty years, driven mostly by Asia Source: CLIENT Partners Research & Analysis, xxx Annual Global Crude Steel Production (2001-2019) 0 500 1000 1500 2000 2500 2001 2002 2003 2004 2005 2006 2007 2008 2009 2010 2011 2012 2013 2014 2015 2016 2017 2018 2019E 2020P 2021P 2022P 2023P 2024P Millions of Metric Tons
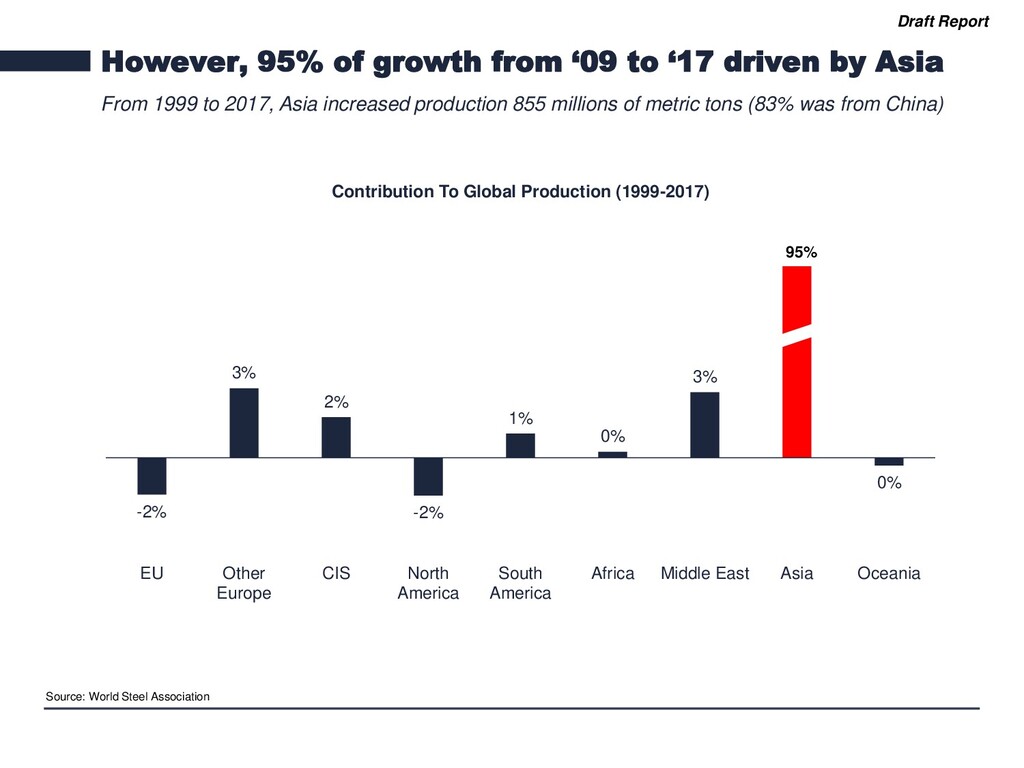
driven by Asia From 1999 to 2017, Asia increased production 855 millions of metric tons (83% was from China) -2% 3% 2% -2% 1% 0% 3% 0% EU Other Europe CIS North America South America Africa Middle East Asia Oceania Contribution To Global Production (1999-2017) Source: World Steel Association 95%
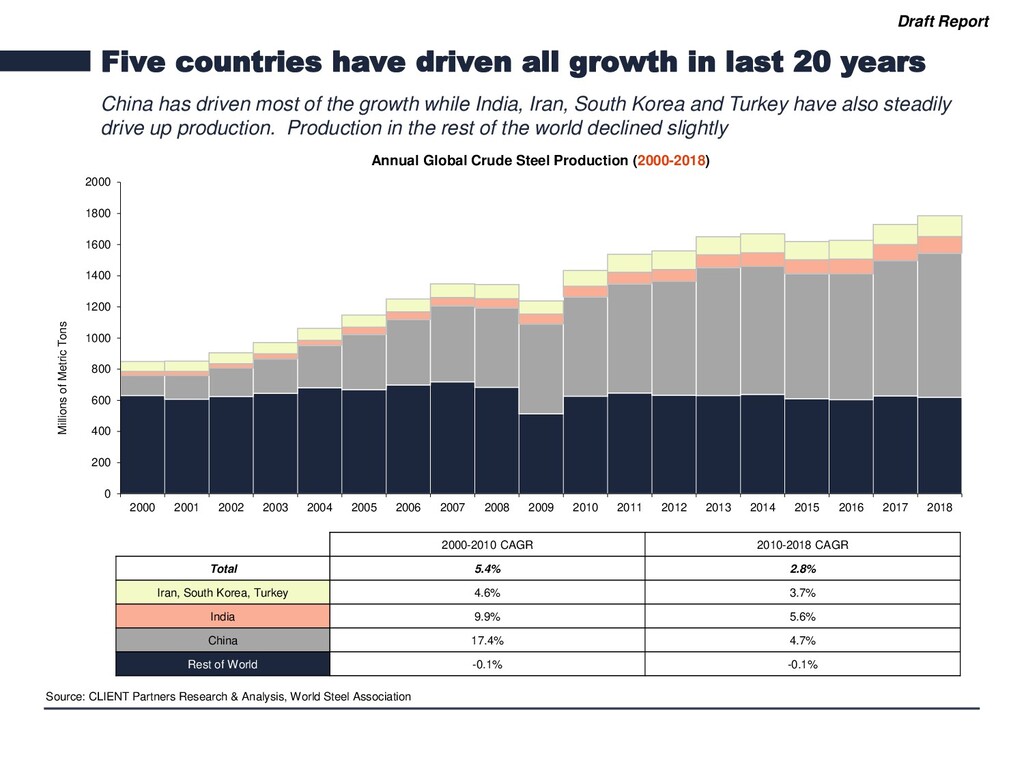
20 years China has driven most of the growth while India, Iran, South Korea and Turkey have also steadily drive up production. Production in the rest of the world declined slightly Source: CLIENT Partners Research & Analysis, World Steel Association Annual Global Crude Steel Production (2000-2018) 0 200 400 600 800 1000 1200 1400 1600 1800 2000 2000 2001 2002 2003 2004 2005 2006 2007 2008 2009 2010 2011 2012 2013 2014 2015 2016 2017 2018 Millions of Metric Tons 2000-2010 CAGR 2010-2018 CAGR Total 5.4% 2.8% Iran, South Korea, Turkey 4.6% 3.7% India 9.9% 5.6% China 17.4% 4.7% Rest of World -0.1% -0.1%
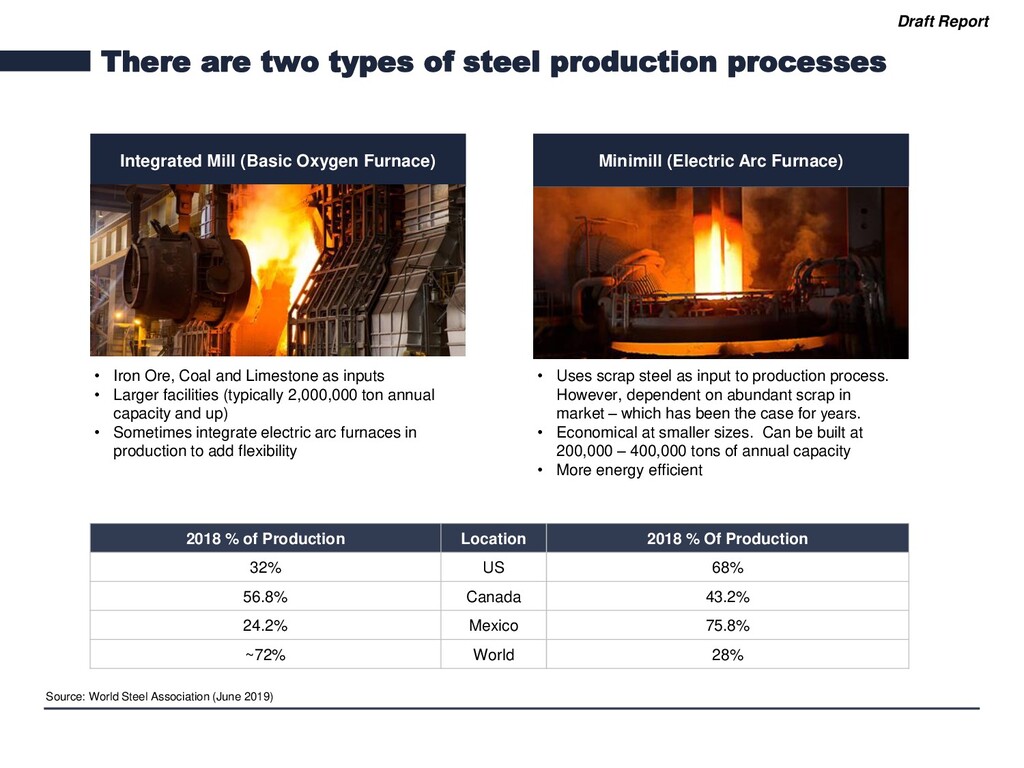
Integrated Mill (Basic Oxygen Furnace) Minimill (Electric Arc Furnace) • Iron Ore, Coal and Limestone as inputs • Larger facilities (typically 2,000,000 ton annual capacity and up) • Sometimes integrate electric arc furnaces in production to add flexibility • Uses scrap steel as input to production process. However, dependent on abundant scrap in market – which has been the case for years. • Economical at smaller sizes. Can be built at 200,000 – 400,000 tons of annual capacity • More energy efficient 2018 % of Production Location 2018 % Of Production 32% US 68% 56.8% Canada 43.2% 24.2% Mexico 75.8% ~72% World 28% Source: World Steel Association (June 2019)
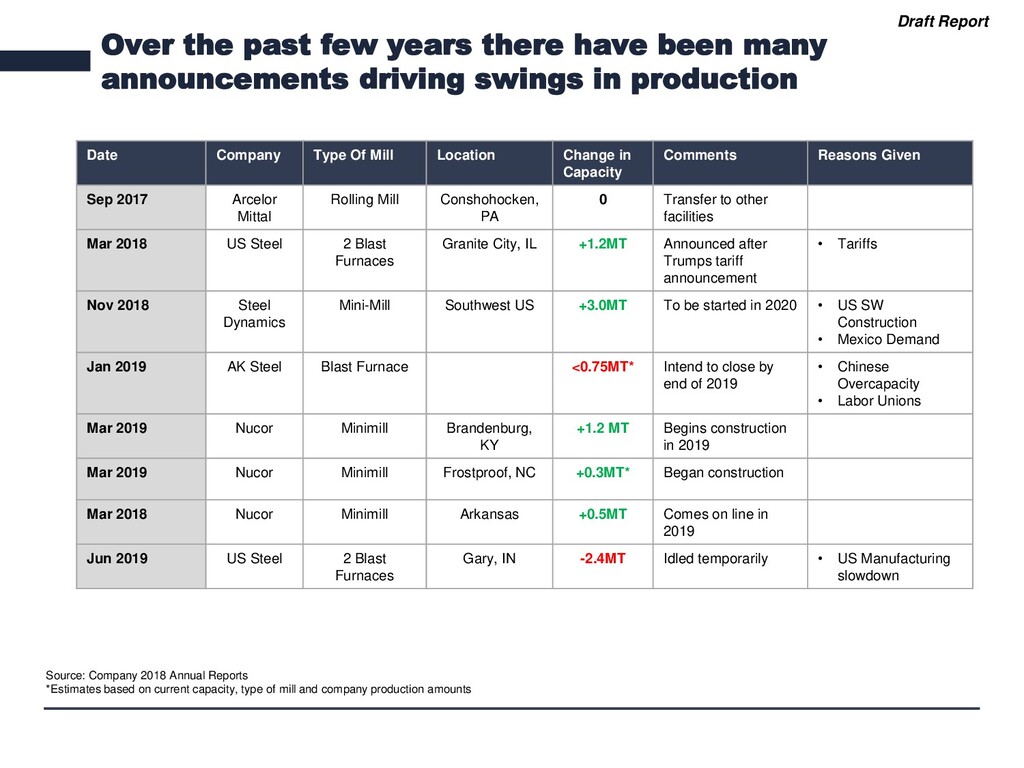
many announcements driving swings in production Date Company Type Of Mill Location Change in Capacity Comments Reasons Given Sep 2017 Arcelor Mittal Rolling Mill Conshohocken, PA 0 Transfer to other facilities Mar 2018 US Steel 2 Blast Furnaces Granite City, IL +1.2MT Announced after Trumps tariff announcement • Tariffs Nov 2018 Steel Dynamics Mini-Mill Southwest US +3.0MT To be started in 2020 • US SW Construction • Mexico Demand Jan 2019 AK Steel Blast Furnace <0.75MT* Intend to close by end of 2019 • Chinese Overcapacity • Labor Unions Mar 2019 Nucor Minimill Brandenburg, KY +1.2 MT Begins construction in 2019 Mar 2019 Nucor Minimill Frostproof, NC +0.3MT* Began construction Mar 2018 Nucor Minimill Arkansas +0.5MT Comes on line in 2019 Jun 2019 US Steel 2 Blast Furnaces Gary, IN -2.4MT Idled temporarily • US Manufacturing slowdown Source: Company 2018 Annual Reports *Estimates based on current capacity, type of mill and company production amounts
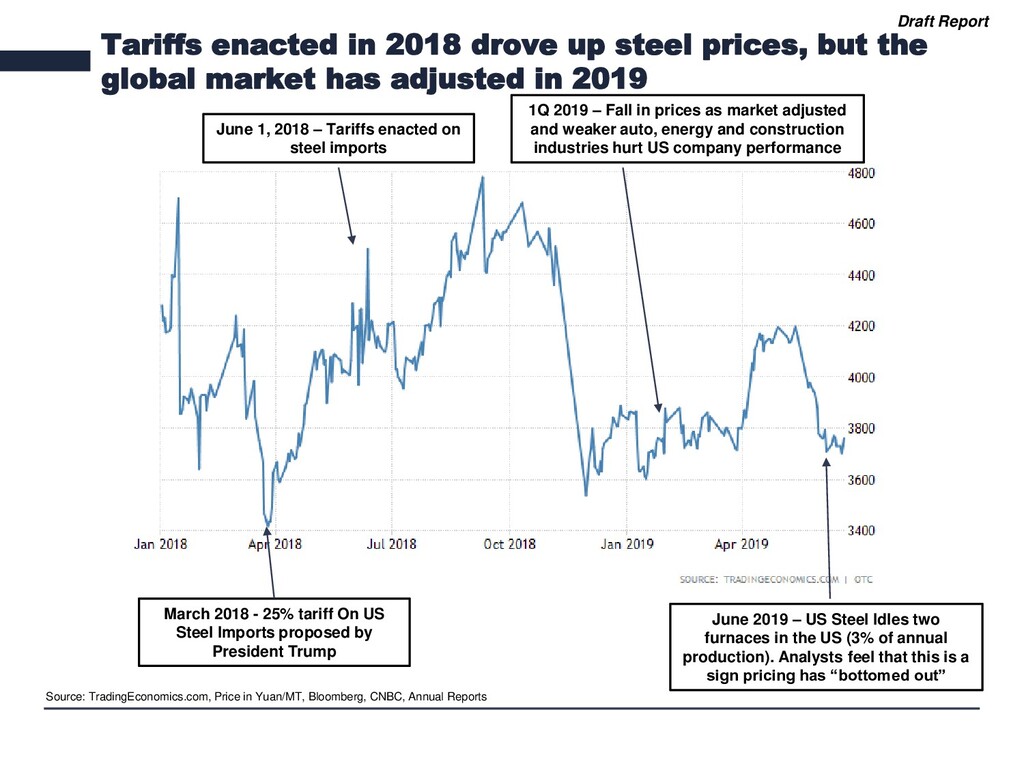
but the global market has adjusted in 2019 March 2018 - 25% tariff On US Steel Imports proposed by President Trump Source: TradingEconomics.com, Price in Yuan/MT, Bloomberg, CNBC, Annual Reports June 1, 2018 – Tariffs enacted on steel imports June 2019 – US Steel Idles two furnaces in the US (3% of annual production). Analysts feel that this is a sign pricing has “bottomed out” 1Q 2019 – Fall in prices as market adjusted and weaker auto, energy and construction industries hurt US company performance
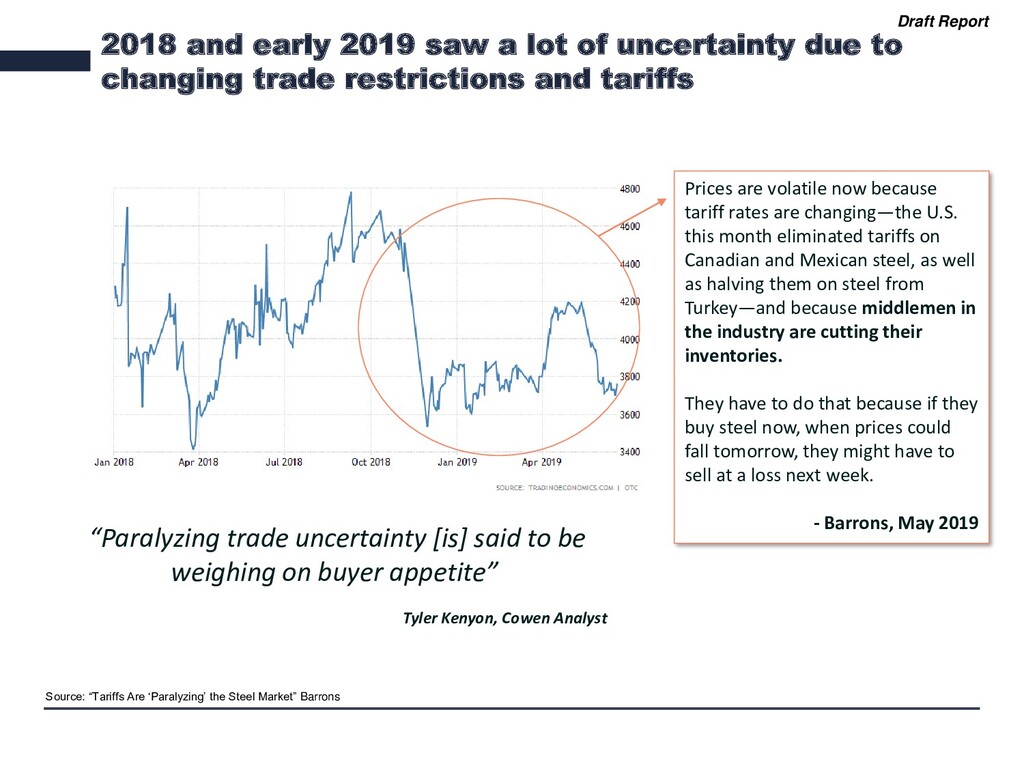
uncertainty due to changing trade restrictions and tariffs Prices are volatile now because tariff rates are changing—the U.S. this month eliminated tariffs on Canadian and Mexican steel, as well as halving them on steel from Turkey—and because middlemen in the industry are cutting their inventories. They have to do that because if they buy steel now, when prices could fall tomorrow, they might have to sell at a loss next week. - Barrons, May 2019 “Paralyzing trade uncertainty [is] said to be weighing on buyer appetite” Tyler Kenyon, Cowen Analyst Source: “Tariffs Are ‘Paralyzing’ the Steel Market” Barrons
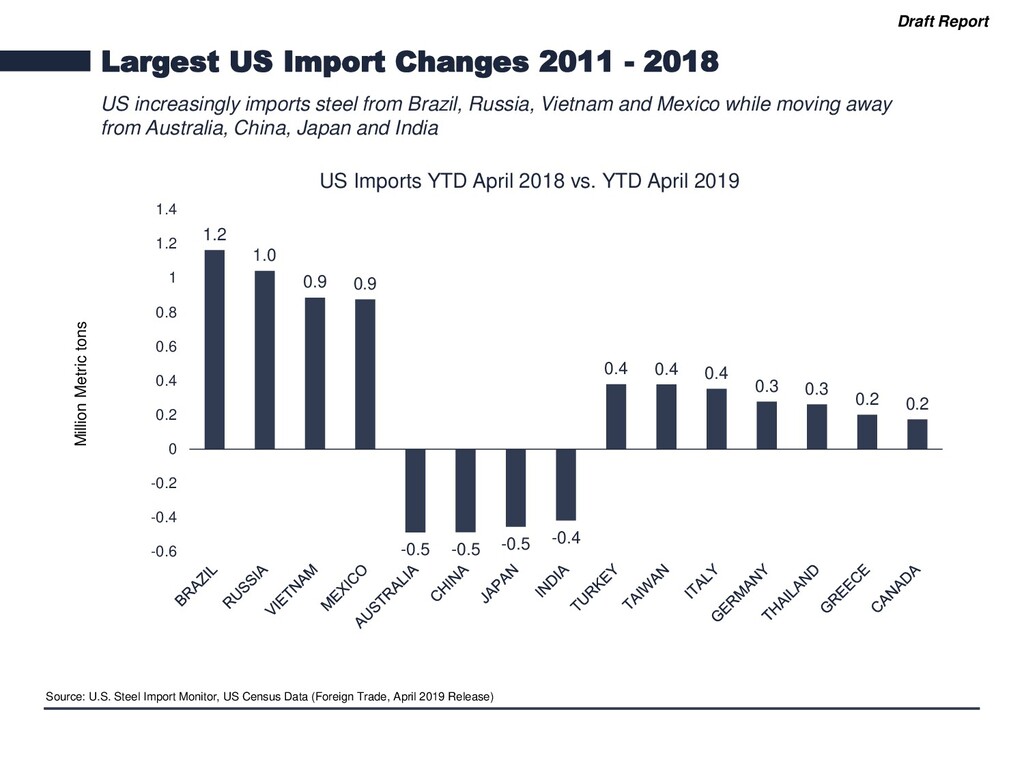
increasingly imports steel from Brazil, Russia, Vietnam and Mexico while moving away from Australia, China, Japan and India 1.2 1.0 0.9 0.9 -0.5 -0.5 -0.5 -0.4 0.4 0.4 0.4 0.3 0.3 0.2 0.2 -0.6 -0.4 -0.2 0 0.2 0.4 0.6 0.8 1 1.2 1.4 US Imports YTD April 2018 vs. YTD April 2019 Million Metric tons Source: U.S. Steel Import Monitor, US Census Data (Foreign Trade, April 2019 Release)