Upgrade to Pro — share decks privately, control downloads, hide ads and more …

Data Visualization under Uncertainty

Adam Hyland
February 14, 2013

Data Visualization under Uncertainty

Talk for the Boston Data Viz meetup. Covering visual display of uncertainty, modeling and bringing statistics into data vis. Notes, links and source code available here: https://gist.github.com/Protonk/4961378

Adam Hyland

February 14, 2013
Tweet

More Decks by Adam Hyland

Other Decks in Programming

Transcript

  1. Why are we here? • Data visualization is a tool

    • Develop a narrative • Inform a decision • Make clear a message • Data is complex enough • But...
  2. Certainty and Narrative The...decision we made was to present data

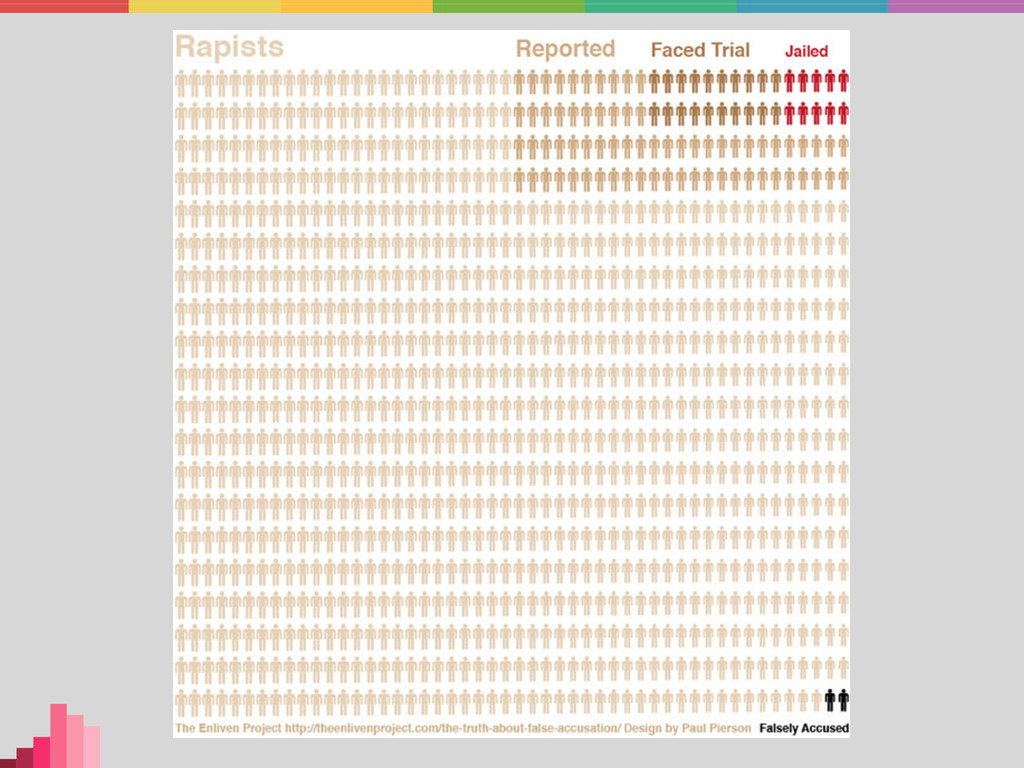
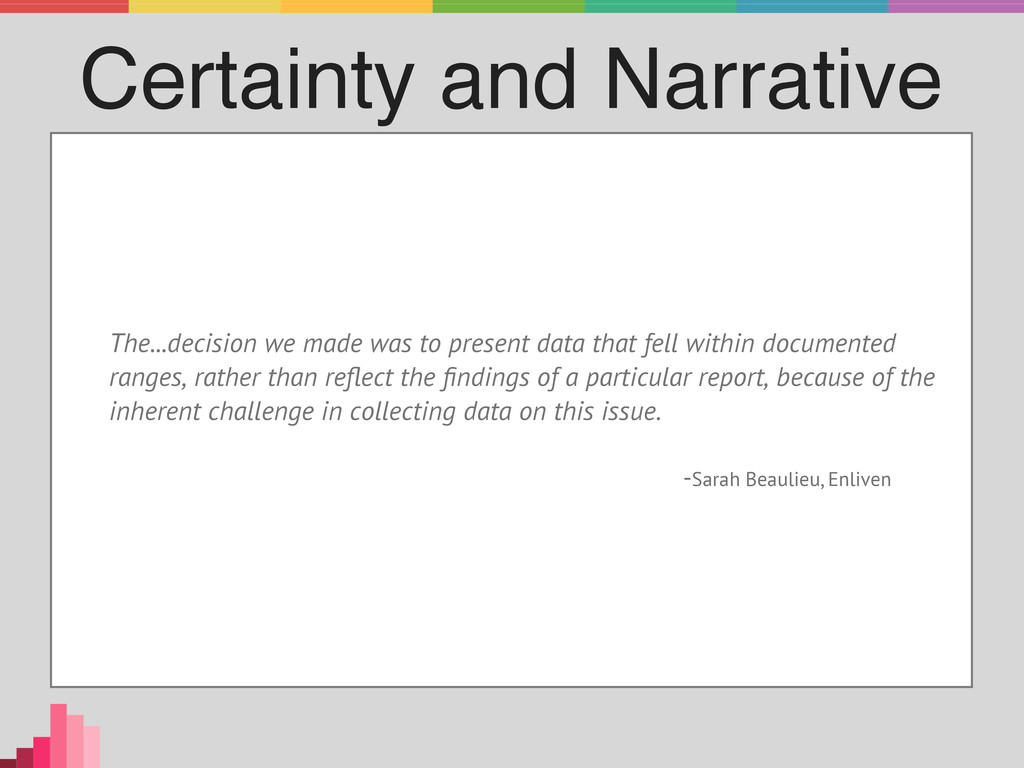
    that fell within documented ranges, rather than reflect the findings of a particular report, because of the inherent challenge in collecting data on this issue. -Sarah Beaulieu, Enliven
  3. What happened? • Enliven presented a point estimate • They

    felt this was a responsible choice • Actual data is animated by uncertainty
  4. How do we solve this? • Mix of high and

    low level topics • Some examples from the web, some in R • Strategies
  5. How do we do it now? • Where do we

    handle uncertainty in visualization well? • Sciences • Forecasting • Poorly? • Pretty much everywhere else
  6. But I repeat myself • What do we mean by

    stochastic uncertainty? • Dispersion • Sampled or not • A canonical example
  7. What’s better, exactly? • The Good: • Conveys dispersion in

    results • Helps reader to infer estimate • The Bad: • Let’s see the site itself... • The Ugly: • Overplotting, etc.
  8. Visual language • How do we think about stochastic uncertainty?

    • How to show it? • Boxplots • Density estimates • Bootstrap • Models: in our department?
  9. Model Uncertainty • Model error is a term of art

    • Can refer to errors in statistical models, or simpler models
  10. Forecasting • Distinct only because our data will usually embed

    the prediction • Uncertainty comes from obvious and non- obvious places • Already have a strong visual language
  11. • Almost (all) visualization leans on estimators • Alternative to

    good statistics... • Expose more of the model
  12. Let’s do it! • Push new things into our visual

    language • People trained by bad visualization • Retraining is hard work