“So tell me,” my manager said, “what is an average?”
There’s probably nothing worse than that sinking feeling when you finish an analysis, email it to your manager or client to review, and they point out a mistake so basic you can’t even fathom how you missed it.
This talk is about mine: how to take an average.
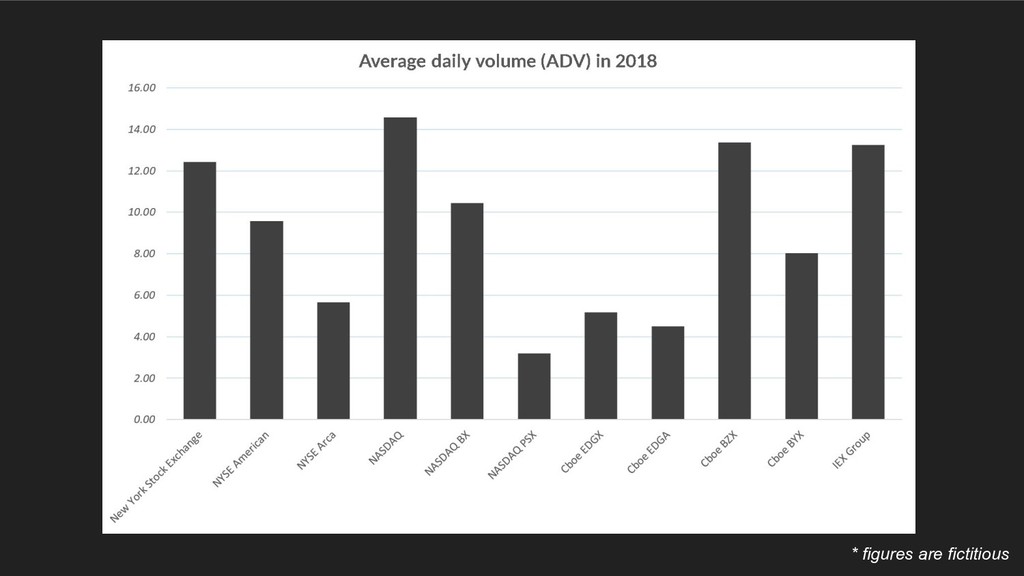
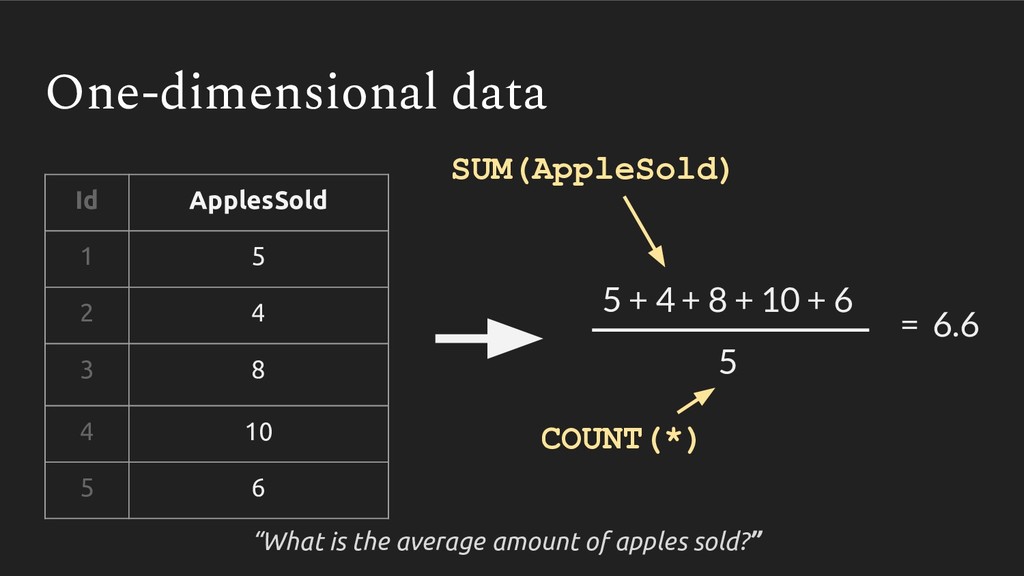
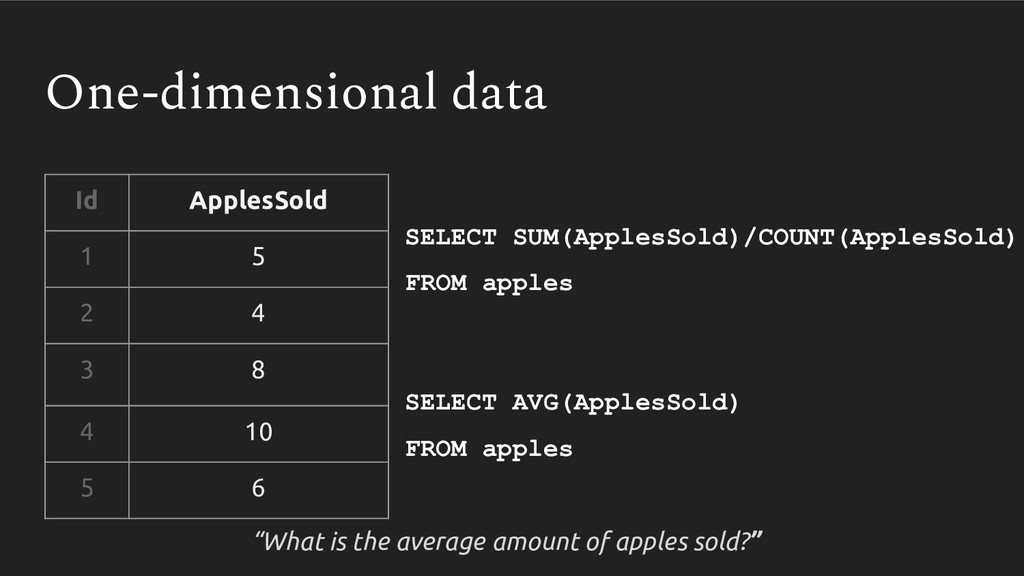
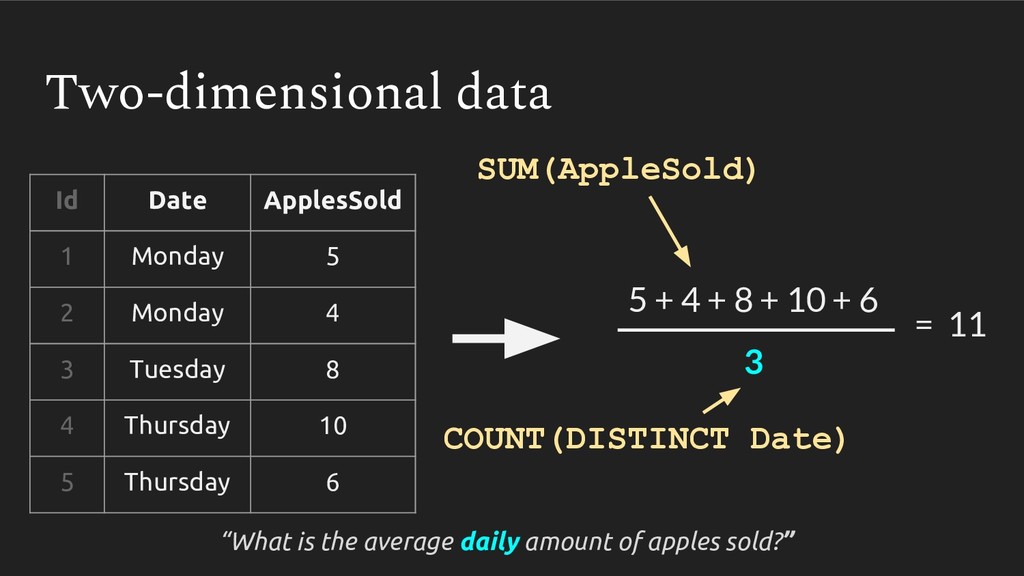
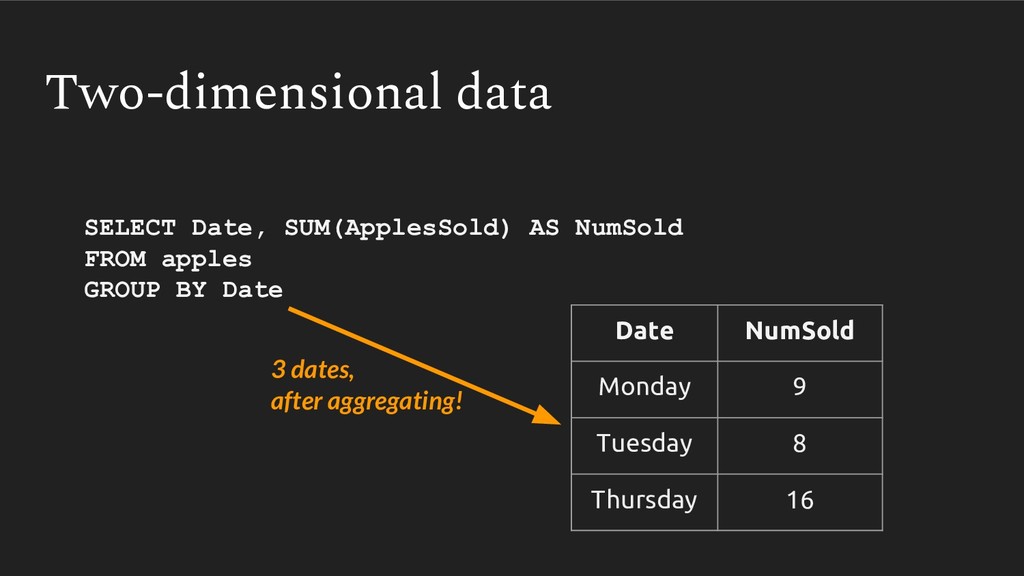
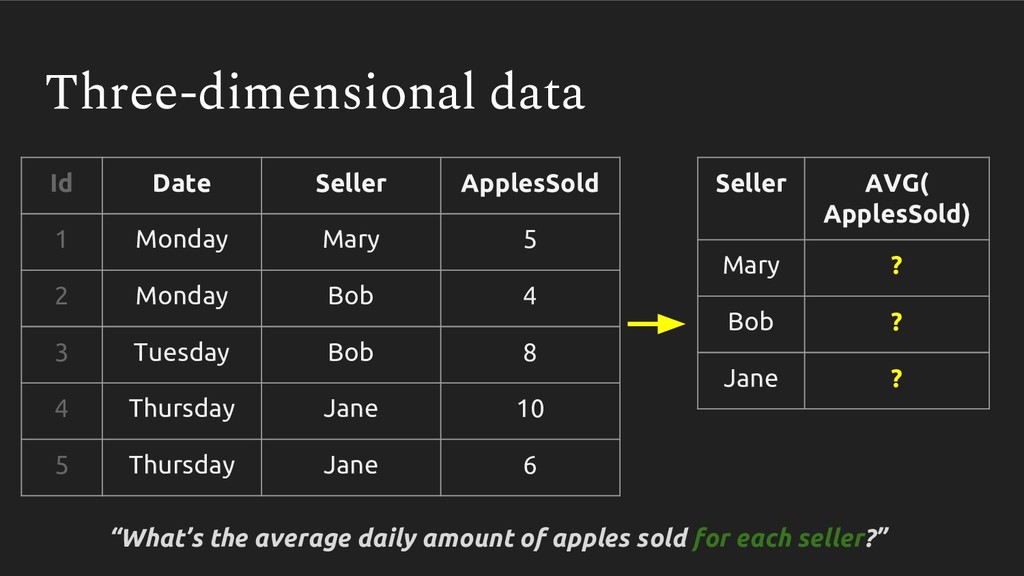
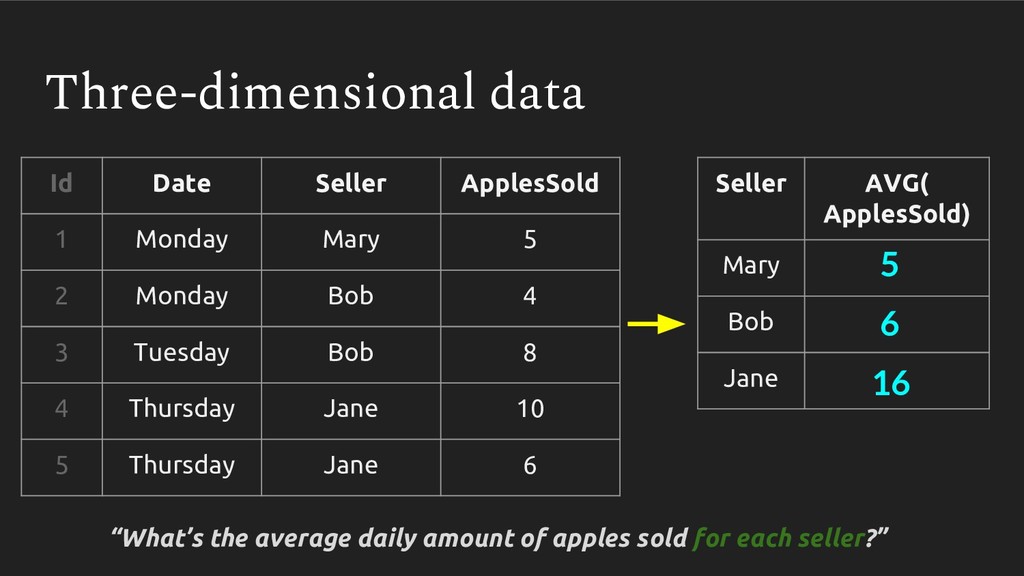
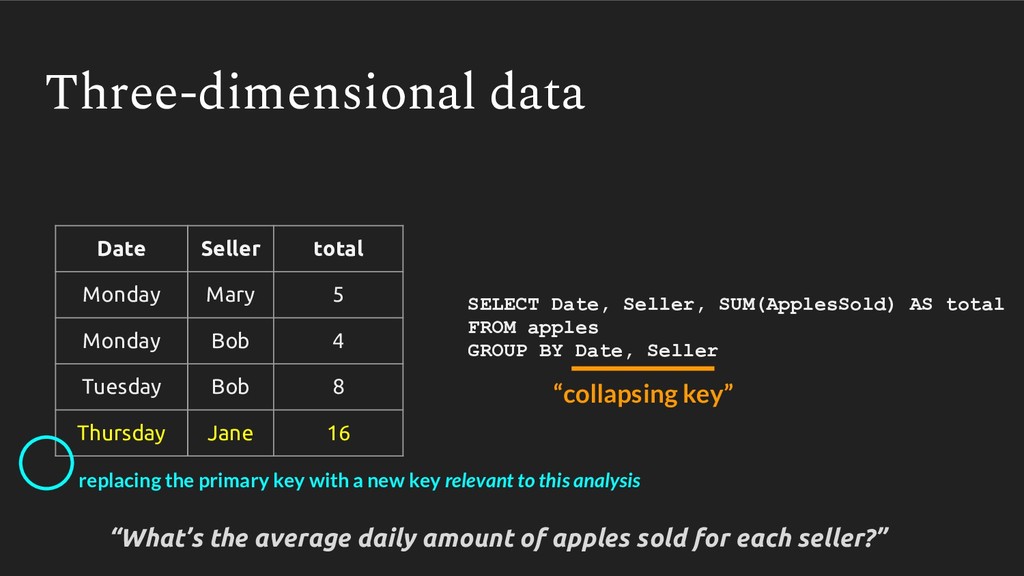
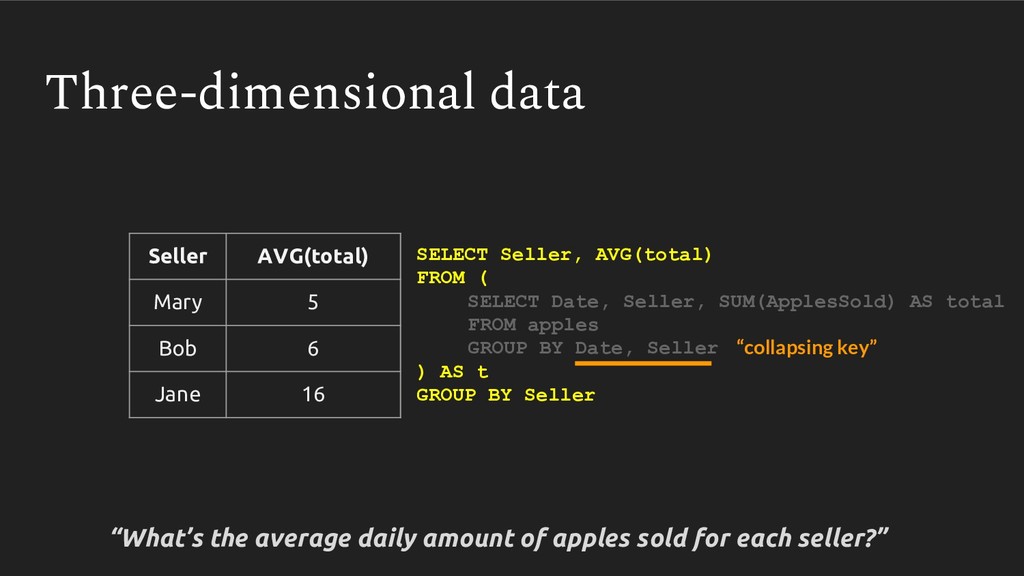
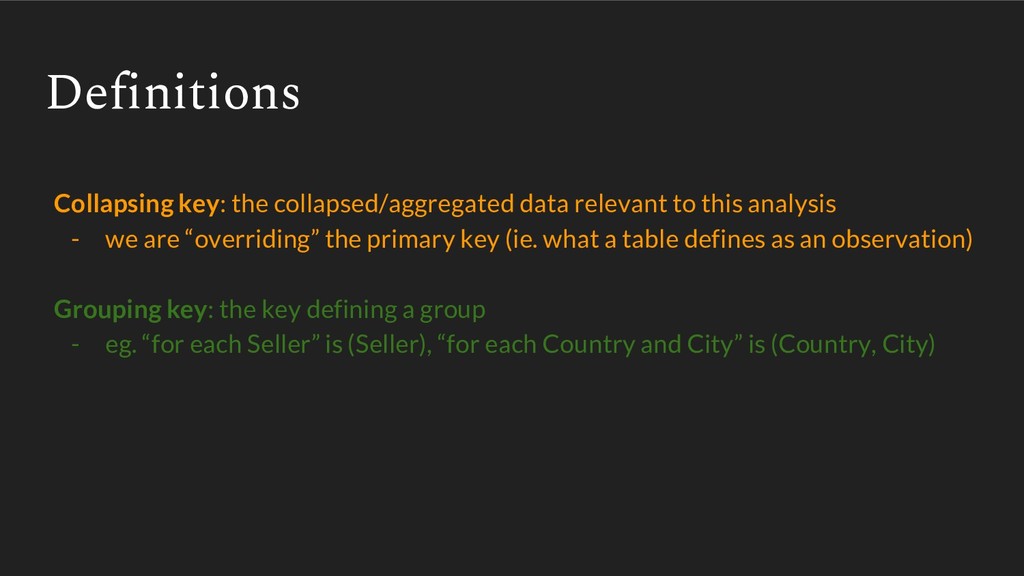
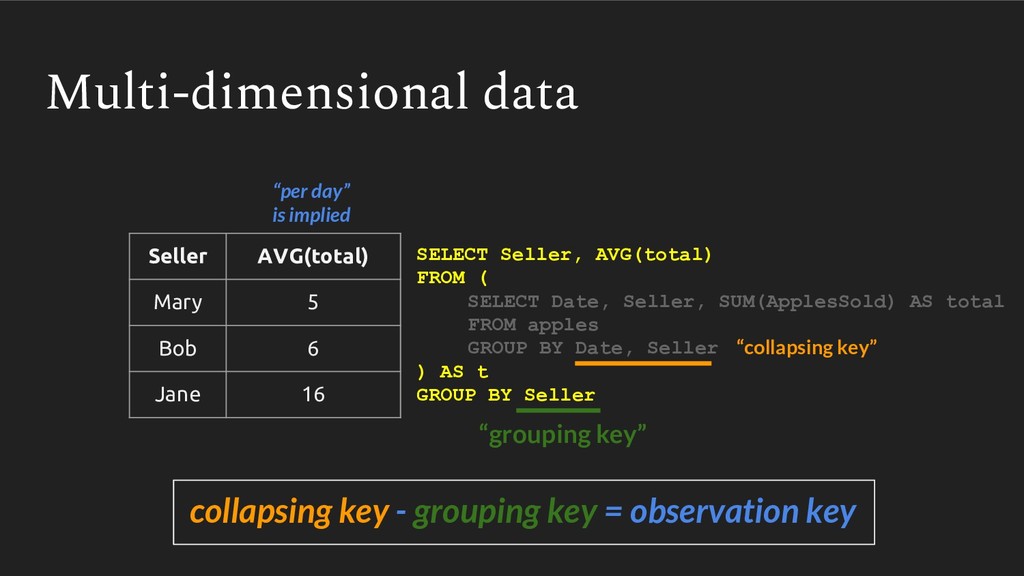
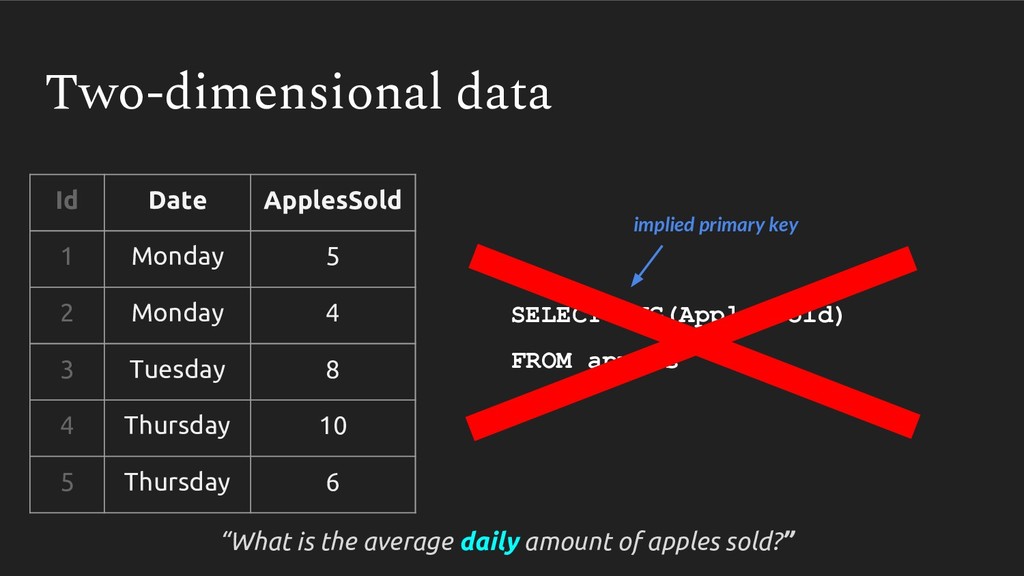
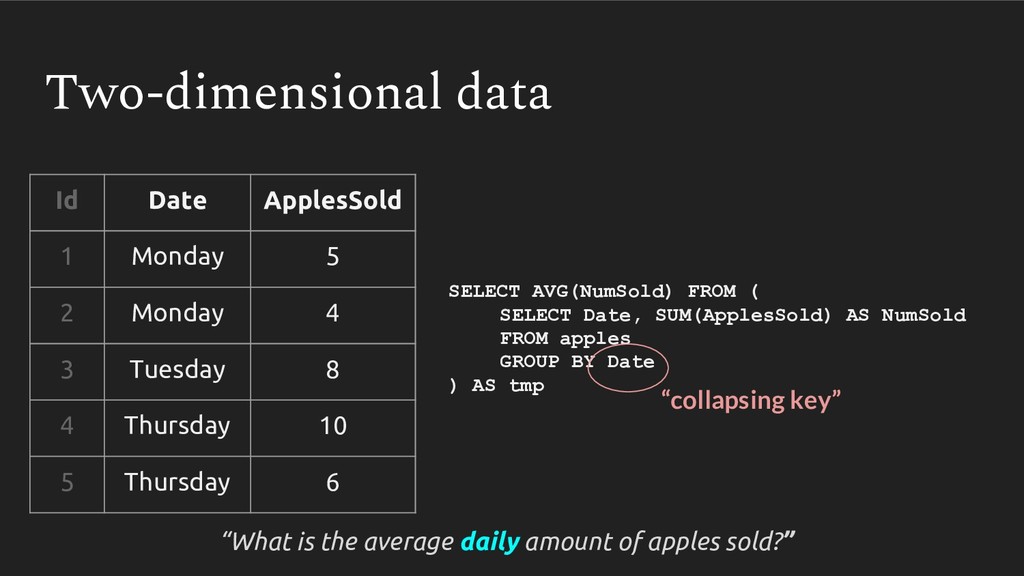
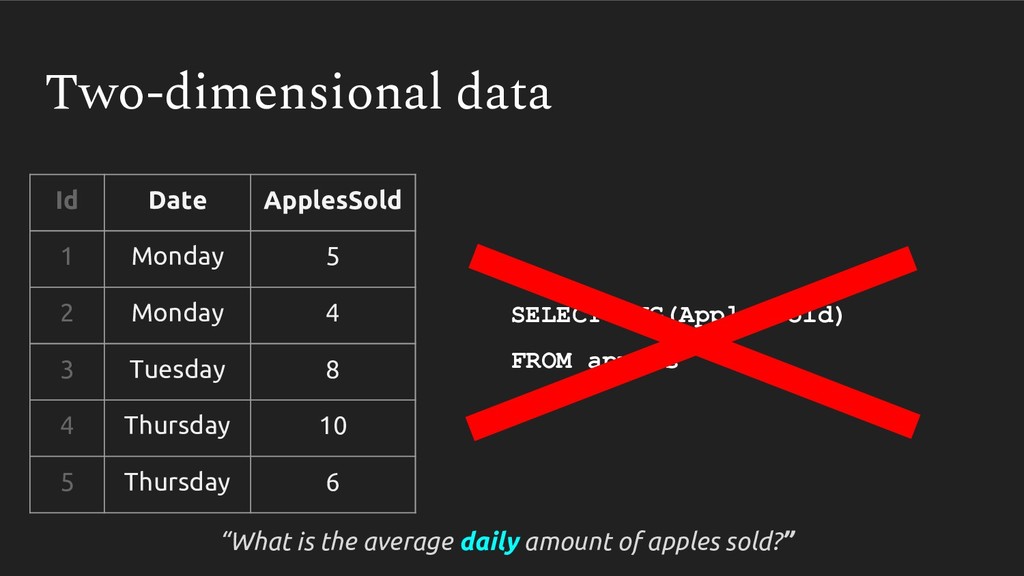
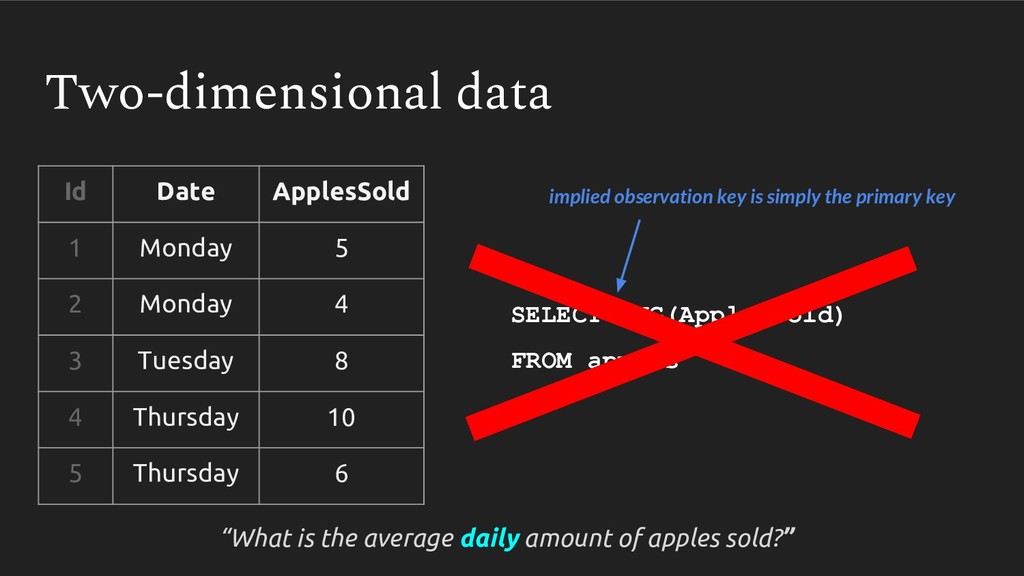
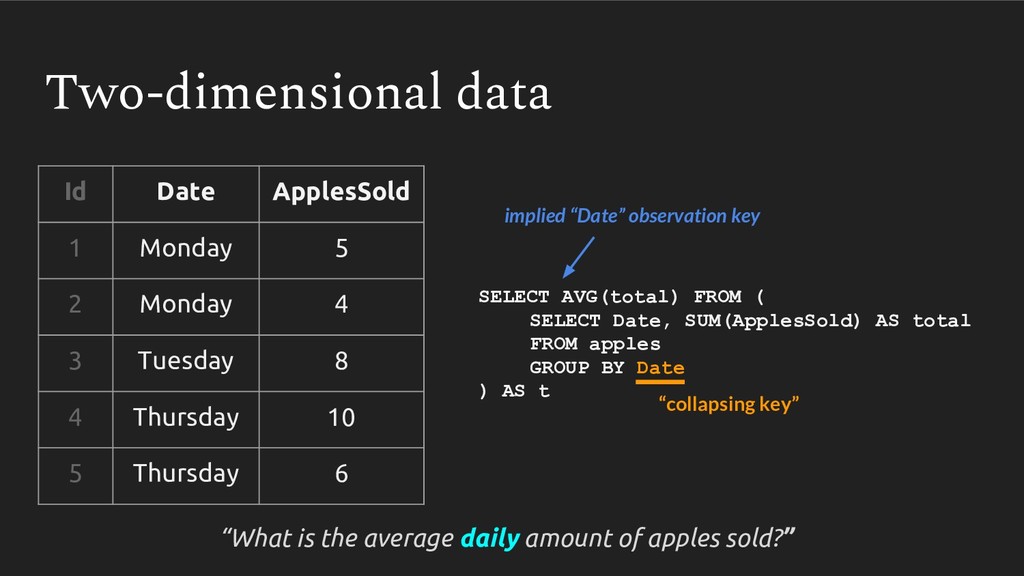
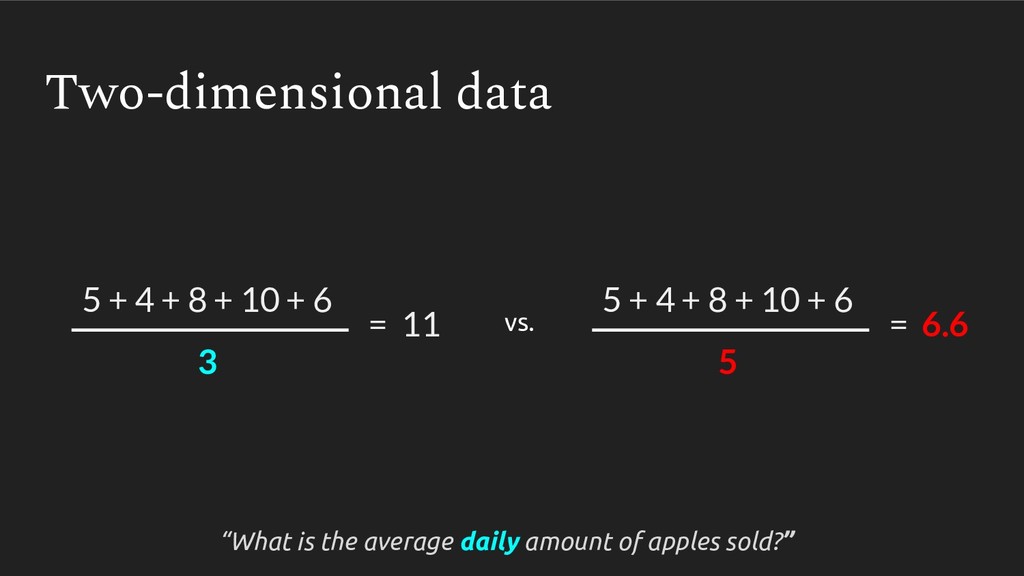
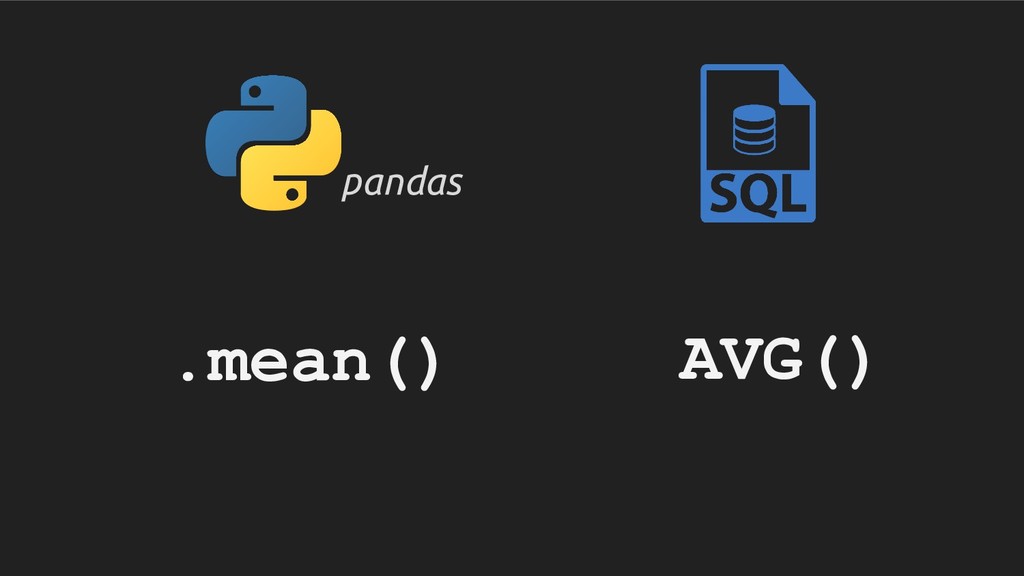
Averages are something we use everywhere - it’s a simple np.mean() in pandas or AVG() in SQL. But recently I’ve come to appreciate just how easy it is to calculate this statistic incorrectly. We learn once - in middle school no less - how to take an average, and never revisit it. Then, when we are faced with multidimensional datasets (ie. pretty much every dataset out there), we never reconsider whether we should be taking an average the same way.
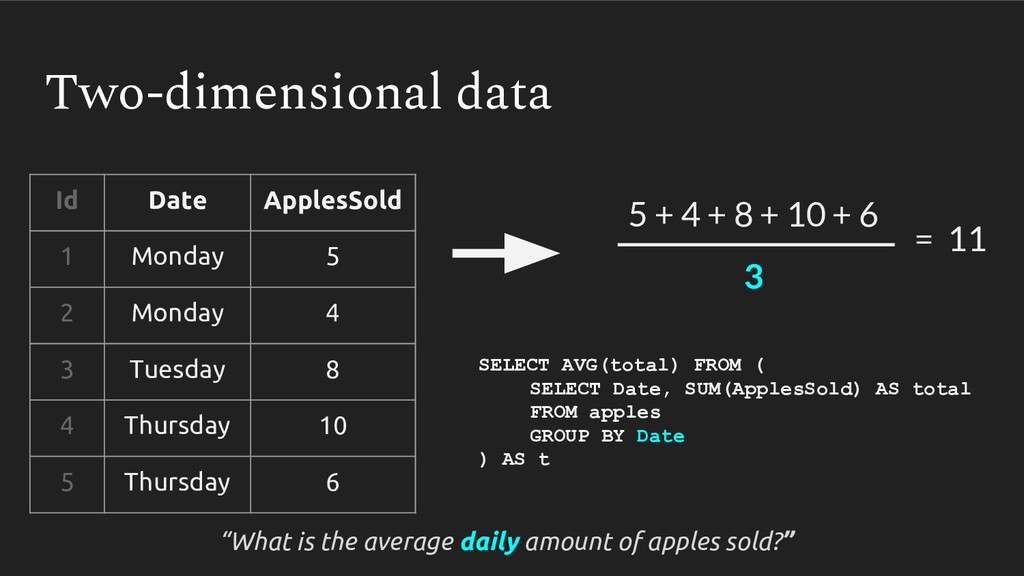
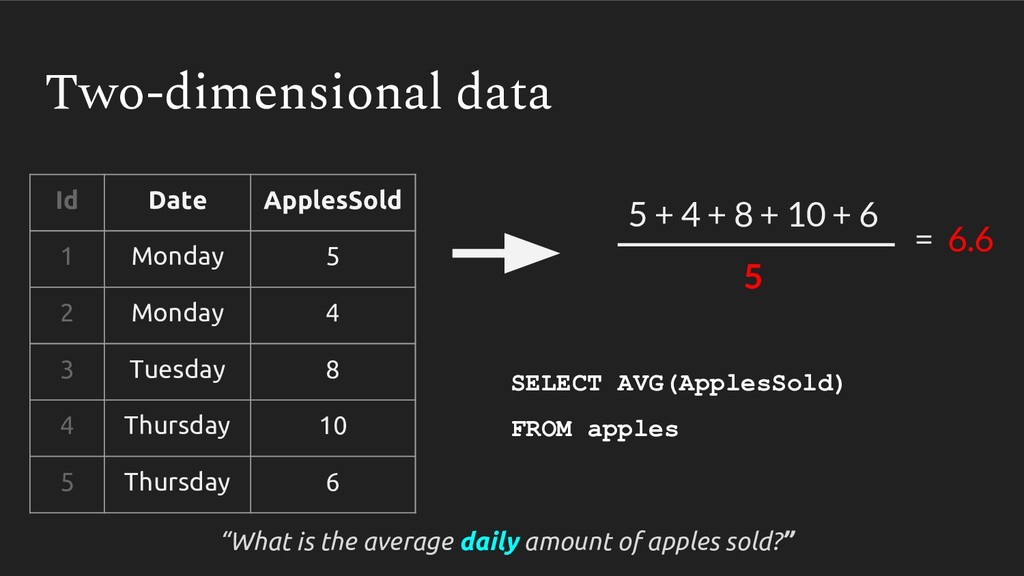
In this talk, we follow my arduous and humbling journey of learning how to properly take an average with multidimensional data. We will cover how improperly calculating it can produce grossly incorrect figures, which can slip into publications, research analyses and management reports.
https://us.pycon.org/2018/schedule/presentation/84/
![pandas vol = pd.read_sql_table(‘trades’, cnxn) vol = pd.to_datetime(vol[‘Date’]).set_index() vol2018 =](https://files.speakerdeck.com/presentations/d3494d87fb9f4983b26e7c5a9776c3b1/slide_6.jpg)
![pandas vol = pd.read_sql_table(‘trades’, cnxn) vol = pd.to_datetime(vol[‘Date’]).set_index() vol2018 =](https://files.speakerdeck.com/presentations/d3494d87fb9f4983b26e7c5a9776c3b1/slide_9.jpg)
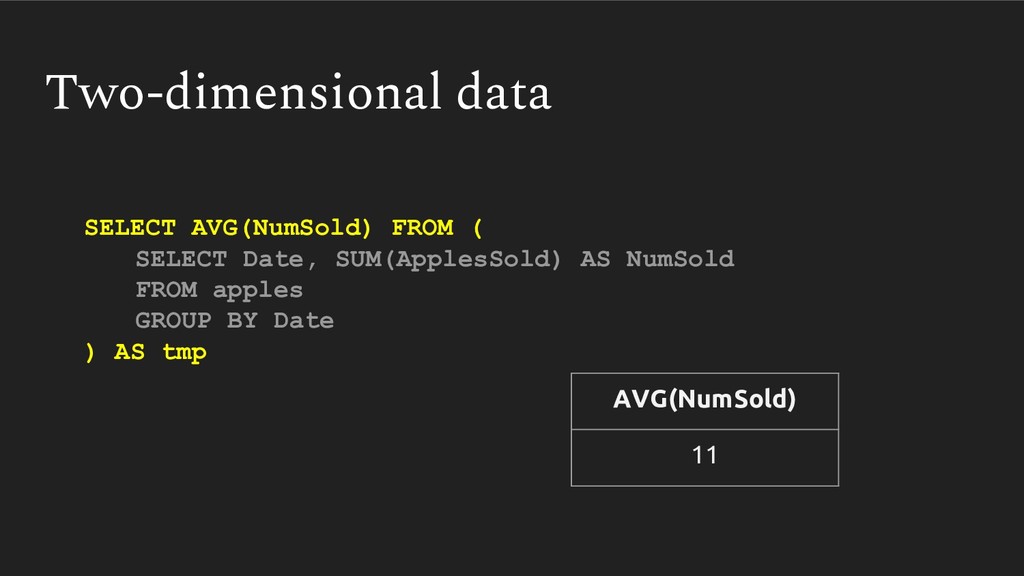
![mean = apple.groupby(‘Date’).sum() \ [‘ApplesSold’].mean() Two-dimensional data mean 11](https://files.speakerdeck.com/presentations/d3494d87fb9f4983b26e7c5a9776c3b1/slide_21.jpg)
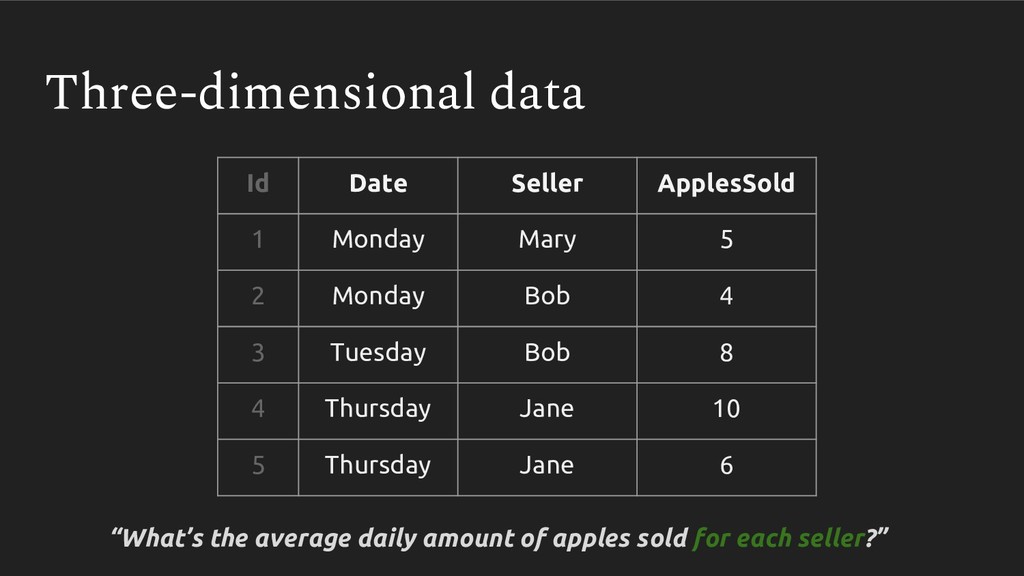
![pd.groupby([‘Date’, ‘Seller’]) \ [‘ApplesSold’].sum() \ .groupby(level=‘Seller’).mean() Multi-dimensional data (pandas) Seller](https://files.speakerdeck.com/presentations/d3494d87fb9f4983b26e7c5a9776c3b1/slide_42.jpg)