Upgrade to Pro — share decks privately, control downloads, hide ads and more …

Making sense of Cape Town using NLP by Gordon Inggs

Pycon ZA
October 11, 2019

Making sense of Cape Town using NLP by Gordon Inggs

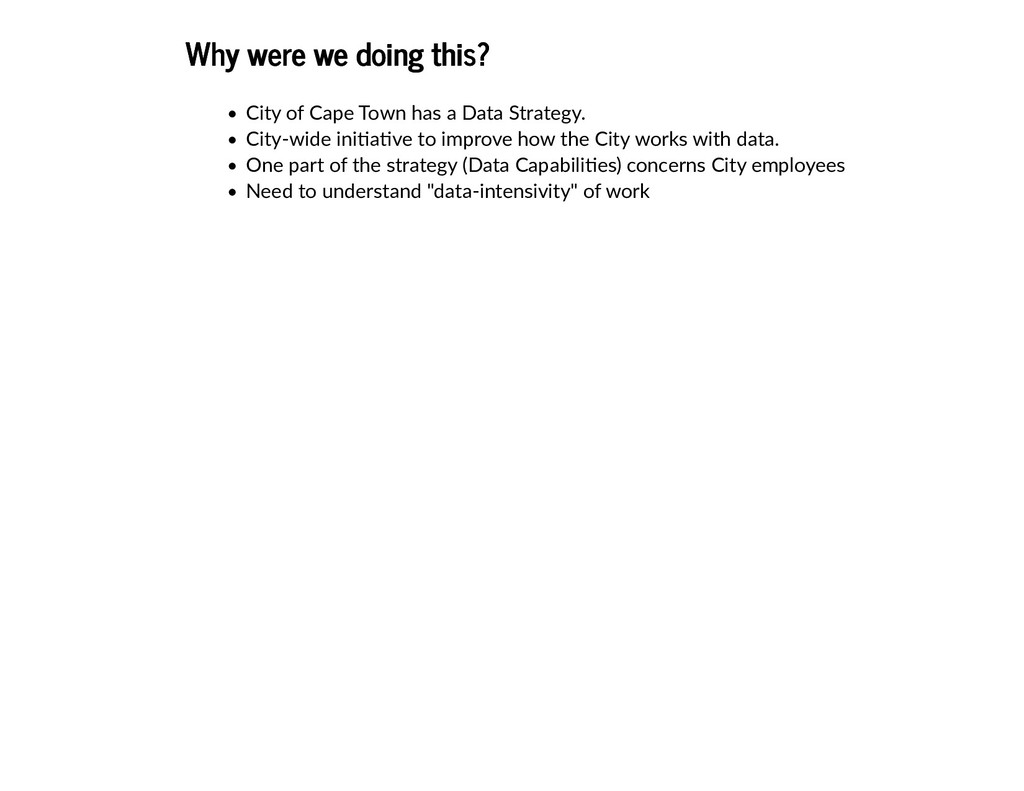
In this talk, I will describe how Natural Language Processing helped the City of Cape Town understand itself better. By doing so, I will hopefully illustrate how Machine Learning can be applied in the context of a large organisation, with pre-existing formal structures.

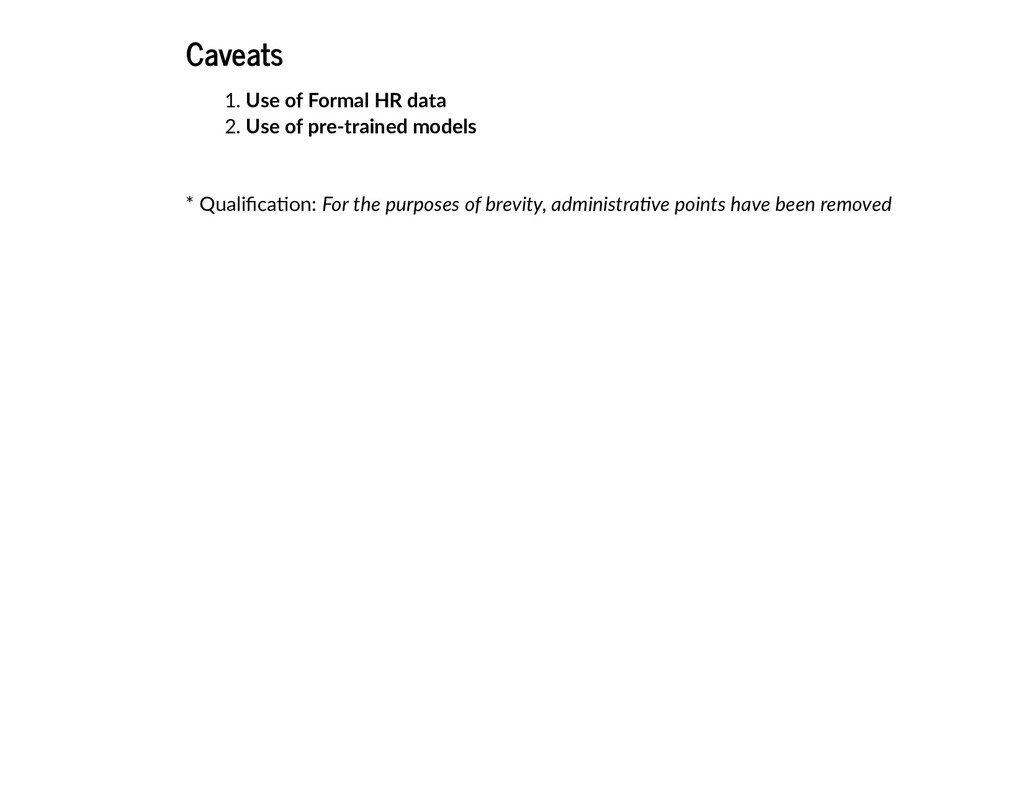
Several months ago, I was asked to help identify City employees who perform "data-intensive" work. After several fruitless keyword searches across the City's formal job description data, we turned to the excellent spaCy NLP library to help make sense of the data. And spaCy quickly yielded useful results: understanding of human resource gaps, audience segmentation for internal communication purpose, identification of potential beta testers for new tools, and more.

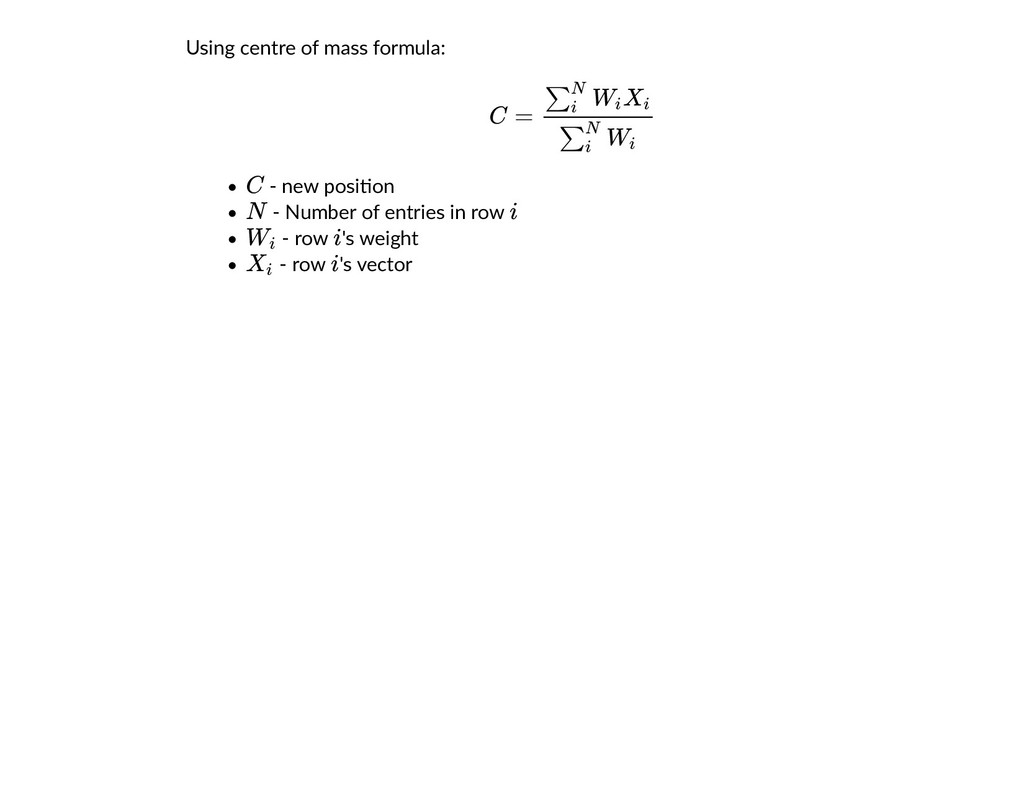
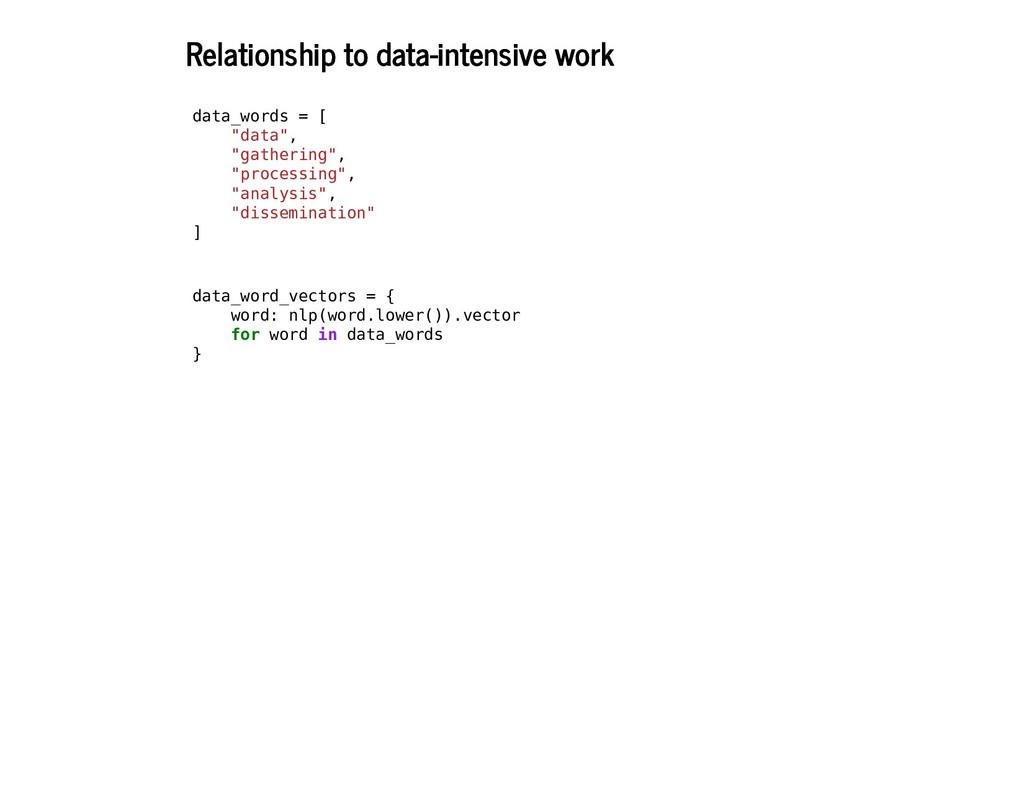
I will first describe how we embedded the semi-structured formal job descriptions into a vector space using spaCy's large English language model; secondly, how we then embedded phrases of interest, such as "data", into that same vector space. Once everything was in the same vector space, we used various distance measures to assess the "relevance" of the search phrases to the job description. It is these relevance measures that we used to understand the dynamics within the HR dataset.

This talk will appeal to anyone interested in how data science can find a place in a large public organisation. This talk also has practical value to anyone interested in doing a bit of NLP, but are unsure where to start.

Pycon ZA

October 11, 2019
Tweet

More Decks by Pycon ZA

Other Decks in Programming

Transcript

  1. Making sense of the City of Cape Town using NLP

    Making sense of the City of Cape Town using NLP Gordon Inggs, Data Scientist, City of Cape Town Gordon Inggs, Data Scientist, City of Cape Town
  2. Outline Outline Context 1. Transforming data into a form for

    analysis 2. Understanding the data 3.
  3. Why were we doing this? Why were we doing this?

    City of Cape Town has a Data Strategy. City-wide ini�a�ve to improve how the City works with data. One part of the strategy (Data Capabili�es) concerns City employees Need to understand "data-intensivity" of work
  4. Caveats Use of Formal HR data 1. Use of pre-trained

    models 2. * Qualifica�on: For the purposes of brevity, administra�ve points have been removed
  5. Out[3]: Directorate Department Posi�onName CriteriaGroup Row AppraisalScoreWeight CORPORATE SERVICES Organisa�onal

    Performance Management Principal Professional Officer: Data Sci Competencies CFPRO: Discipline Specific Skills L3 25 CORPORATE SERVICES Organisa�onal Performance Management Principal Professional Officer: Data Sci Competencies CFPRO: Impact and Influence L3 30 CORPORATE SERVICES Organisa�onal Performance Management Principal Professional Officer: Data Sci Competencies CFPRO: Organisa�onal Awareness L3 15 CORPORATE SERVICES Organisa�onal Performance Management Principal Professional Officer: Data Sci Competencies CFPRO: Planning and Organising L3 30 CORPORATE SERVICES Organisa�onal Performance Management Principal Professional Officer: Data Sci KPA's ANALYTIC DRIVEN CULTURE 20 CORPORATE SERVICES Organisa�onal Performance Management Principal Professional Officer: Data Sci KPA's DATA AUTOMATION 20 CORPORATE SERVICES Organisa�onal Performance Management Principal Professional Officer: Data Sci KPA's DATA INSIGHT 30 CORPORATE SERVICES Organisa�onal Performance Management Principal Professional Officer: Data Sci KPA's DATA REQUIREMENTS 30
  6. stop_words = { "service", "delivery", "function", "functions", "orientation", "orientations", "problem",

    "solving", "cfadm", "cfpro", "cfuni", "cfsup", "cfart", "cfman", "cfart", "cftec", "kpaa", "kpan", "l1", "l2", "l3", "l4", "l5" } nlp.Defaults.stop_words |= stop_words
  7. Embedding Embedding hr_df.RowVector = hr_df.Row.apply( lambda row: nlp(row).vector ) Takes

    2 mins using 16 cores. 4 chunks per core, at least 10k entries per core ≈
  8. Out[4]: Directorate Department Posi�onName CriteriaGroup Row RowVector AppraisalScoreWeight CORPORATE SERVICES

    Organisa�onal Performance Management Principal Professional Officer: Data Sci Competencies CFPRO: Discipline Specific Skills L3 [-0.115235664, 0.094851844, -0.032811504, -0.1... 25 CORPORATE SERVICES Organisa�onal Performance Management Principal Professional Officer: Data Sci Competencies CFPRO: Impact and Influence L3 [-0.185014, 0.27602965, -0.020265013, -0.01785... 30 CORPORATE SERVICES Organisa�onal Performance Management Principal Professional Officer: Data Sci Competencies CFPRO: Organisa�onal Awareness L3 [-0.0405184, 0.15518801, 0.110339, 0.008534556... 15 CORPORATE SERVICES Organisa�onal Performance Management Principal Professional Officer: Data Sci Competencies CFPRO: Planning and Organising L3 [-0.03400433, 0.02099867, 0.016796663, -0.0964... 30 CORPORATE SERVICES Organisa�onal Performance Management Principal Professional Officer: Data Sci KPA's ANALYTIC DRIVEN CULTURE [-0.01125025, 0.105551496, 0.2284475, -0.08509... 20 CORPORATE SERVICES Organisa�onal Performance Management Principal Professional Officer: Data Sci KPA's DATA AUTOMATION [-0.24759, 0.0056599975, 0.28850502, 0.09628, ... 20 CORPORATE SERVICES Organisa�onal Performance Management Principal Professional Officer: Data Sci KPA's DATA INSIGHT [-0.107594505, 0.18723, -0.019495003, 0.2254, ... 30 CORPORATE SERVICES Organisa�onal Performance Management Principal Professional Officer: Data Sci KPA's DATA REQUIREMENTS [0.006064996, -0.272295, -0.1181675, 0.003385,... 30
  9. Using centre of mass formula: - new posi�on - Number

    of entries in row - row 's weight - row 's vector C = ∑N i Wi Xi ∑N i Wi C N i Wi i Xi i
  10. Out[5]: Directorate Department Posi�onName CriteriaGroup CriteriaGroupVector CORPORATE SERVICES Organisa�onal Performance

    Management Principal Professional Officer: Data Sci Competencies [-0.10059217, 0.13609965, 0.00730747, -0.06769... CORPORATE SERVICES Organisa�onal Performance Management Principal Professional Officer: Data Sci KPA's [-0.0822269, -0.0032772017, 0.062091753, 0.070...
  11. Out[6]: Directorate Department Posi�onName Posi�onVector CORPORATE SERVICES Organisa�onal Performance Management

    Principal Professional Officer: Data Sci [-0.08773648, 0.038535856, 0.045656465, 0.0293...
  12. Relationship to data-intensive work Relationship to data-intensive work data_words =

    [ "data", "gathering", "processing", "analysis", "dissemination" ] data_word_vectors = { word: nlp(word.lower()).vector for word in data_words }
  13. for word, word_vector in data_word_vectors.items(): score_df[f"{word.title()}Score"] = sklearn.metrics.pairwise.cosine_similar ity( numpy.vstack(score_df.PositionVector.values),

    numpy.array([word_vector]) ) Faily fast - few seconds at most Out[9]: Directorate Department Posi�onName DataScore GatheringScore ProcessingScore AnalysisScore Dissemina�onScore 4869 CORPORATE SERVICES Organisa�onal Performance Management Principal Professional Officer: Data Sci 0.861595 0.411872 0.603572 0.698752 0.495789
  14. Key Findings Key Findings City job descrip�on data appears amenable

    to NLP analysis City posi�ons seem to have three groupings in rela�on to data key words: Intensive workers (the green band) Majority in the middle (the grey band) Low intensity/bad data (the red band) 'Processing' and 'Analysis' terminology is more prevelant than 'Gathering' and 'Dissemina�on'.
  15. Recommendations Recommendations Analysis is validated, qualita�vely 1. Use the 'green

    band' as beta testers for Data Strategy ini�a�ves 2. Data Strategy leaderships needs to reflect on absence of 'gathering' and 'processing' intensive posi�ons. 3. ? 4.
  16. Principal Component Analysis - tries to explain variance (difference in

    the dataset). Remaps data into new, reduced dimension form. Some�mes, these dimensions have meanings.