Upgrade to Pro — share decks privately, control downloads, hide ads and more …

PyConZA 2014: "Enabling Science with the Southern African Large Telescope with Python" by Steve Crawford

Pycon ZA
October 02, 2014

PyConZA 2014: "Enabling Science with the Southern African Large Telescope with Python" by Steve Crawford

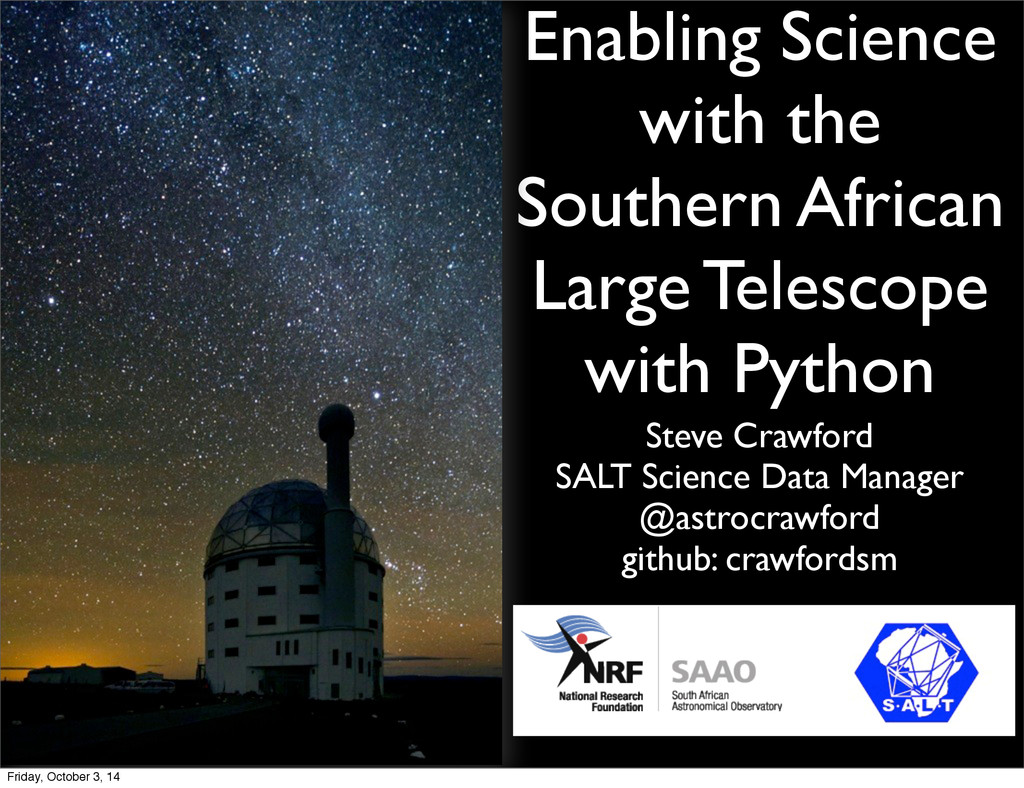
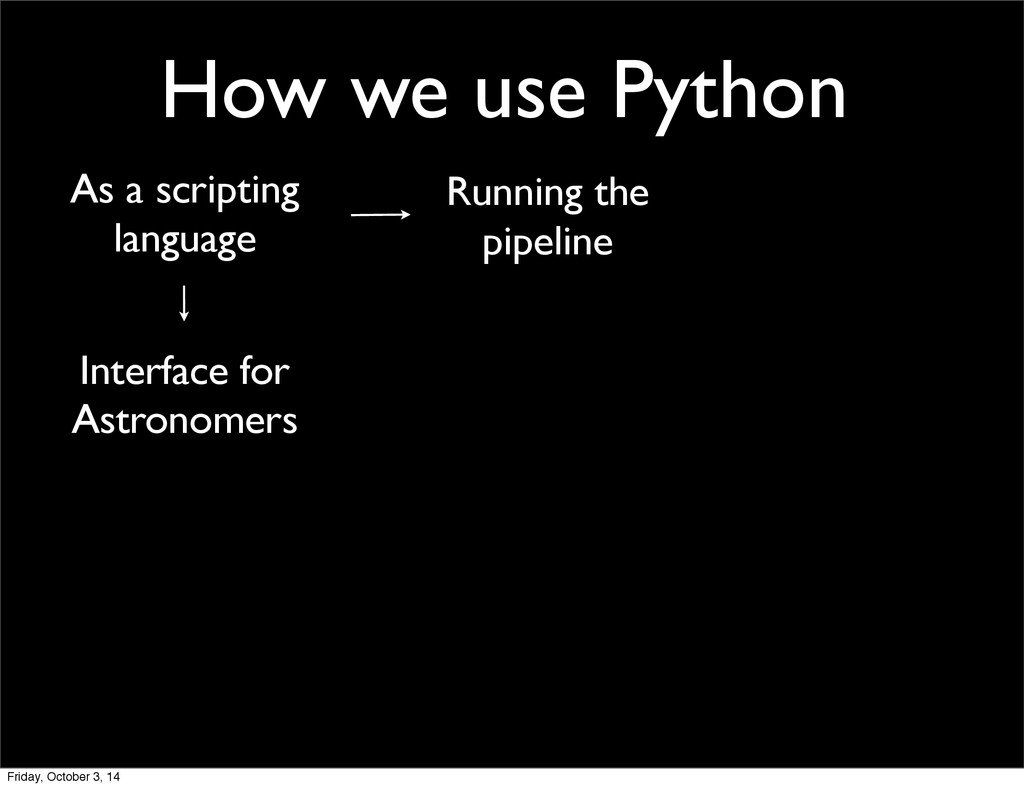
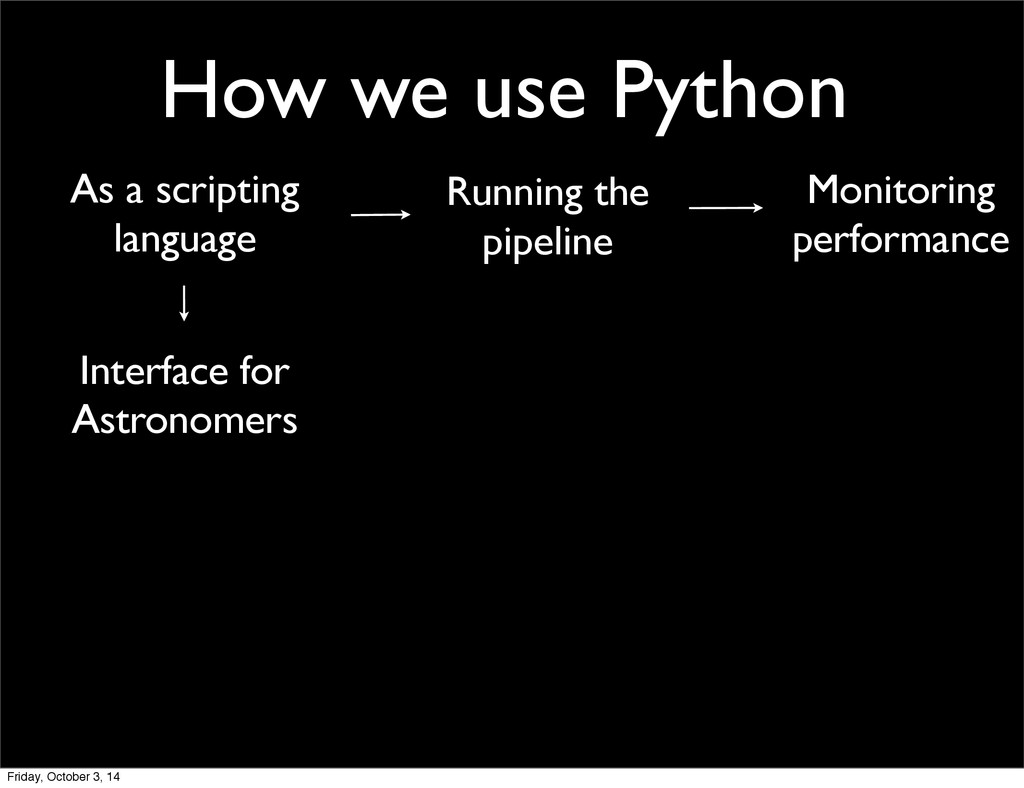
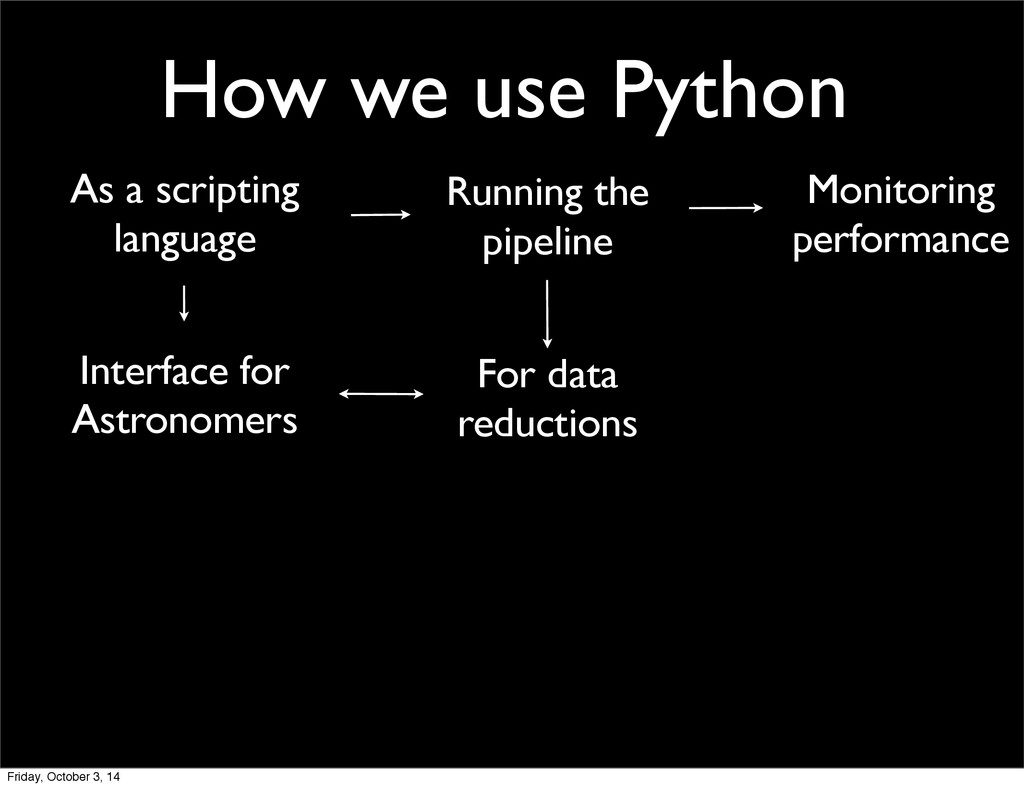
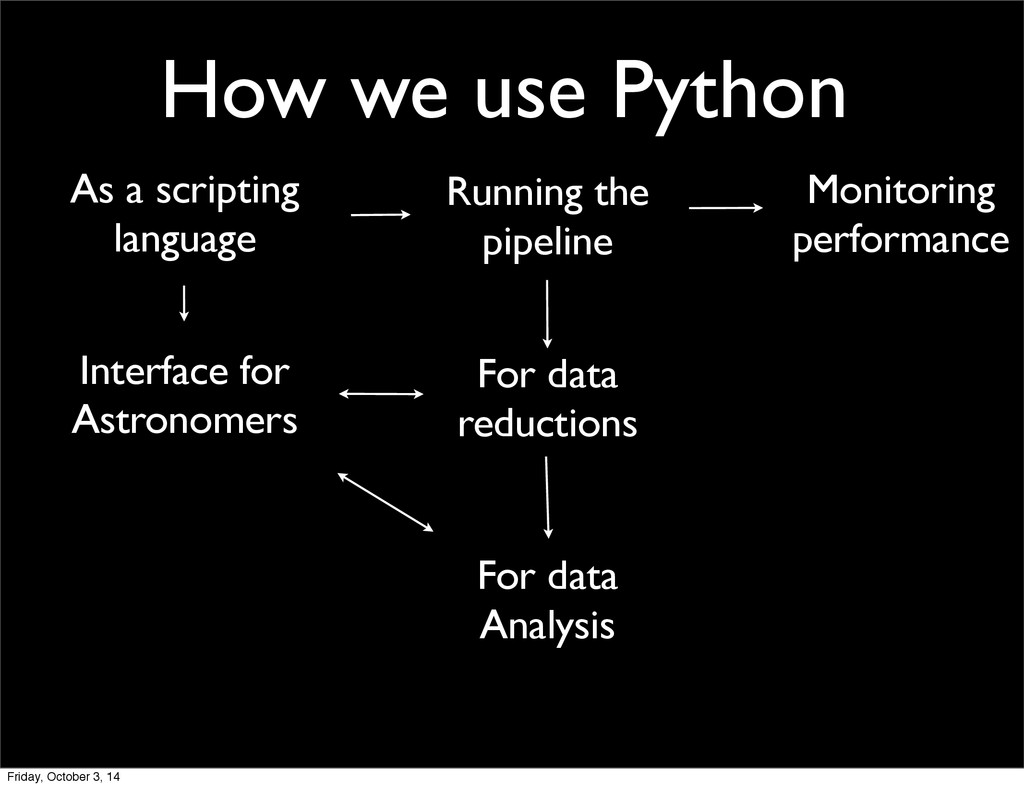
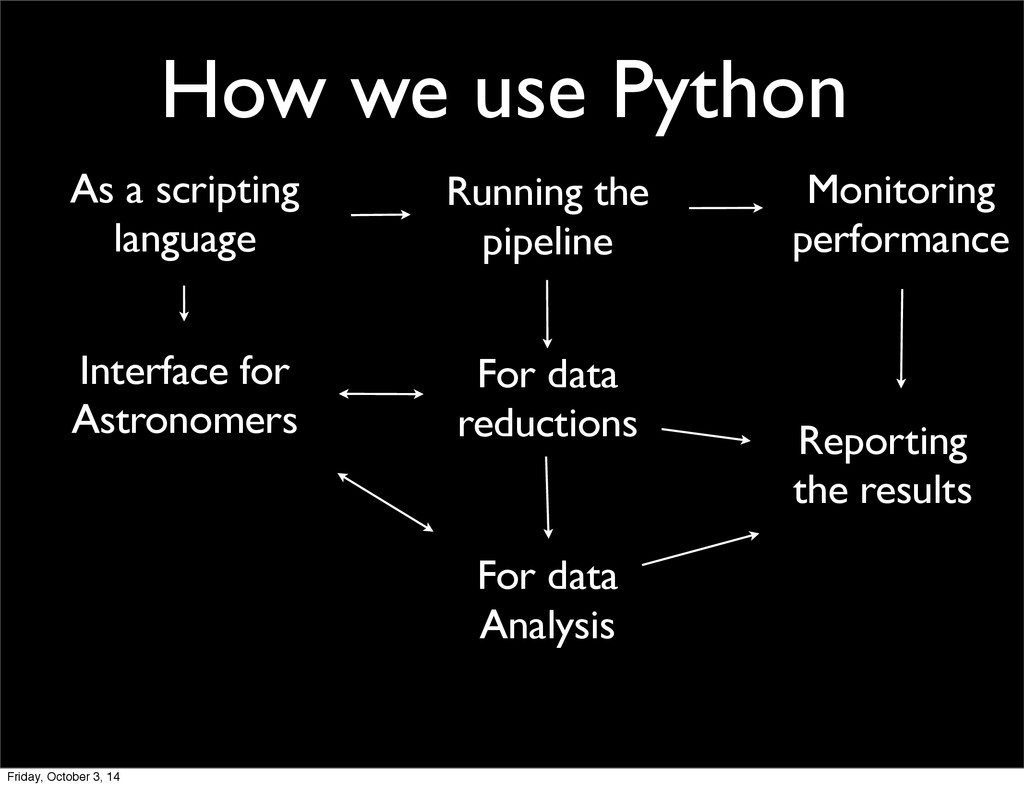
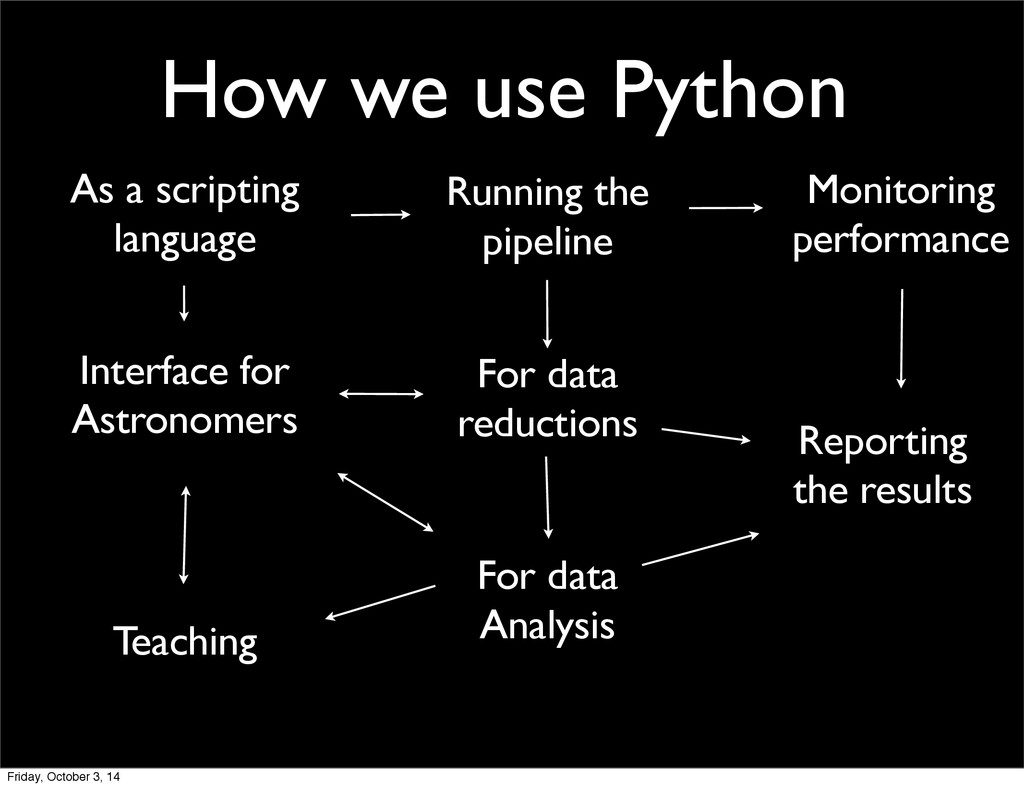
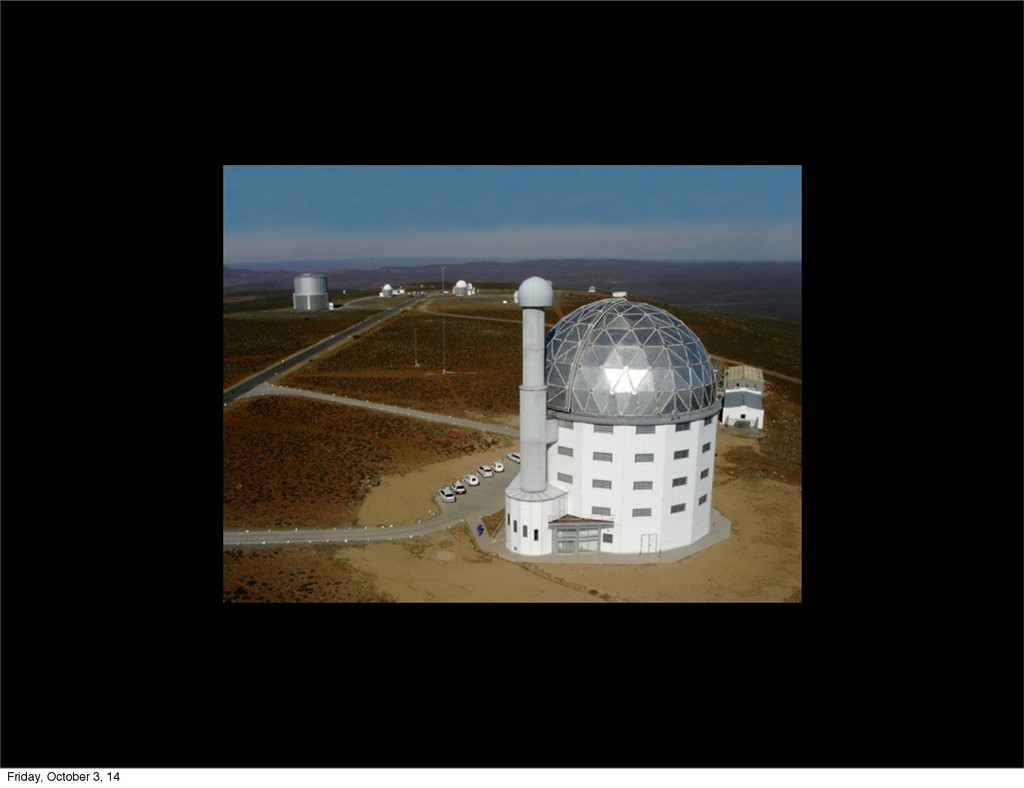
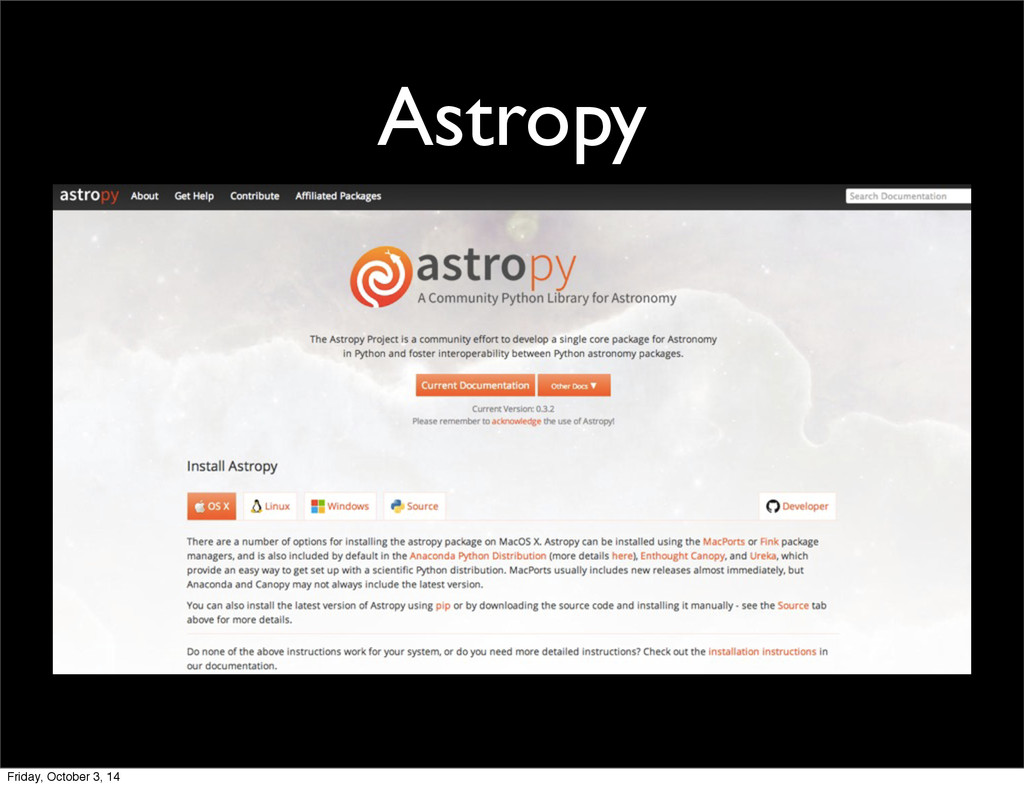
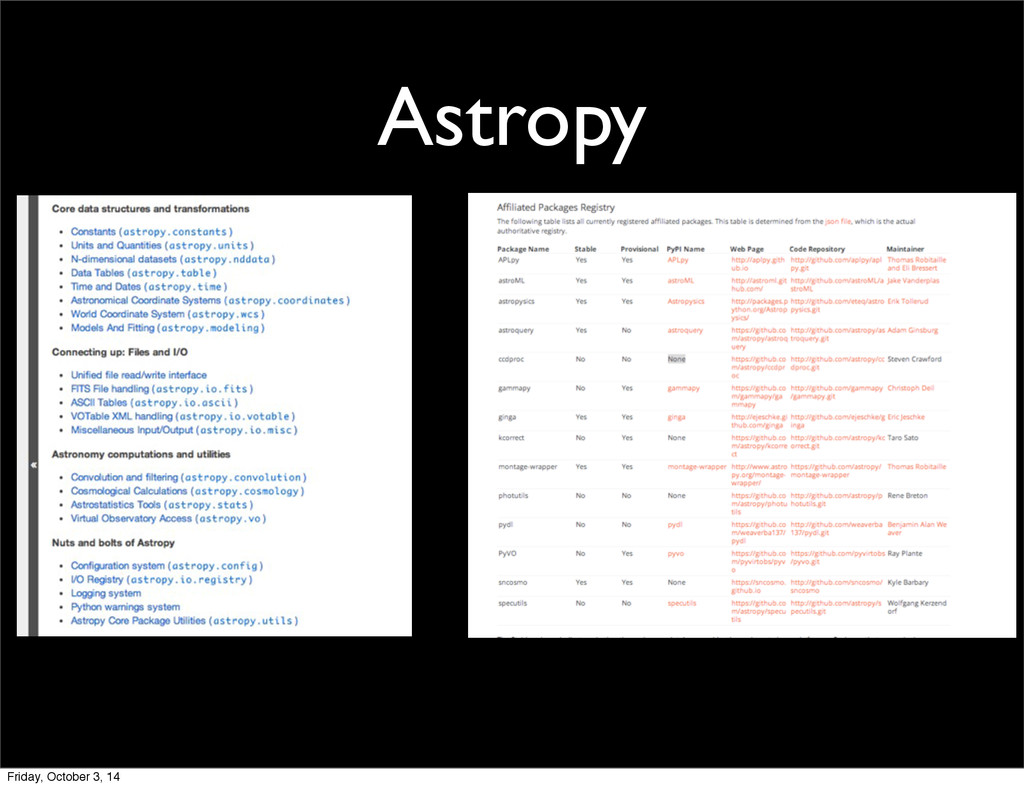
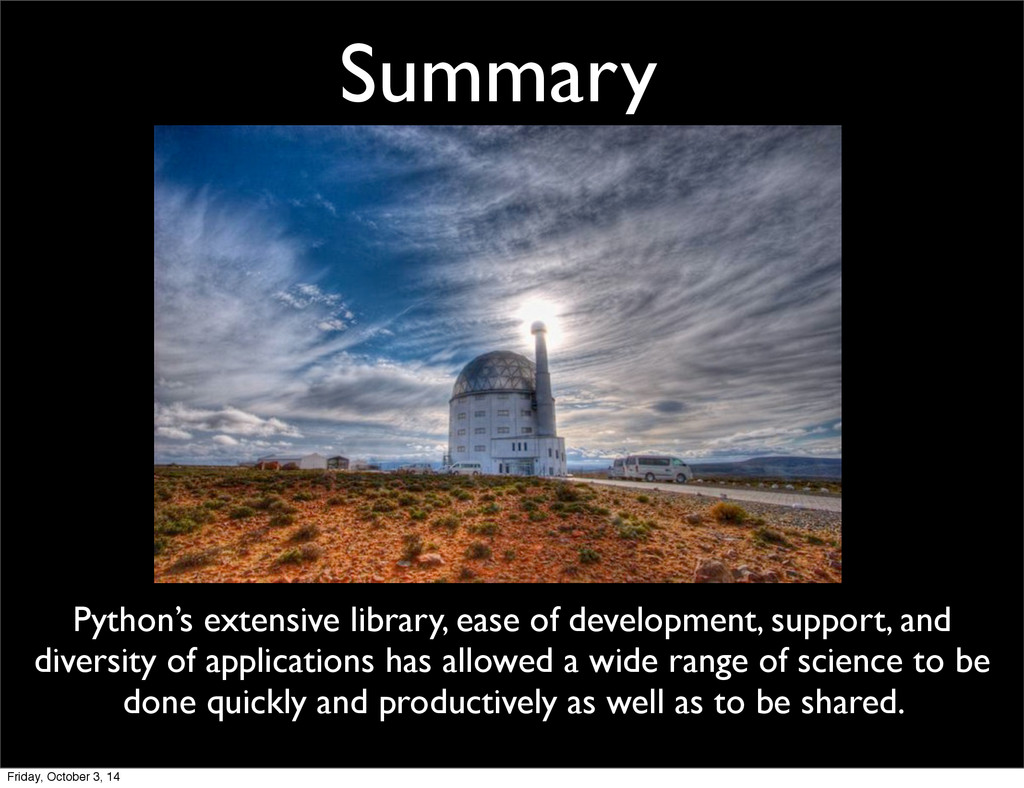
The Southern African Large Telescope is the premier optical astronomical facility in South Africa. Since the start of science operations in September 2011, it has produced a wide range of scientific results from studies of near-Earth asteroids to galaxies at the edge of the Universe. Once observations are obtained at the telescope, they are passed through our science pipeline, which is built on Python. The pipeline rapidly distributes the data, provides science quality reductions, and monitors the performance of the telescope. In addition, developments made for SALT have also contributed to astropy, a python library for astronomy.

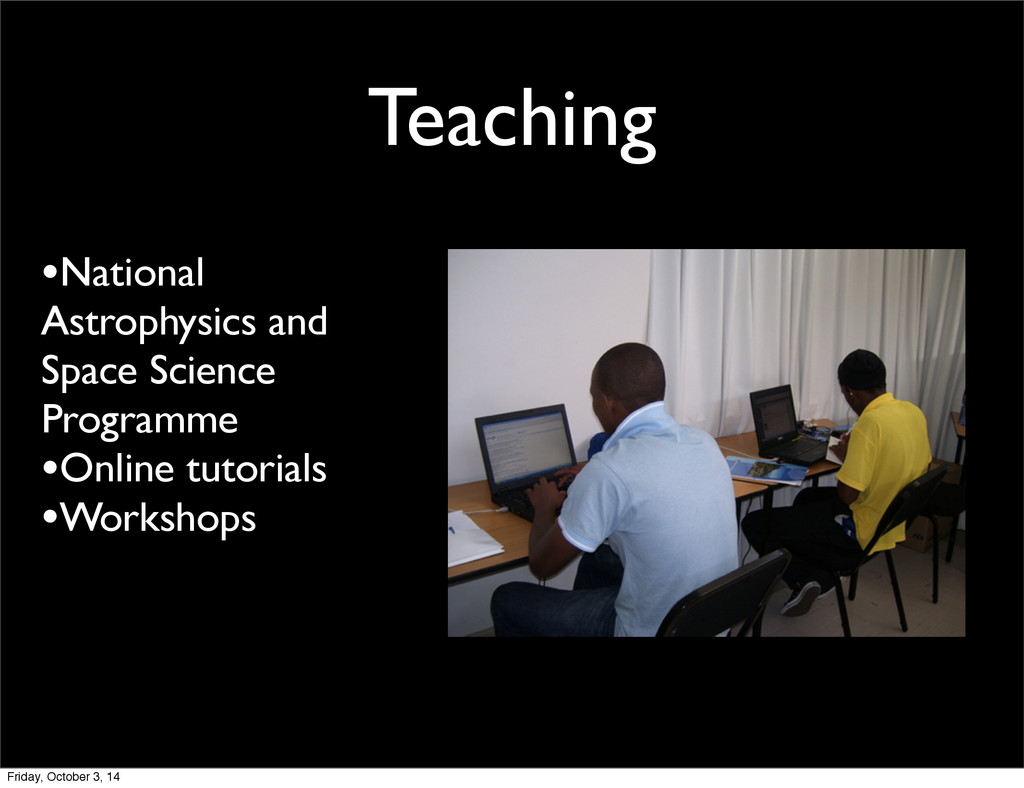
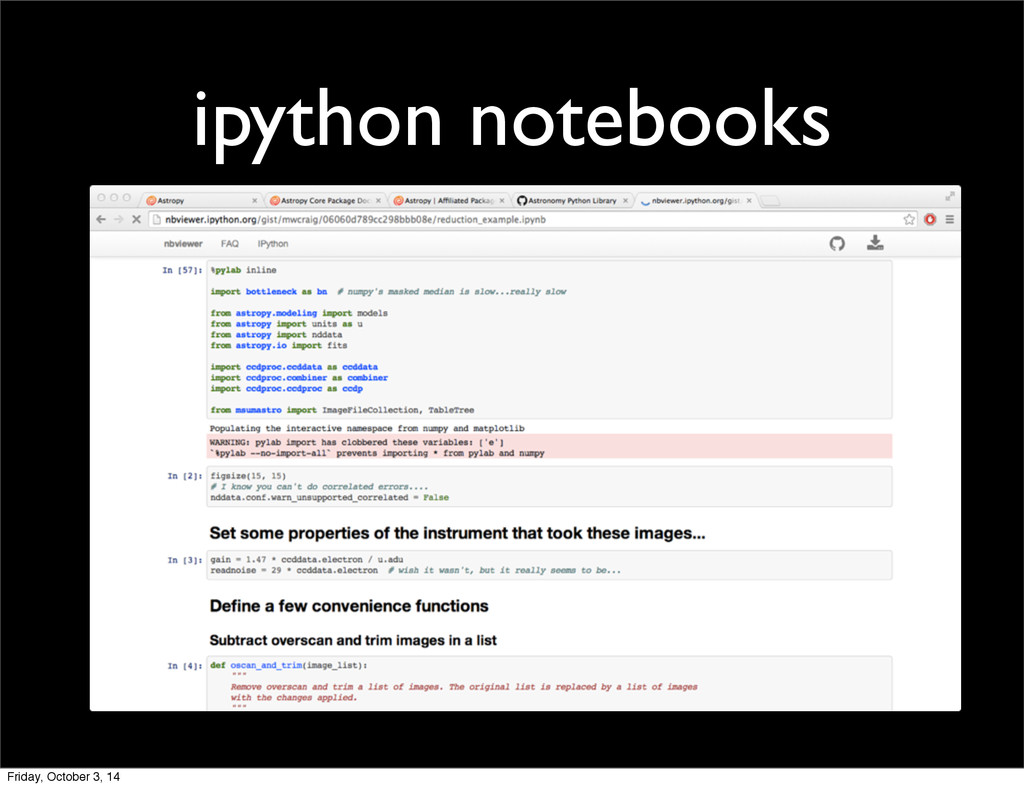
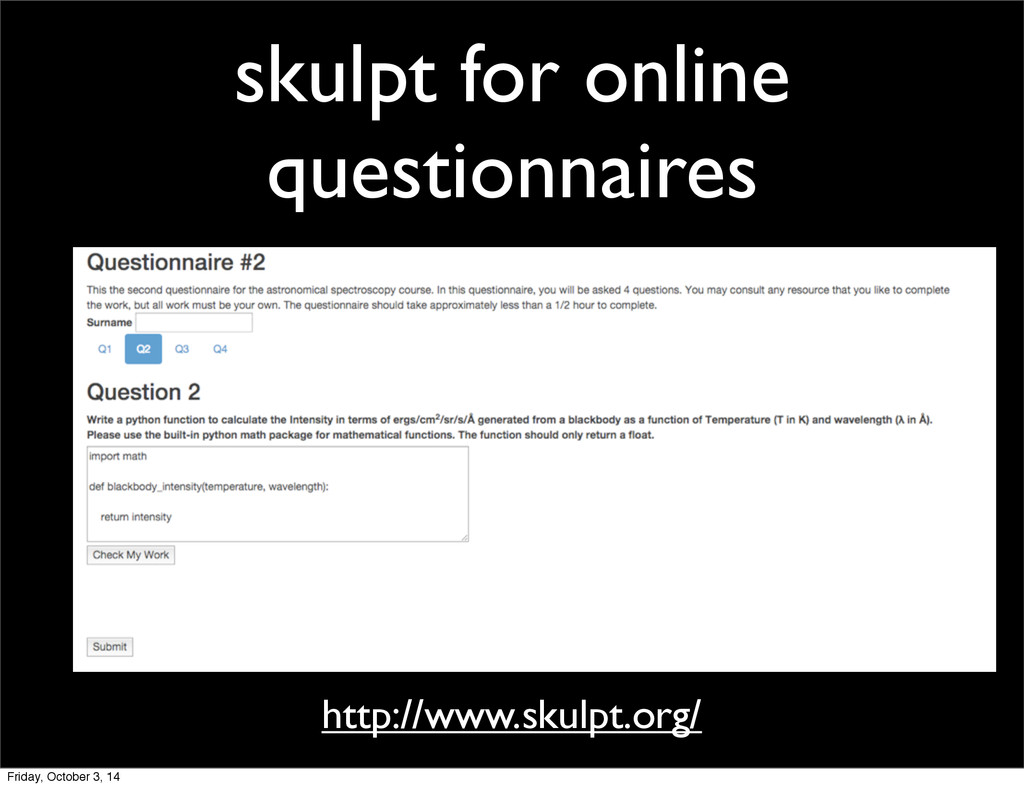
In this talk, we highlight how these developments are helping to contribute to our understanding of the Universe. We describe how we are using python to provide rapid reductions of the observations, for teaching new students, and for solving new problems.

Pycon ZA

October 02, 2014
Tweet

More Decks by Pycon ZA

Other Decks in Programming

Transcript

  1. Enabling Science with the Southern African Large Telescope with Python

    Steve Crawford SALT Science Data Manager @astrocrawford github: crawfordsm Friday, October 3, 14
  2. How we use Python As a scripting language Running the

    pipeline Interface for Astronomers Friday, October 3, 14
  3. How we use Python As a scripting language Running the

    pipeline Monitoring performance Interface for Astronomers Friday, October 3, 14
  4. How we use Python As a scripting language Running the

    pipeline For data reductions Monitoring performance Interface for Astronomers Friday, October 3, 14
  5. How we use Python As a scripting language Running the

    pipeline For data reductions Monitoring performance Interface for Astronomers For data Analysis Friday, October 3, 14
  6. How we use Python As a scripting language Running the

    pipeline For data reductions Monitoring performance Interface for Astronomers For data Analysis Reporting the results Friday, October 3, 14
  7. How we use Python As a scripting language Running the

    pipeline For data reductions Monitoring performance Interface for Astronomers For data Analysis Reporting the results Teaching Friday, October 3, 14
  8. How SALT Works Primary Mirror Array 11m in diameter 91

    1m segments ‘Light Bucket’ Friday, October 3, 14
  9. How SALT Works Primary Mirror Array 11m in diameter 91

    1m segments ‘Light Bucket’ Friday, October 3, 14
  10. How SALT Works Primary Mirror Array 11m in diameter 91

    1m segments ‘Light Bucket’ Fixed at 33o Friday, October 3, 14
  11. How SALT Works Primary Mirror Array 11m in diameter 91

    1m segments ‘Light Bucket’ Fixed at 33o Friday, October 3, 14
  12. How SALT Works Primary Mirror Array 11m in diameter 91

    1m segments ‘Light Bucket’ Fixed at 33o Friday, October 3, 14
  13. How SALT Works Primary Mirror Array 11m in diameter 91

    1m segments ‘Light Bucket’ Friday, October 3, 14
  14. How SALT Works Tracker -Follows the stars -holds the instruments

    Primary Mirror Array 11m in diameter 91 1m segments ‘Light Bucket’ Friday, October 3, 14
  15. Multi-mode imaging and acquisition camera. In full- frame mode, it

    has an 8x8’ FOV. In slotmode, high- speed photometry (20 Hz) can be performed over a smaller field of view. SALTICAM Tomek Kwiatkowski Friday, October 3, 14
  16. Spectroscopy • Measures flux vs wavelength • Spectral features corresponds

    to elements • Wavelength shift is proportional to velocity H He O 6100 6150 6200 6250 6300 6350 6400 6450 6500 6550 6600 6650 6700 Rectified Flux 0.7 0.8 0.9 1.0 1.1 Wavelength (C) 6100 6150 6200 6250 6300 6350 6400 6450 6500 6550 6600 6650 6700 Rectified Flux 0.7 0.8 0.9 1.0 1.1 4600 K, log(g) = 4.0 [M/H] = 0.0 4600K, log(g) = 4.5 [M/H] = 0.0 Ca I Fe I Ca I Ca I Fe I Figure 3: The SALT R = 10600 spectrum in comparison with two synthetic spectra with different gravities. Note that in the log(g) = 4.0 spectrum (top) the gravity-sensitive spectral lines (marked) are in better agreement with the observed spectrum. 10 Friday, October 3, 14
  17. Robert Stobie Spectrograph Highlights of RSS: • UV Spectroscopy down

    to 3200 Ǻ • High throughput and resolution VPH gratings • Fabry-Perot Modes • Polarimetry • High Speed Friday, October 3, 14
  18. Robert Stobie Spectrograph Highlights of RSS: • UV Spectroscopy down

    to 3200 Ǻ • High throughput and resolution VPH gratings • Fabry-Perot Modes • Polarimetry • High Speed Friday, October 3, 14
  19. On-Sky RealTime Results Data delivered in real time allowing follow-up

    observations at other observatories PyQt4 Friday, October 3, 14
  20. Super Nova Dan Milisavljevic (UT) −2400000 (days) (˚ A) (˚

    A) Instrument (s) 2011 Jul 29 55772.32 -14 3200 − 9000 6 SALT/RSS 2 × 300 2011 Aug 02 55776.33 -10 3200 − 9000 6 SALT/RSS 2 × 300 2011 Aug 06 55780.31 -6 3200 − 9000 6 SALT/RSS 2 × 600 2011 Aug 08 55782.30 -4 3400 − 8800 6 SALT/RSS 1 × 600 2011 Aug 09 55783.30 -3 5900 − 9000 6 SALT/RSS 1 × 600 2011 Aug 16 55789.54 3 3400 − 9000 6 SALT/RSS 2 × 600 2011 Aug 21 55794.62 8 3600 − 8900 13 SOAR/Goodman 3 × 450 2011 Aug 26 55799.50 13 3400 − 9000 6 SALT/RSS 1 × 600 2011 Aug 29 55803.48 17 3400 − 9000 6 SALT/RSS 1 × 600 2011 Sep 20 55824.43 38 3500 − 9500 4 Magellan/IMACS 1 × 900 2011 Sep 30 55834.63 48 3800 − 9400 6 Magellan/LDSS3 3 × 900 2011 Oct 18 55852.55 66 3700 − 9200 18 NTT/EFOSC2 2 × 1800 2011 Oct 24 55859.34 73 3400 − 8800 6 SALT/RSS 1 × 600 2011 Nov 16 55881.55 95 3800 − 8900 13 SOAR/Goodman 2 × 2700 2011 Nov 18 55883.55 97 3500 − 9500 4 Magellan/IMACS 1 × 1200 2012 Jun 18 56096.33 310 3500 − 9600 14 VLT/FORS2 2 × 1800 a Phase is with respect to V -band maximum on JD 2455786.5 (2011 Aug 13.0). b FWHM of night sky emission lines. 4000 5000 6000 7000 8000 9000 -14 d -10 d -6 d -4 d -3 d 3 d 13 d 17 d Rest Wavelength [Å] 38 d 73 d 97 d ⨁ Fλ + constant 8 d 48 d 66 d 95 d 310 d Figure 2. Optical spectra of SN 2011ei. Phase is with respect to V -band maximum. Telluric features have been marked with symbol. Friday, October 3, 14
  21. 12 Pipeline Process Prepare Data Clean Images Create documentation FTP

    Archive The pipeline is designed to handle the daily reduction, archiving, and distribution of the data. Each day at 10:30 am, the pipeline automatically begins processing the data from the previous night. Typically within an hour, astronomers around the world are notified that their observations are available. Alert Data Quality Record the data Standard python libraries plus MySqldb Friday, October 3, 14
  22. Performance Weather Conditions, Observing Performance, Time lost to problems, data

    monitoring, data quality. Uses matplotlib, MySQLdb but starting to look at migrating to Flask Friday, October 3, 14
  23. 14 PySALT PySALT is the Python/PyRaf software package for SALT

    data reduction and analysis. Built around numpy, scipy, matplotlib, and astropy, the PySALT package includes: http://www.pysalt.salt.ac.za/ Friday, October 3, 14
  24. 14 PySALT PySALT is the Python/PyRaf software package for SALT

    data reduction and analysis. Built around numpy, scipy, matplotlib, and astropy, the PySALT package includes: SALTRED Basic CCD data Reductions http://www.pysalt.salt.ac.za/ Friday, October 3, 14
  25. 14 PySALT PySALT is the Python/PyRaf software package for SALT

    data reduction and analysis. Built around numpy, scipy, matplotlib, and astropy, the PySALT package includes: SALTRED Basic CCD data Reductions SPECTOOLS Tools to provide spectroscopic data reductions http://www.pysalt.salt.ac.za/ Friday, October 3, 14
  26. 14 PySALT HRSTOOLS Tasks for reducing high resolution spectroscopy PySALT

    is the Python/PyRaf software package for SALT data reduction and analysis. Built around numpy, scipy, matplotlib, and astropy, the PySALT package includes: SALTRED Basic CCD data Reductions SPECTOOLS Tools to provide spectroscopic data reductions http://www.pysalt.salt.ac.za/ Friday, October 3, 14
  27. 14 PySALT HRSTOOLS Tasks for reducing high resolution spectroscopy PySALT

    is the Python/PyRaf software package for SALT data reduction and analysis. Built around numpy, scipy, matplotlib, and astropy, the PySALT package includes: SALTRED Basic CCD data Reductions SPECTOOLS Tools to provide spectroscopic data reductions FPTOOLS Fabry-Perot related software http://www.pysalt.salt.ac.za/ Friday, October 3, 14
  28. 14 PySALT HRSTOOLS Tasks for reducing high resolution spectroscopy PySALT

    is the Python/PyRaf software package for SALT data reduction and analysis. Built around numpy, scipy, matplotlib, and astropy, the PySALT package includes: SALTRED Basic CCD data Reductions SLOTTOOLS Tools for the analysis of high speed observations SPECTOOLS Tools to provide spectroscopic data reductions FPTOOLS Fabry-Perot related software http://www.pysalt.salt.ac.za/ Friday, October 3, 14
  29. Summary Python’s extensive library, ease of development, support, and diversity

    of applications has allowed a wide range of science to be done quickly and productively as well as to be shared. Friday, October 3, 14
  30. Acknowledgements Garith Dugmore, Paul Kotze, Encarni Romero Colmenero, and SALT

    Astronomy Operations Matthew Craig Staff of South African Astronomical Observatory National Research Foundation SALT Foundation Astropy Collaboration Video: Bruno Letarte Friday, October 3, 14