Upgrade to Pro — share decks privately, control downloads, hide ads and more …

Using Python to visualize and analyze ion beam experiment data at a particle accelerator facility by Caswell Pieters

Pycon ZA
October 11, 2019

Using Python to visualize and analyze ion beam experiment data at a particle accelerator facility by Caswell Pieters

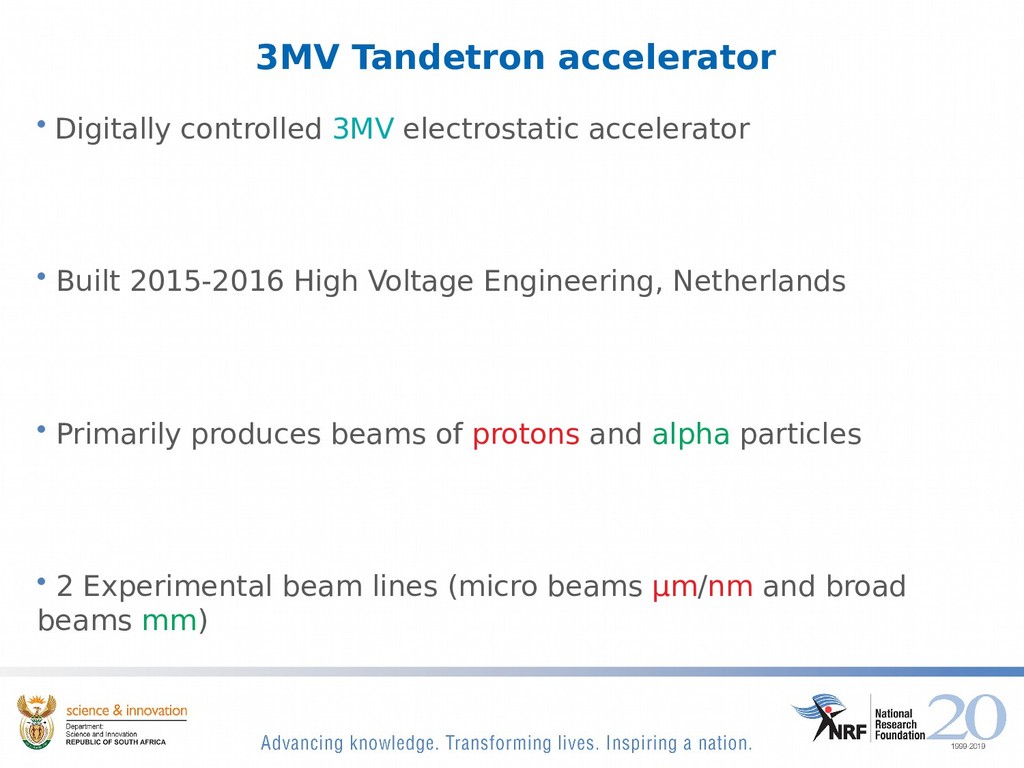
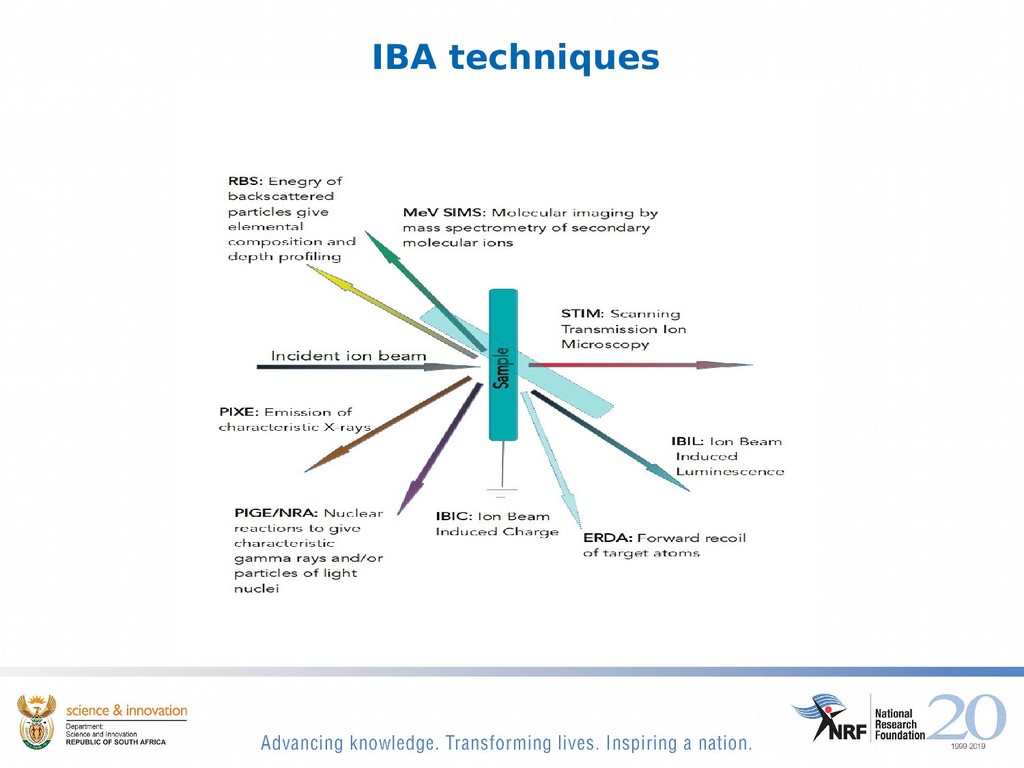
The electrostatic Tandetron accelerator of the Materials Research Department at iThemba LABS is used primarily for conducting research in the field of Ion Beam Analysis.

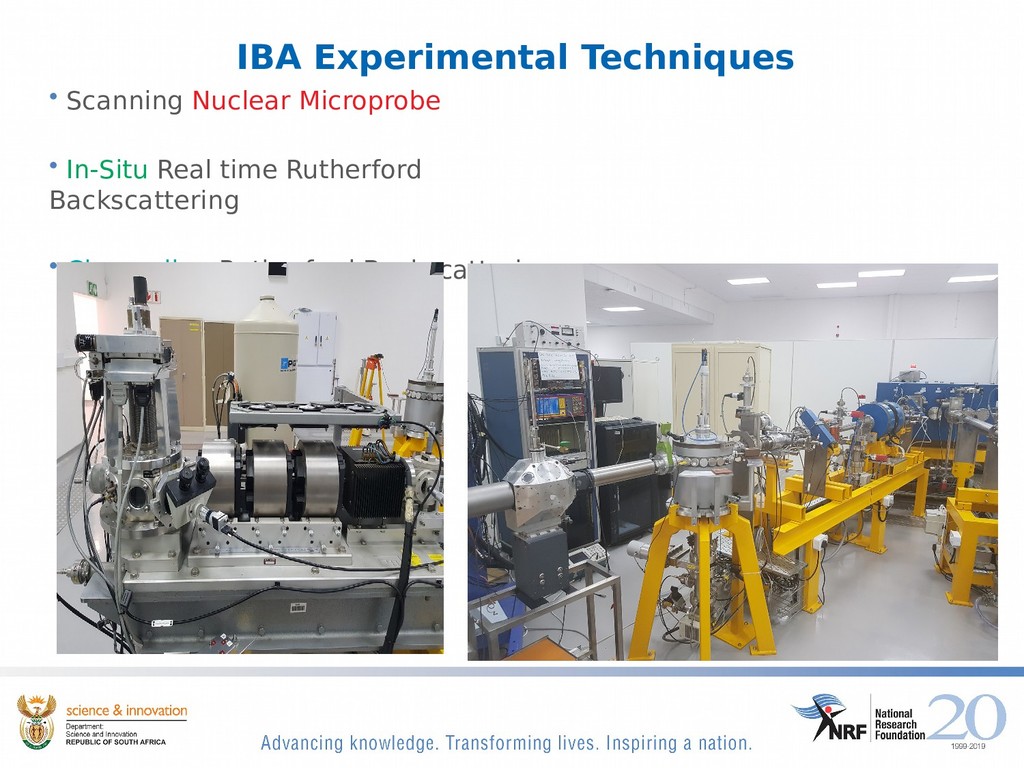
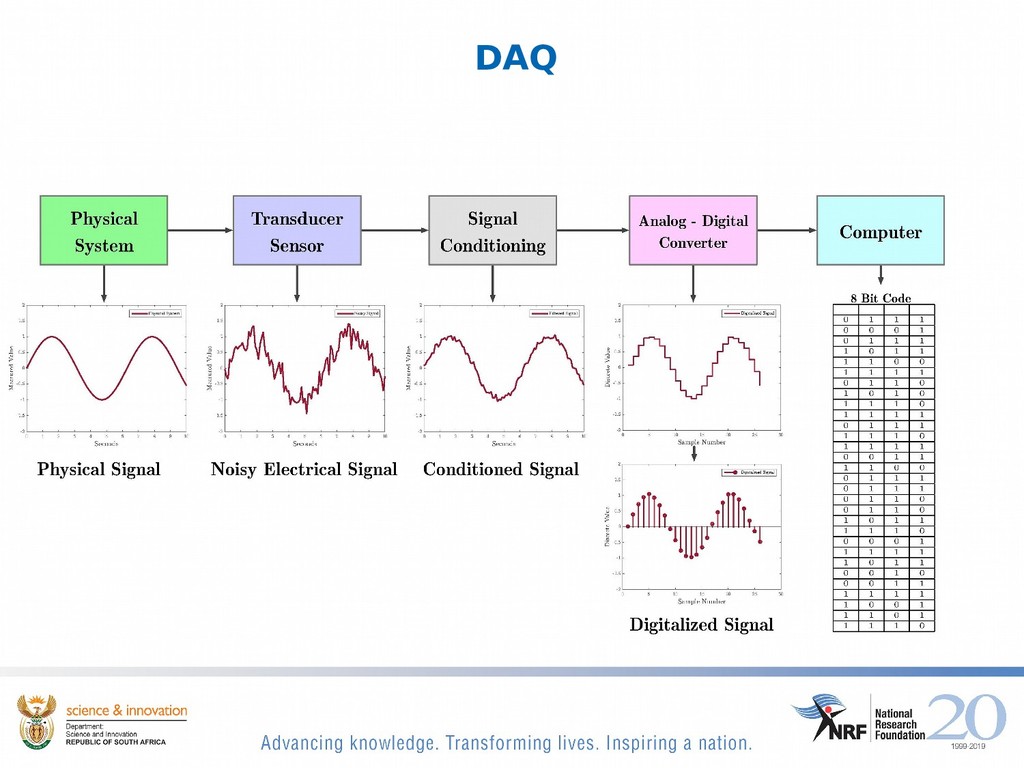
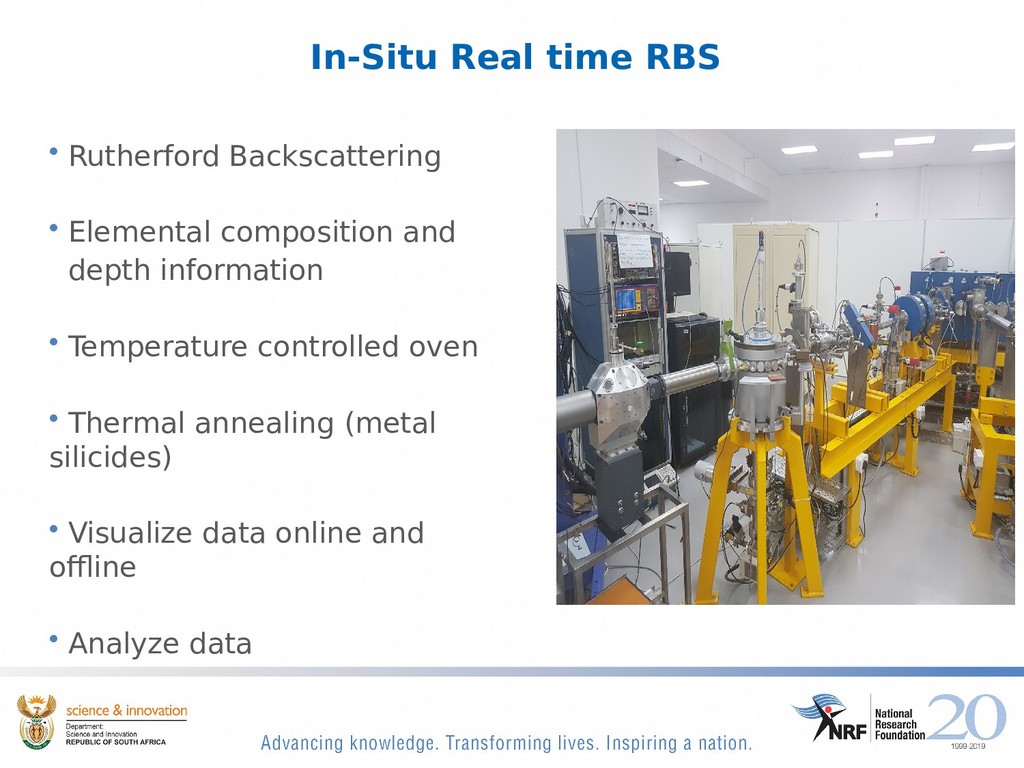
The field comprises of several techniques, one of which is Real Time In-Situ Rutherford Backscattering Spectrometry. This technique studies elemental composition and depth profiling during the formation of metal silicides, in real time, while the sample material is thermally annealed. Data for these experiments must be acquired by reading out electronics modules, and visualized/analyzed both during the experiment, and offline.

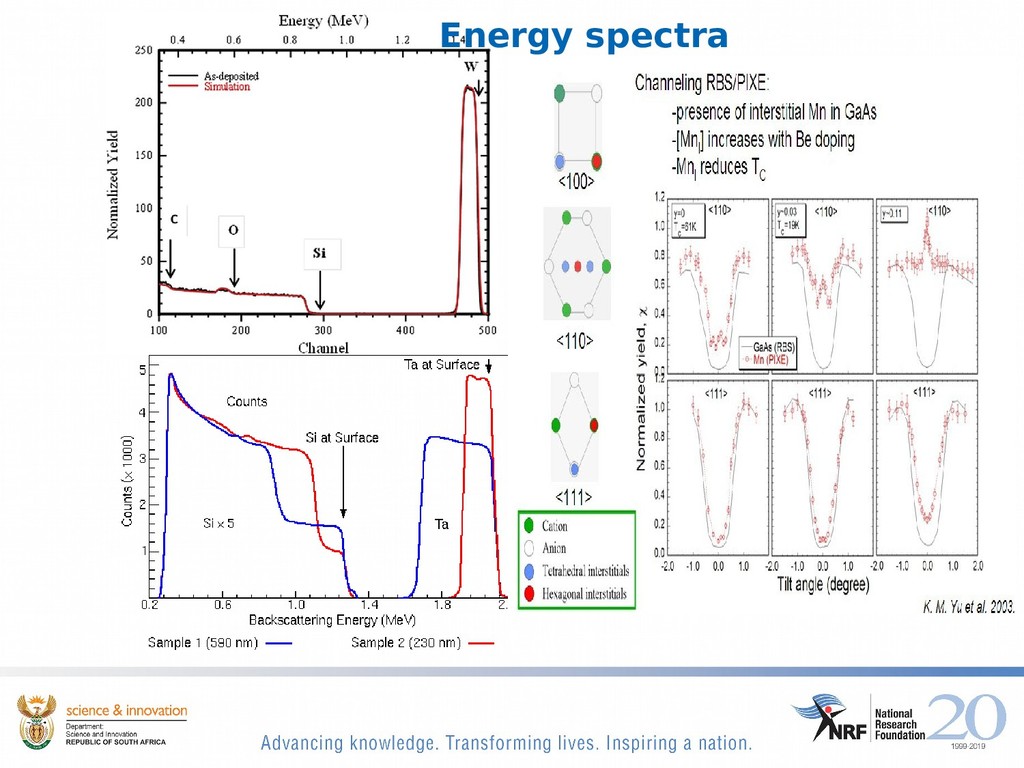
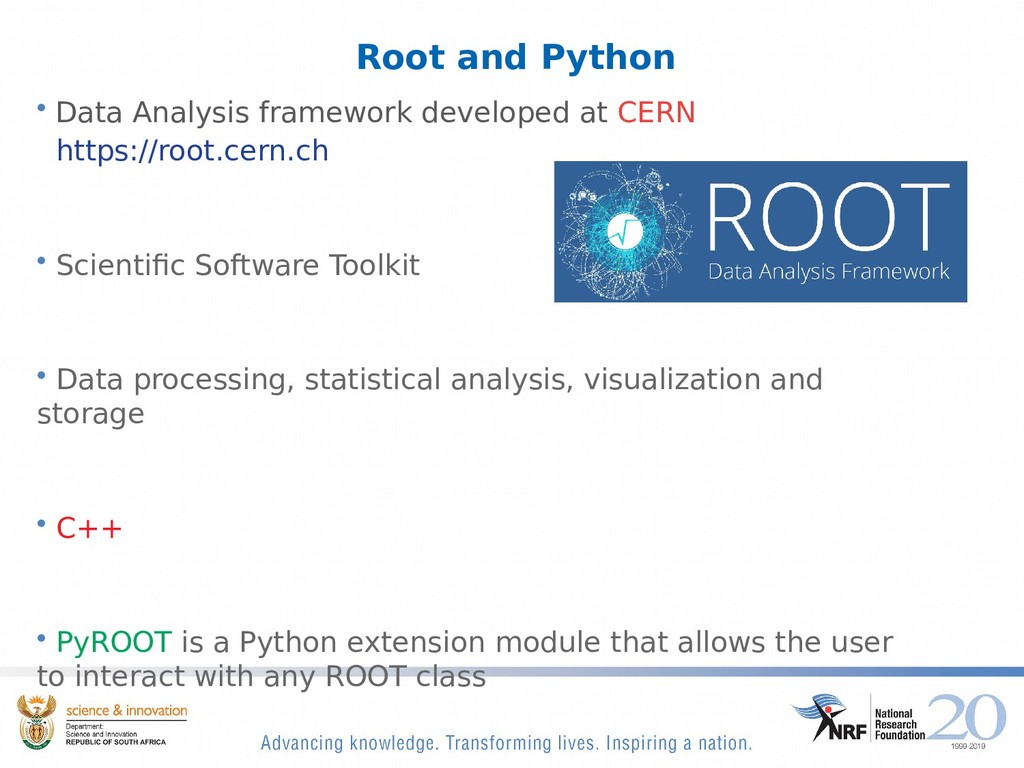
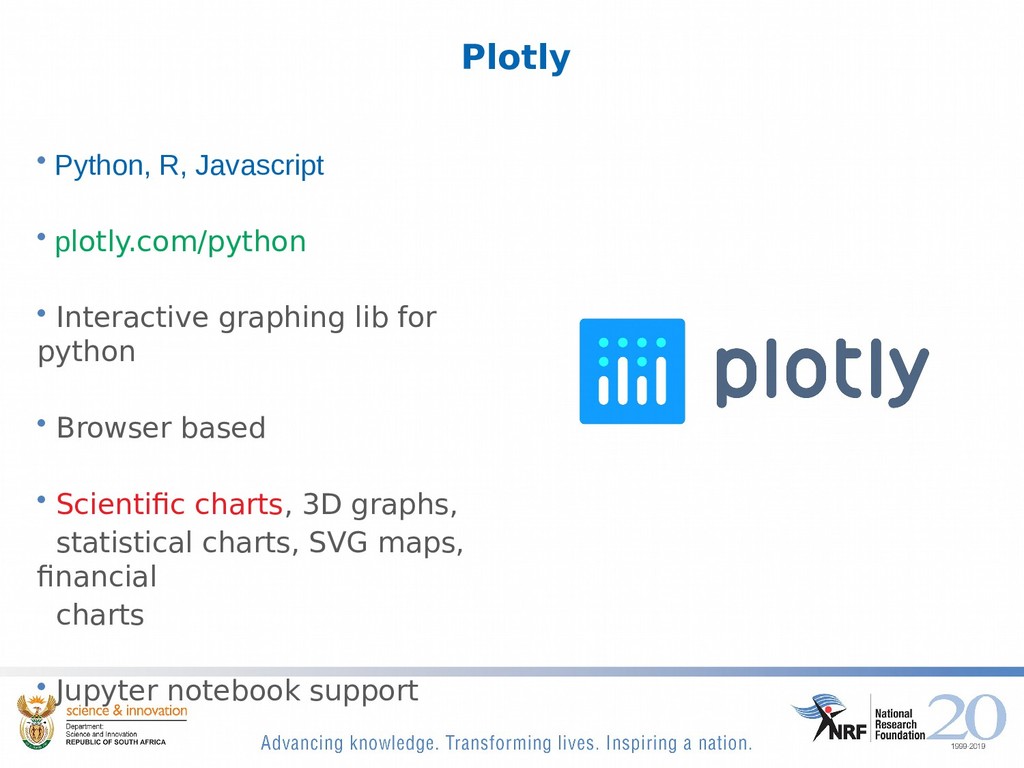
Data acquisition is done using largely in-house developed software built on top of open-source frameworks. The offline analysis, visualization and manipulation of this data, which includes the creation of contour and 3 dimensional plots of the backscattered particle histograms over time, is done using Python in combination with the ROOT data analysis framework developed at CERN. ROOT has an extension module named PyRoot, that allows interaction with ROOT functions and data structures from Python.

This talks discusses how the software was developed to achieve that, as well as how Python is used during a live experiment to log information about the state of the experiment and display that data using an ELK stack. While this is a case study in creating specific software tools to handle data from a novel physics experiment, it would be of general interest to anybody wanting to visualize data or do logging using Python.

Pycon ZA

October 11, 2019
Tweet

More Decks by Pycon ZA

Other Decks in Programming

Transcript

  1. Using Python to visualize and analyze ion beam experiment data

    at a particle accelerator facility Caswell Pieters iThemba LABS [email protected]
  2. iThemba LABS (Cape Town) • National Research Foundation • Multi-disciplinary

    Physics Laboratory • Nuclear Physics • Materials Research • Nuclear Medicine • Radioisotope Production • 2 Particle accelerators (200MeV Cyclotron, 3MV Tandetron)
  3. 200MeV Separated Sector Cyclotron • Maximum energy of 200 MeV

    1 MeV = 1,60218e-13 Joule 1 MeV = 3.82930210341e-12 kcal • Research and Training • Nuclear and accelerator physics • Radionuclide production
  4. 3MV Tandetron accelerator • Digitally controlled 3MV electrostatic accelerator •

    Built 2015-2016 High Voltage Engineering, Netherlands • Primarily produces beams of protons and alpha particles • 2 Experimental beam lines (micro beams μm/nm and broad beams mm)
  5. IBA Experimental Techniques • Scanning Nuclear Microprobe • In-Situ Real

    time Rutherford Backscattering • Channeling Rutherford Backscattering
  6. DAQ

  7. IBA computing requirements • Read out acquisition electronics (ADC’s, scalers,

    charge) • Slow control (stepper motors, beam scanners,etc ) • Data acquisition run control • Data formatting and storage • Visualize data online and offline • Analyze data
  8. The Nuclear Microprobe • Oxford Microbeams Nuclear Microprobe (1991) •

    Elemental composition of solids (geology, material science, biology) • Proton beam (keV→MeV) •Charateristic X-rays • Beam scanning
  9. NMP scanning • Up to 256 x 256 pixels •

    Typical area of 2669μm • Dwell time per pixel (10ms)
  10. In-Situ Real time RBS • Rutherford Backscattering • Elemental composition

    and depth information • Temperature controlled oven • Thermal annealing (metal silicides) • Visualize data online and offline • Analyze data
  11. Channeling (RBS) • Investigate crystalline materials • Channeling of charged

    particles in crystalline grid of sample • Determine the lattice position of impurities several relevant crystallographic directions
  12. Root and Python • Data Analysis framework developed at CERN

    https://root.cern.ch • Scientific Software Toolkit • Data processing, statistical analysis, visualization and storage • C++ • PyROOT is a Python extension module that allows the user to interact with any ROOT class
  13. Plotly • Python, R, Javascript • plotly.com/python • Interactive graphing

    lib for python • Browser based • Scientific charts, 3D graphs, statistical charts, SVG maps, financial charts • Jupyter notebook support