Upgrade to Pro — share decks privately, control downloads, hide ads and more …

Optimizing Performance at UConn

Optimizing Performance at UConn

Przybylski 중광

October 16, 2012
Tweet

More Decks by Przybylski 중광

Other Decks in Programming

Transcript

  1. Overview Planning Test plan and schedule Notifying interested parties (get

    people involved) Infastructure Test Exercisers Application Hosts Tools Tsung Recorder Open Performance Automation Framework Open-Synchronized-System-Resource-Monitoring jstat aragozin/jvm-tools (JTop GCRep) JVisualVM and AppDynamics
  2. More Overview Building Tests with the Open Performance Automation Framework

    Running Tests Reporting Statistics Analyzing Test Results Translating Analysis Data into Optimizations Lessons Learned
  3. Tools - Tsung Setup and Installation How it works Request

    simulation (Not browser simulation) Tests the application, not the server Features
  4. Tools - Open Performance Automation Framework DSL for Tsung Makes

    writing tests very easy Libraries for canned test function Allows scripting of Tsung which creates
  5. Tools - Open-Synchronized- System-Resource-Monitoring Aggregates resource reports (sar, jstat, netstat,

    etc...) from multiple sources. Utilizes perl modules. Needed to create a module for jstat. Eliminates human error by automating report generation and gathering.
  6. Tools - jstat and jstatd It’s a command line tool

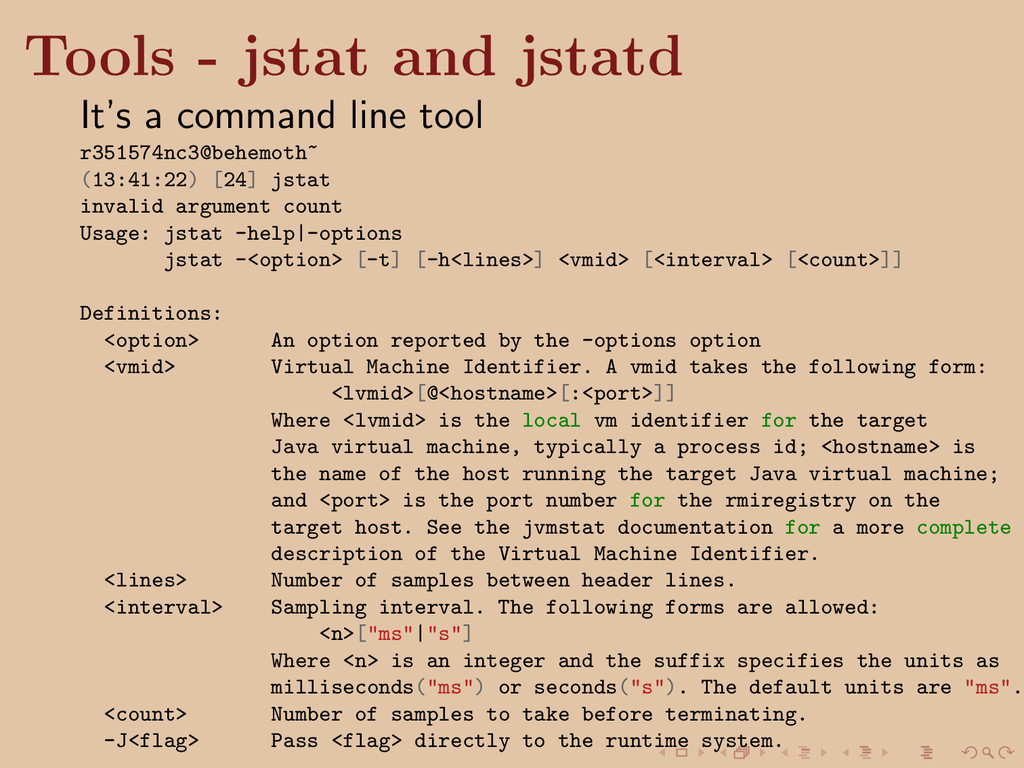
    r351574nc3@behemoth~ (13:41:22) [24] jstat invalid argument count Usage: jstat -help|-options jstat -<option> [-t] [-h<lines>] <vmid> [<interval> [<count>]] Definitions: <option> An option reported by the -options option <vmid> Virtual Machine Identifier. A vmid takes the following form: <lvmid>[@<hostname>[:<port>]] Where <lvmid> is the local vm identifier for the target Java virtual machine, typically a process id; <hostname> is the name of the host running the target Java virtual machine; and <port> is the port number for the rmiregistry on the target host. See the jvmstat documentation for a more complete description of the Virtual Machine Identifier. <lines> Number of samples between header lines. <interval> Sampling interval. The following forms are allowed: <n>["ms"|"s"] Where <n> is an integer and the suffix specifies the units as milliseconds("ms") or seconds("s"). The default units are "ms". <count> Number of samples to take before terminating. -J<flag> Pass <flag> directly to the runtime system.
  7. Tools - jstat and jstatd Kicking it off r351574nc3@behemoth~ (13:50:33)

    [36] jstat 99672 10 720 S0 S1 E O P YGC YGCT FGC FGCT GCT 0.00 0.00 73.14 32.32 53.38 2758 93.932 30 51.206 145.137 0.00 0.00 79.10 32.32 53.38 2758 93.932 30 51.206 145.137 0.00 0.00 86.86 32.32 53.38 2758 93.932 30 51.206 145.137 0.00 0.00 96.22 32.32 53.38 2758 93.932 30 51.206 145.137 0.00 0.00 1.93 33.27 53.38 2759 94.013 30 51.206 145.218 0.00 0.00 16.57 33.27 53.38 2759 94.013 30 51.206 145.218 0.00 0.00 24.34 33.27 53.38 2759 94.013 30 51.206 145.218 0.00 0.00 33.70 33.27 53.38 2759 94.013 30 51.206 145.218 0.00 0.00 45.62 33.27 53.38 2759 94.013 30 51.206 145.218 0.00 0.00 68.19 33.27 53.38 2759 94.013 30 51.206 145.218 0.00 0.00 79.84 33.27 53.38 2759 94.013 30 51.206 145.218
  8. Tools - aragozin/jvm-tools (JTop GCRep) https://github.com/aragozin/jvm-tools Very useful for dumping

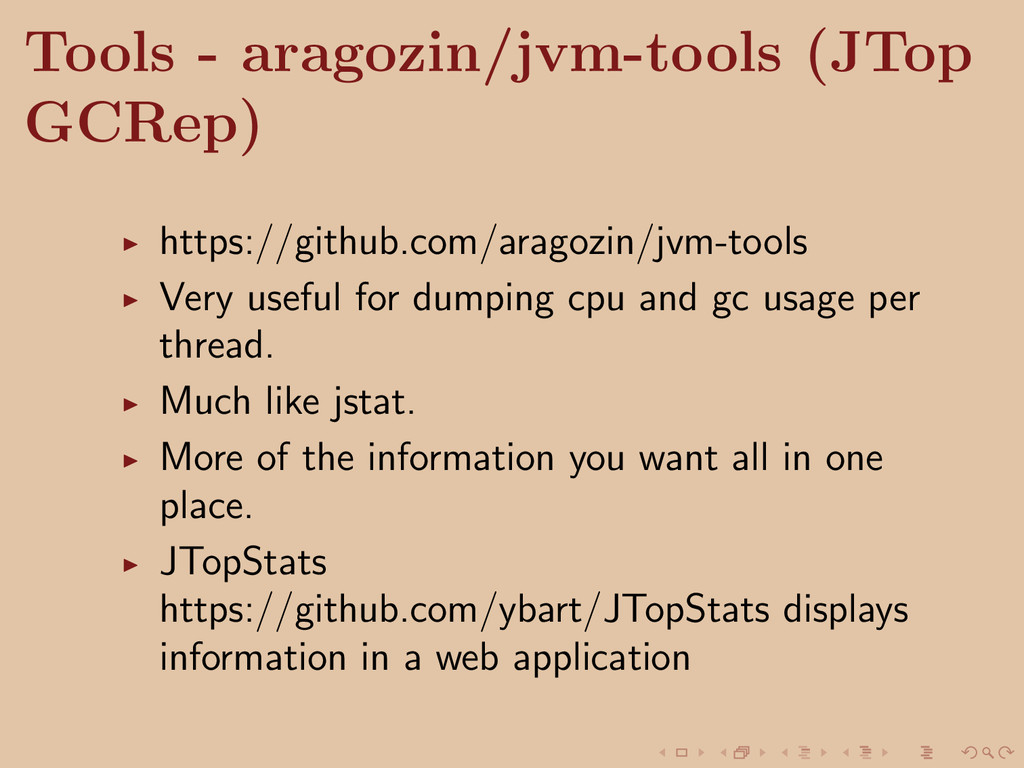
    cpu and gc usage per thread. Much like jstat. More of the information you want all in one place. JTopStats https://github.com/ybart/JTopStats displays information in a web application
  9. Building Tests with the Open Performance Automation Framework The framework

    http://www.github.com/leo-at-rsmart/Open- Performance-Automation-Framework Handling posts
  10. Open Performance Automation Framework Structure |- |-/config |---data |-----kfs |-------data

    |---import |-----kfs |---tests |---lib |-----kfs |---tests |------kfs |-/lib |---kfs |-----common |-----dv |-/log |-/suites |---kfs |-/tests |---kfs
  11. Starting with the Tsung Recorder Eliminates human error. Useful for

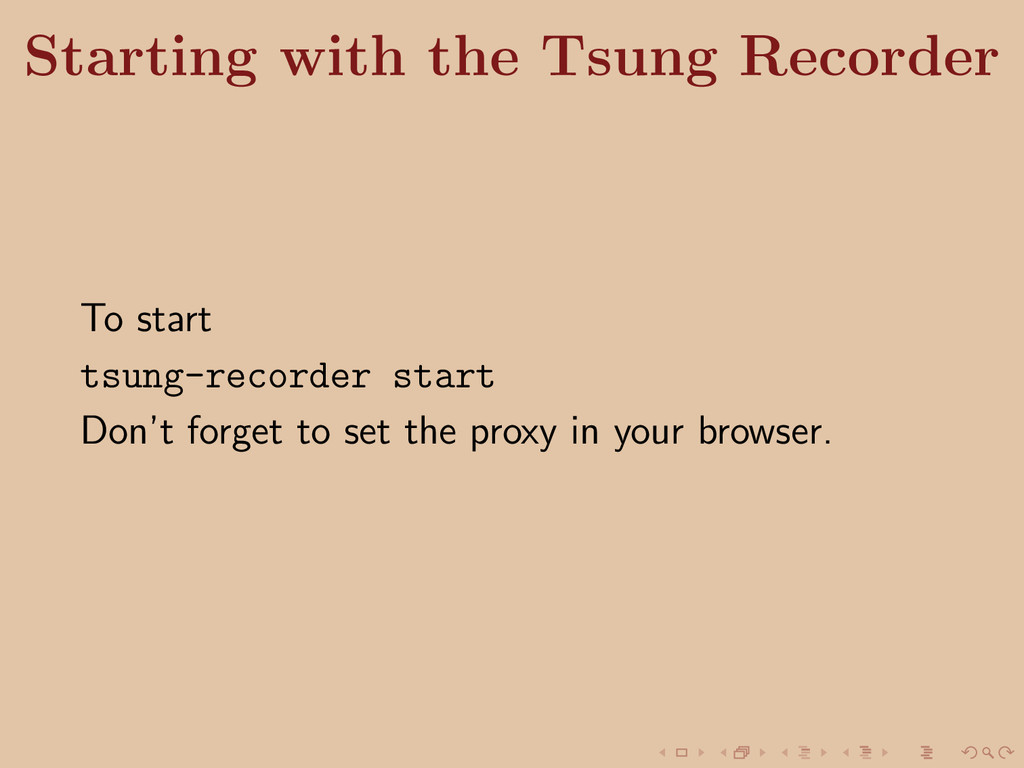
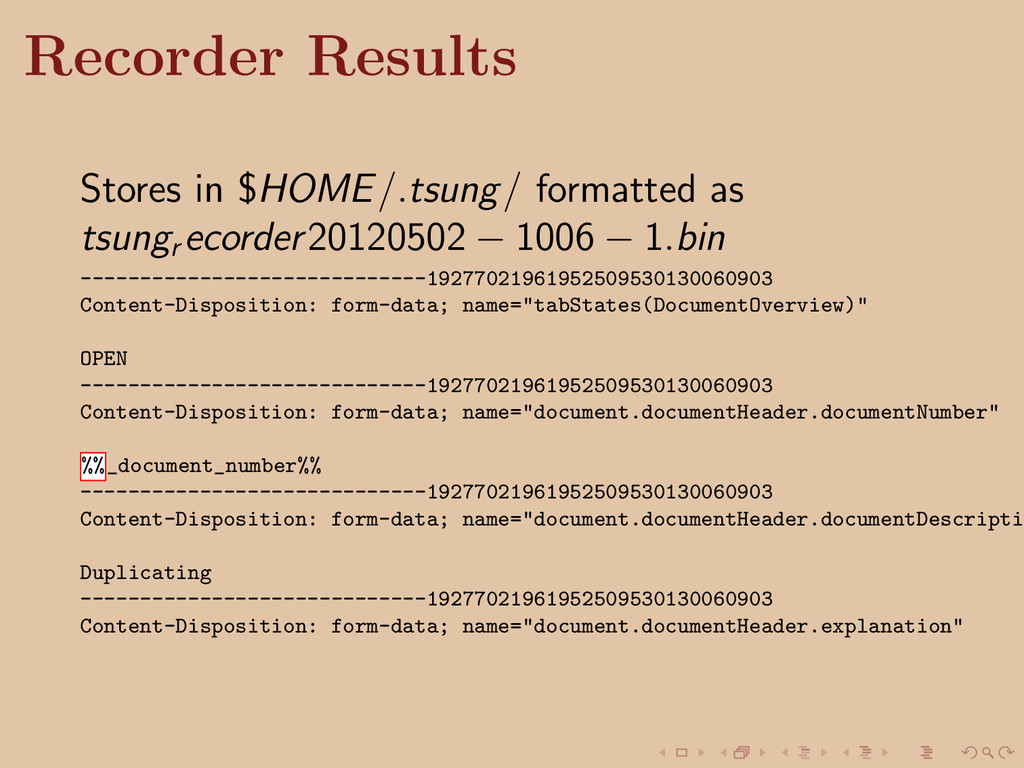
    gathering data for multipart form submissions. It’s a proxy to start it: (11:24:33) [1] /opt/local/bin/tsung-recorder --help /opt/local/bin/tsung-recorder: illegal option -- - Usage: tsung-recorder <options> start|stop|restart Options: -p <plugin> plugin used for the recorder available: http, pgsql,webdav (default is http) -L <port> listening port for the recorder (default is 8090) -I <IP> for the pgsql recorder (or parent proxy): server IP (default is 127.0.0.1) -P <port> for the pgsql recorder (or parent proxy): server por (default is 5432) -u for the http recorder: use a parent proxy -d <level> set log level from 0 to 7 (default is 5) -v print version information and exit -h display this help and exit
  12. Recorder Results Stores in $HOME/.tsung/ formatted as tsungr ecorder20120502 −

    1006 − 1.bin -----------------------------19277021961952509530130060903 Content-Disposition: form-data; name="tabStates(DocumentOverview)" OPEN -----------------------------19277021961952509530130060903 Content-Disposition: form-data; name="document.documentHeader.documentNumber" %%_document_number%% -----------------------------19277021961952509530130060903 Content-Disposition: form-data; name="document.documentHeader.documentDescripti Duplicating -----------------------------19277021961952509530130060903 Content-Disposition: form-data; name="document.documentHeader.explanation"
  13. Test Development Patterns Develop tests per document Common actions can

    be moved into libraries and reused Simulate user clicks by adding pauses
  14. Infrastructure/Creating a Test Environment: Exercisors Plan on Unix open file

    limitations for socket connections Exercisers can consume CPU and hard disk resources Shoot for a minimum of 2.5Ghz 4 Cores with 4 Gb of memory. 250 Gb of hard disk space (logs can take up a lot of space). 2 - 4 exercisers (assume 1 exercisor is equivalent to 50 users). Virtual machines are acceptable.
  15. Caveats Impacting External Live Systems The boundary between testing environment

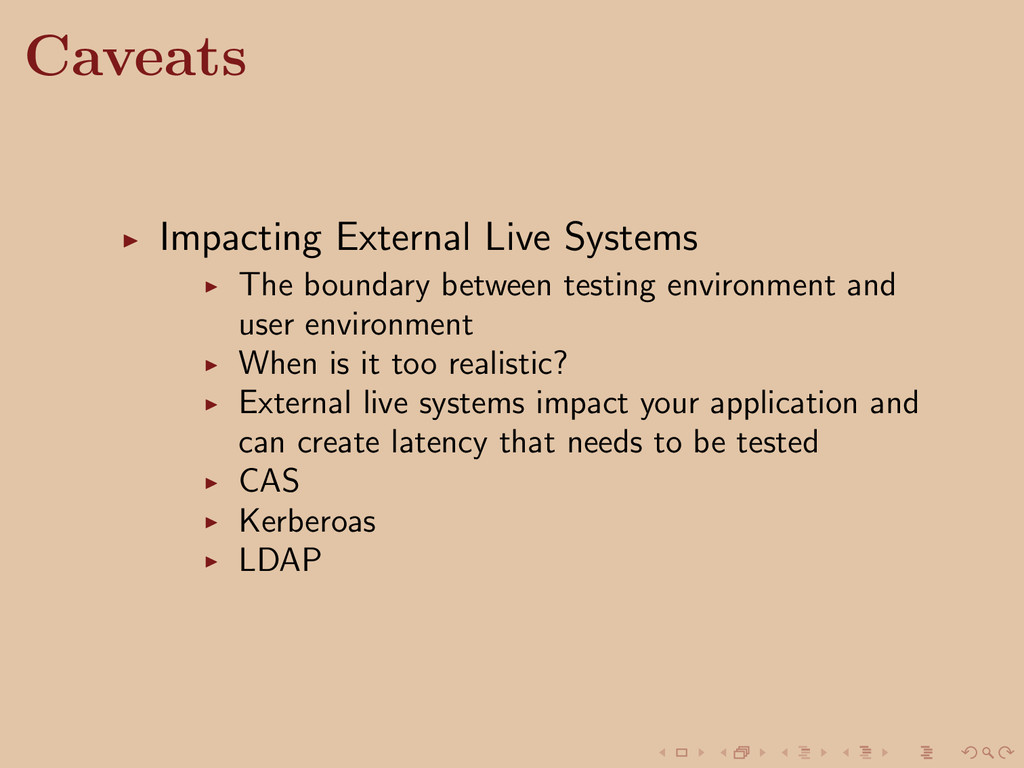
    and user environment When is it too realistic? External live systems impact your application and can create latency that needs to be tested CAS Kerberoas LDAP
  16. Optimization Improving Request Times SessionDocumentService Improved Logging Reducing data transfered

    Reducing web service calls Transactional vs. Non-transactional datasources Optimal hardware configurations CPU impact Memory impact
  17. Lessons Learned 1. Test frequently. 2. Establish a baseline for

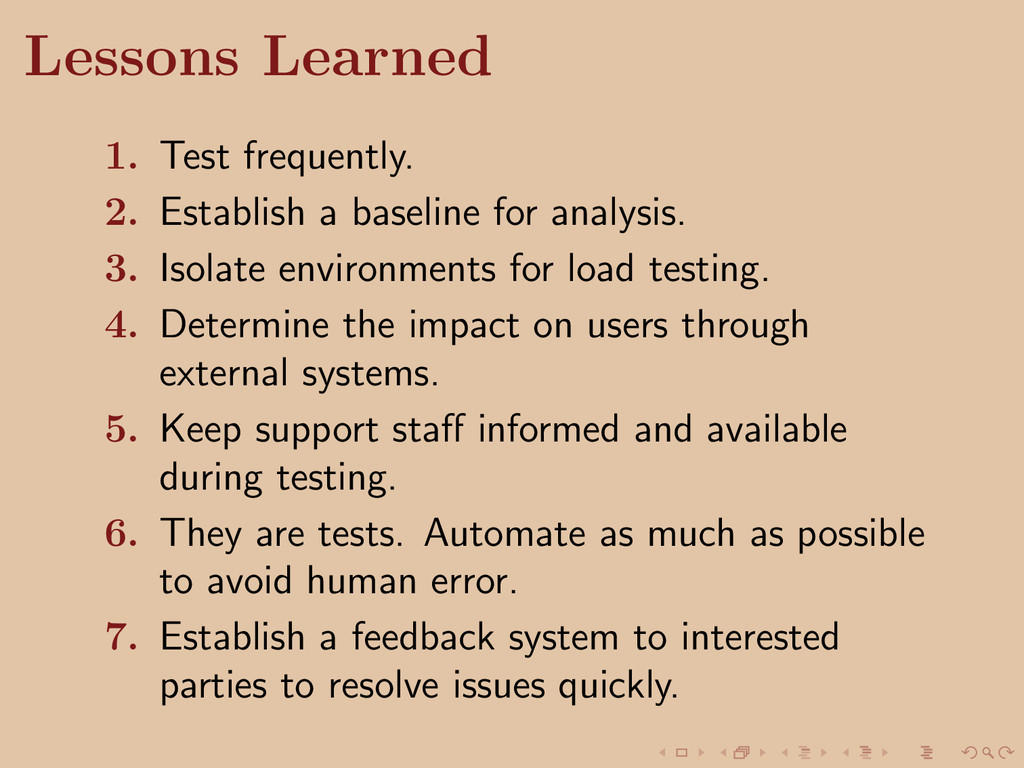
    analysis. 3. Isolate environments for load testing. 4. Determine the impact on users through external systems. 5. Keep support staff informed and available during testing. 6. They are tests. Automate as much as possible to avoid human error. 7. Establish a feedback system to interested parties to resolve issues quickly.