Suggestions to drivers and operations. • Driver Navigation. • In this presentation, • Demand prediction and driver efficiency analysis. – Mathematical models used. – Analytics and machine learning.
Generating of a mathematical model. • Time-series model with trend detection. • Other approaches, – Blending: Use the prediction/actual demand gap for the previous hour to correct the prediction for next hour – Predict demand for smaller time intervals/areas(cluster rather than localities)
demand. • Demand profile(demand in a time interval as a fraction of daily demand) is roughly same even if orders/day can fluctuate. • Demand in a locality is independent of demand in other localities. In essence we need a `different model' for each locality. • Depending on the maturity of a locality it can have a trend (mostly upwards since we are growing!)
data to fit and with the hyper growth of roadrunnr, using data that is older than 30 days old is not advisable. • Demand is also affected by supply shocks such as driver incentive changes and hence going too far back in time leads to too much variation in data that cannot be explained by standard arima. • Holidays are entirely non seasonal demand bursts which also complicates model building and hence we defer building that model and instead build a simpler model that is entirely different for weekends/holidays and weekdays.
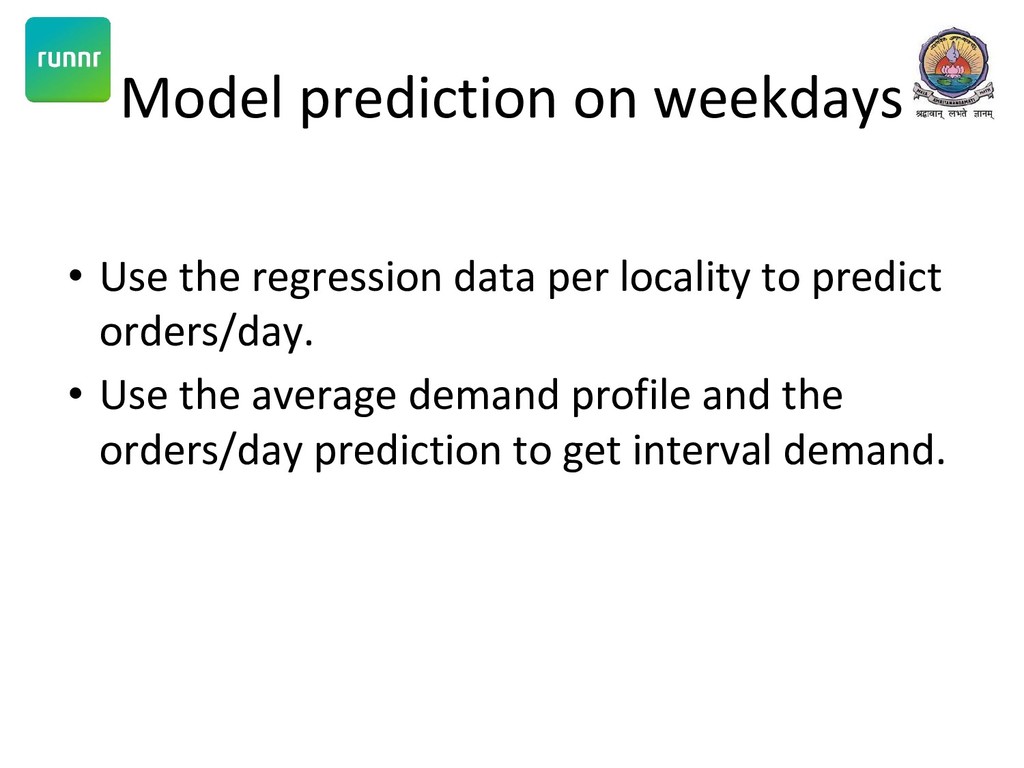
30 day historical orders – Filter weekend/holiday data – For each day calculate demand profile(order count in an hour/total orders in a day). – Calculate avg demand profile for the locality – Calculate total orders for each day – Detect a trend in orders/day time series using regression data at 70% confidence.
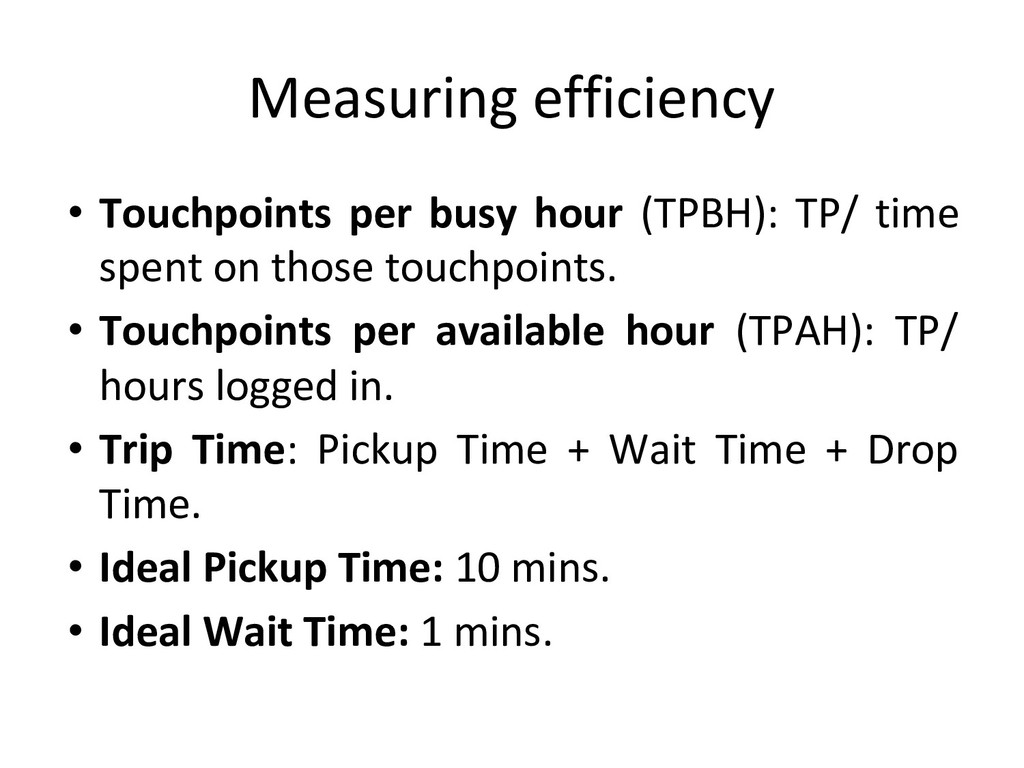
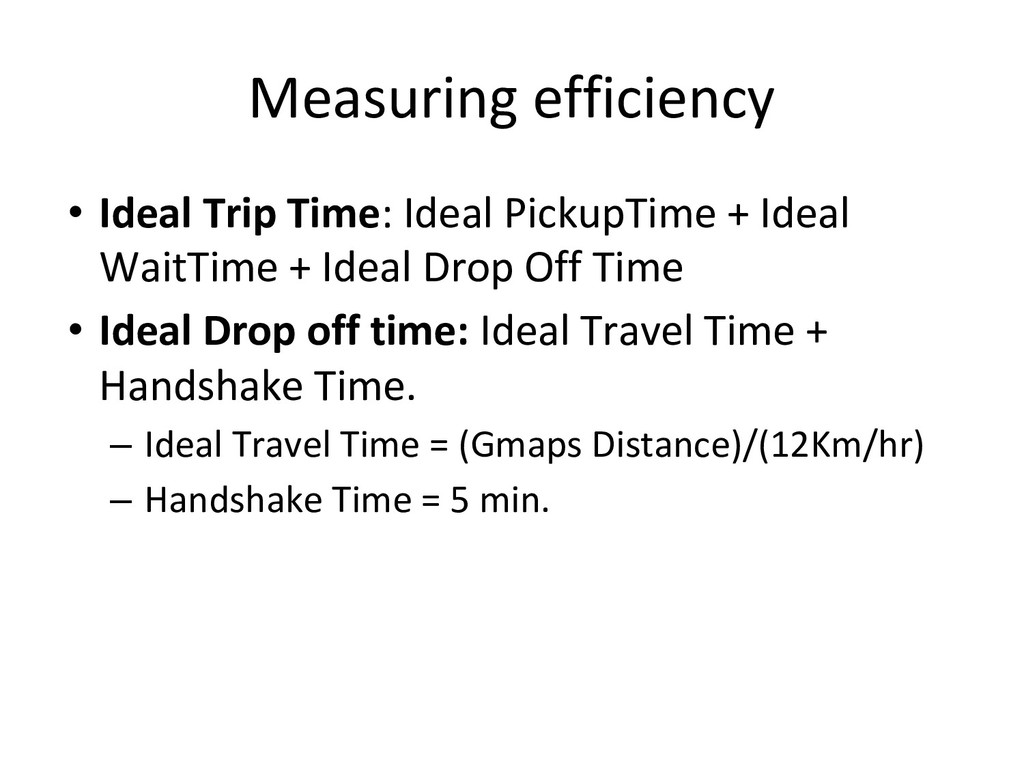
spent on those touchpoints. • Touchpoints per available hour (TPAH): TP/ hours logged in. • Trip Time: Pickup Time + Wait Time + Drop Time. • Ideal Pickup Time: 10 mins. • Ideal Wait Time: 1 mins.
WaitTime + Ideal Drop Off Time • Ideal Drop off time: Ideal Travel Time + Handshake Time. – Ideal Travel Time = (Gmaps Distance)/(12Km/hr) – Handshake Time = 5 min.
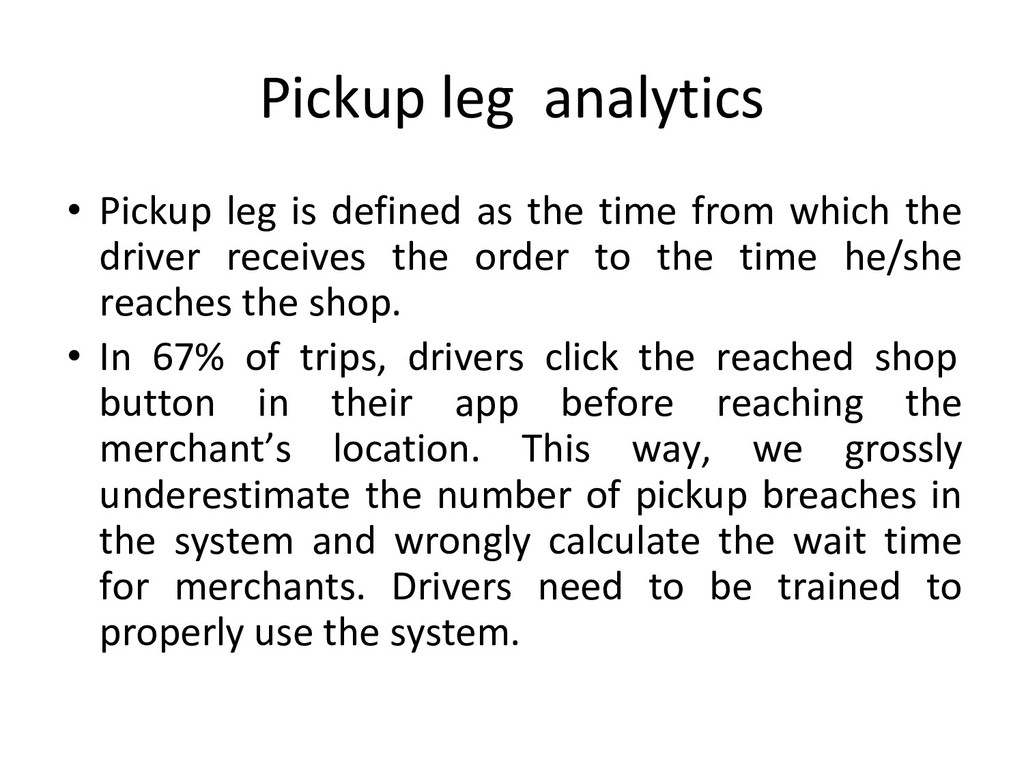
time from which the driver receives the order to the time he/she reaches the shop. • In 67% of trips, drivers click the reached shop button in their app before reaching the merchant’s location. This way, we grossly underestimate the number of pickup breaches in the system and wrongly calculate the wait time for merchants. Drivers need to be trained to properly use the system.
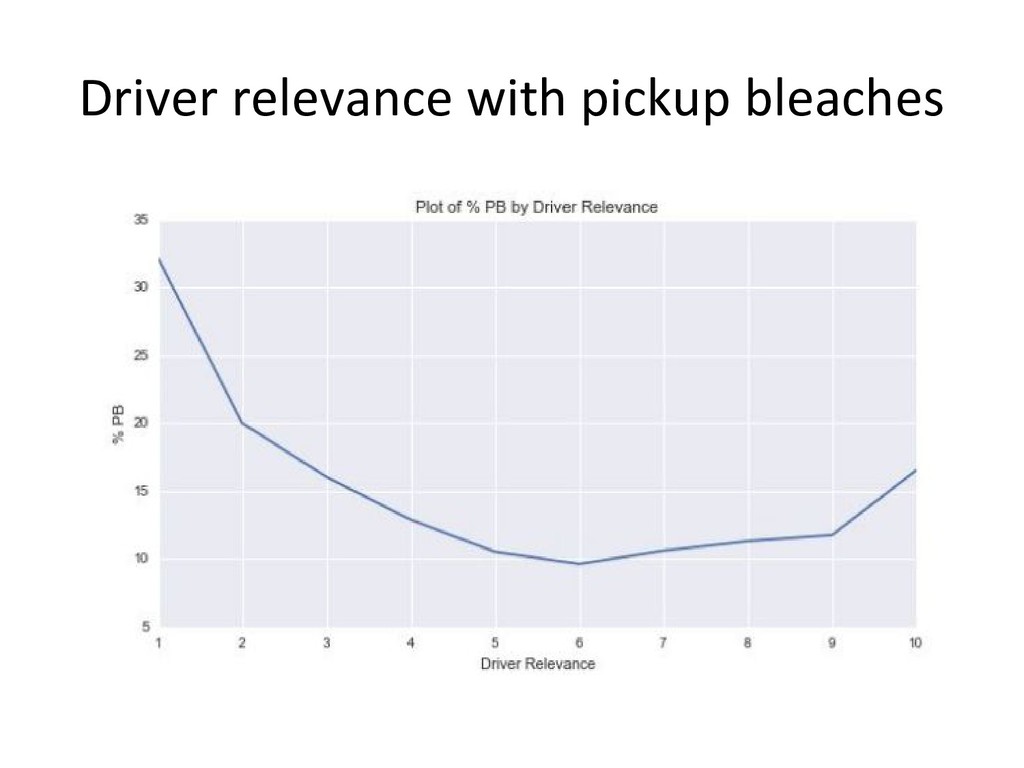
60% Hour of day 20% Driver relevance 11% Cross locality pickup 9% • Driver Relevance is the number of times the driver has been to the merchant before this trip.
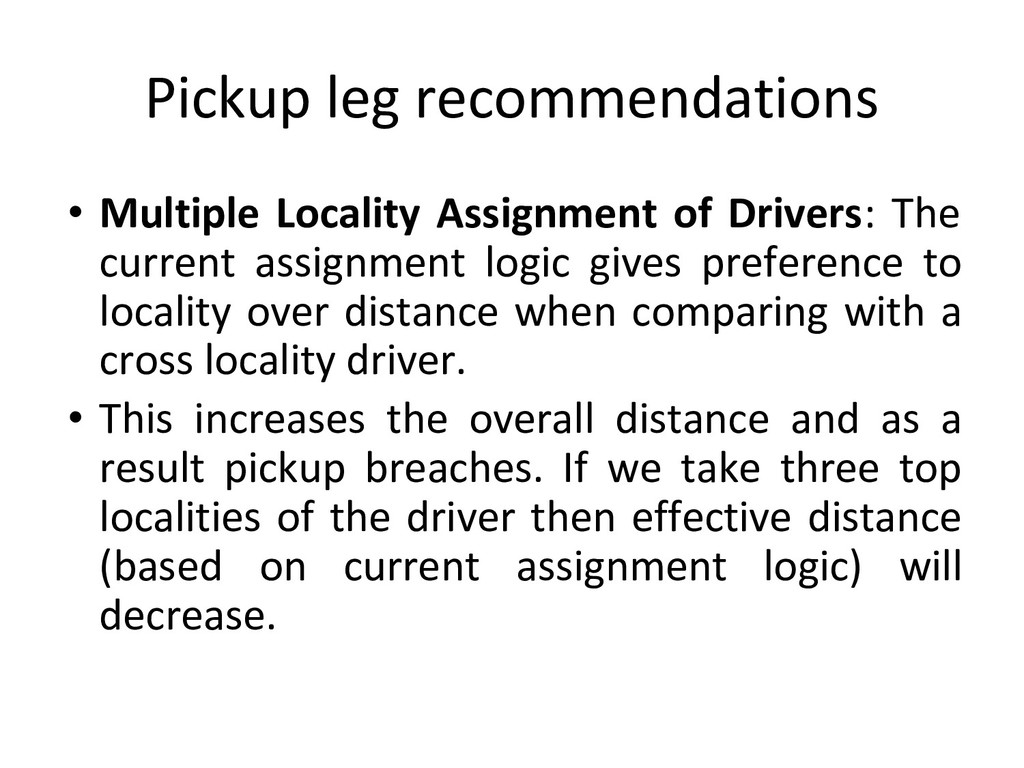
current assignment logic gives preference to locality over distance when comparing with a cross locality driver. • This increases the overall distance and as a result pickup breaches. If we take three top localities of the driver then effective distance (based on current assignment logic) will decrease.
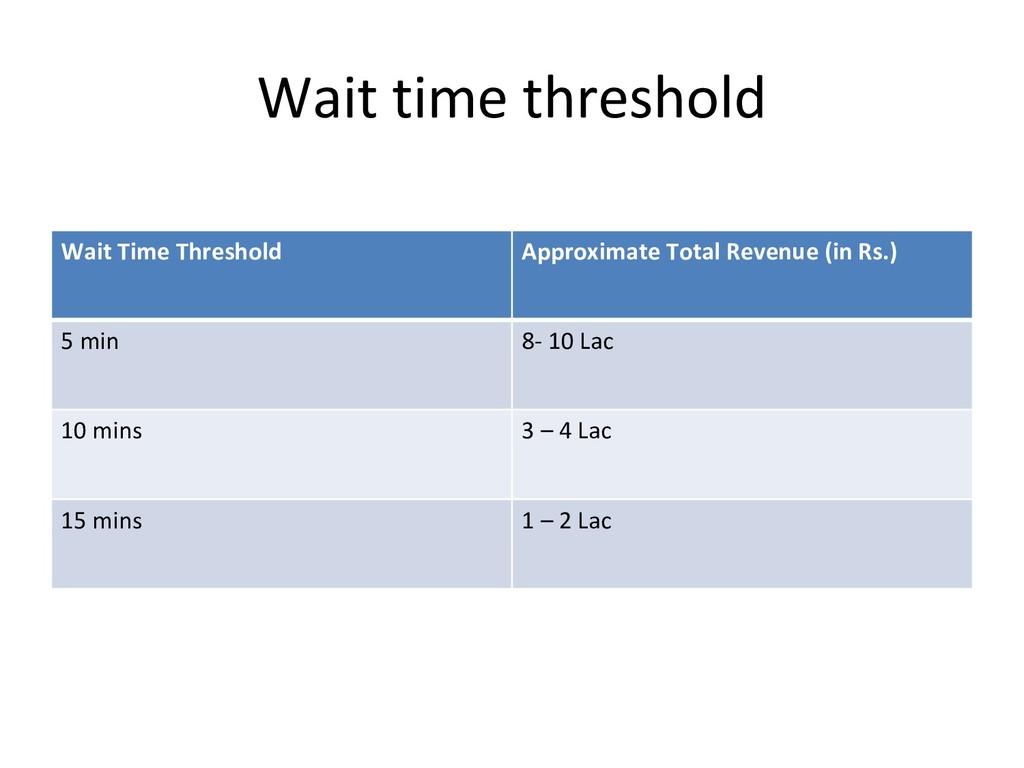
the time from when the driver has reached the shop to package shipment. • One analysis featured around charging for wait times to merchants: Let’s say we charge 1 Re/min for any minute above a certain threshold. Here is the breakdown of approximate amount of revenue we will earn in a day per city:
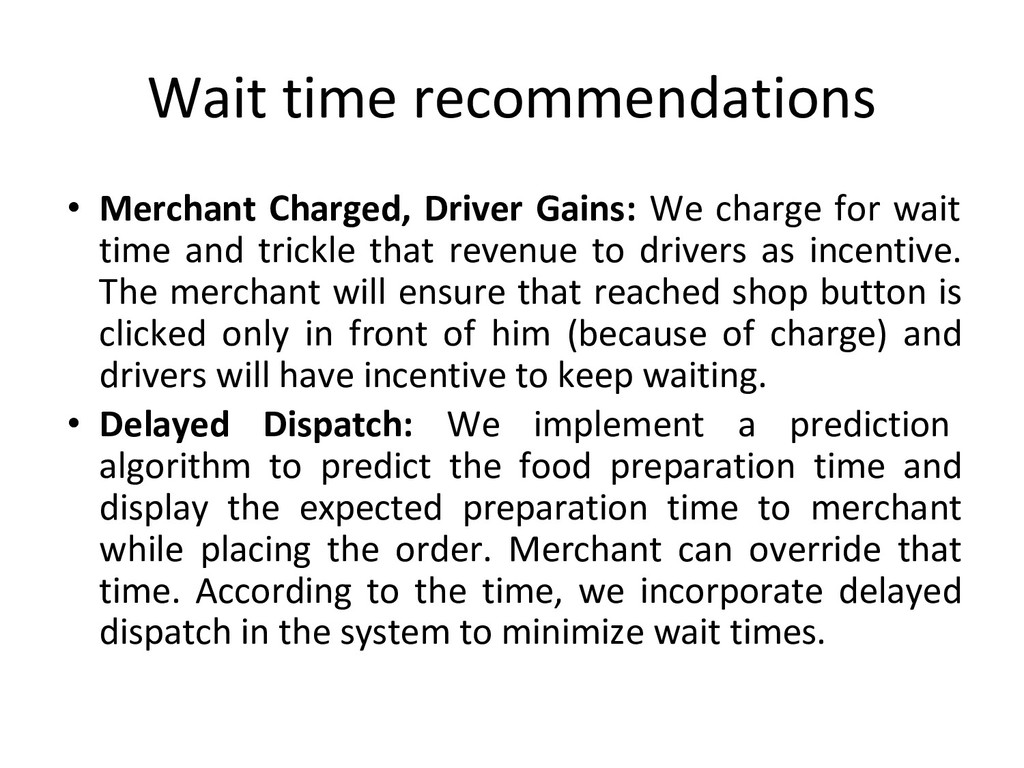
for wait time and trickle that revenue to drivers as incentive. The merchant will ensure that reached shop button is clicked only in front of him (because of charge) and drivers will have incentive to keep waiting. • Delayed Dispatch: We implement a prediction algorithm to predict the food preparation time and display the expected preparation time to merchant while placing the order. Merchant can override that time. According to the time, we incorporate delayed dispatch in the system to minimize wait times.
the driver took to drop the shipment to the customer. It approximately contributes to 66% of total trip time on an average. • Travel Distance and traffic is a major factor which contributes to the drop off times. Driver Relevance and other things are not so much important.
the delivery driver picks the shipment. A notification is sent to the customer to track the order. • Once the customer clicks on the tracking URL, the customer’s current location is found and sent to the server. The Customer-to-location relation is established. • Meanwhile, the delivery driver is moving towards the customer sub-locality specified by the merchant. • Once the customer location is found, it is sent to delivery driver in the next ping request. A GCM or an MQTT message would reach the driver and the trip is updated with the customer location. • The driver is navigated to the customers location.