• MS Office Vulnerabilities • Client Side Applications • Human Factor • Make hardware to execute malware (USB etc..) • P2P file sharing platforms • Social Media • Etc…
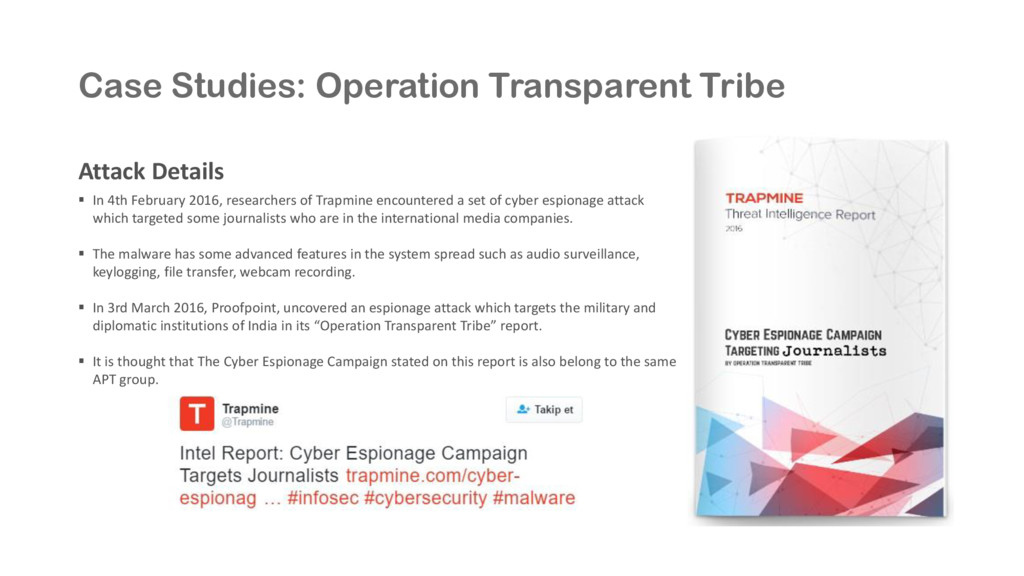
February 2016, researchers of Trapmine encountered a set of cyber espionage attack which targeted some journalists who are in the international media companies. The malware has some advanced features in the system spread such as audio surveillance, keylogging, file transfer, webcam recording. In 3rd March 2016, Proofpoint, uncovered an espionage attack which targets the military and diplomatic institutions of India in its “Operation Transparent Tribe” report. It is thought that The Cyber Espionage Campaign stated on this report is also belong to the same APT group.
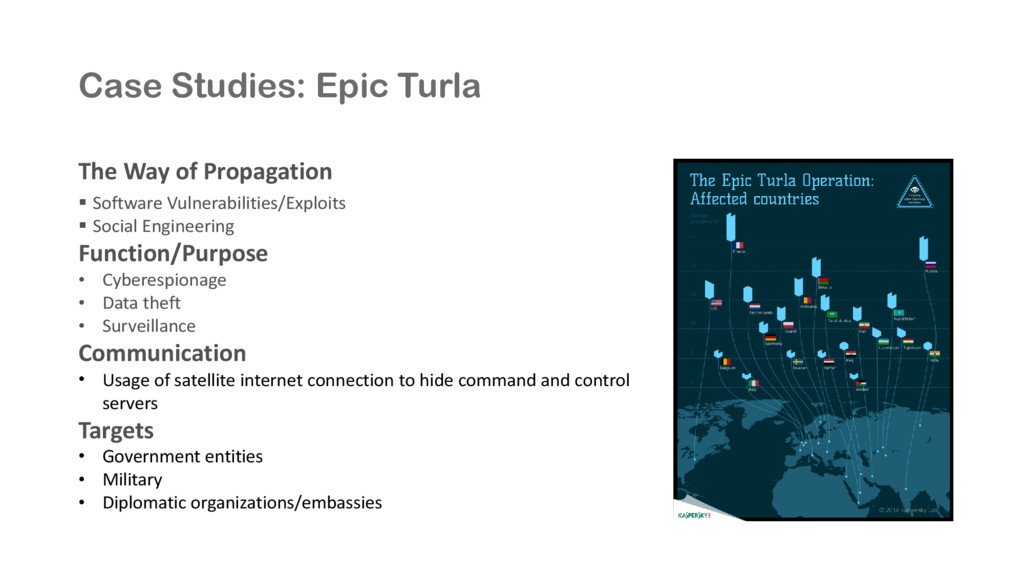
Vulnerabilities/Exploits Social Engineering Function/Purpose • Cyberespionage • Data theft • Surveillance Communication • Usage of satellite internet connection to hide command and control servers Targets • Government entities • Military • Diplomatic organizations/embassies
Understanding complex software architecture • Discovering software vulnerabilities and exploit the weakness • Closed source code analysis and understanding how software works • Patch analysis and exploiting one-day vulnerabilities • Incident response and digital forensics.
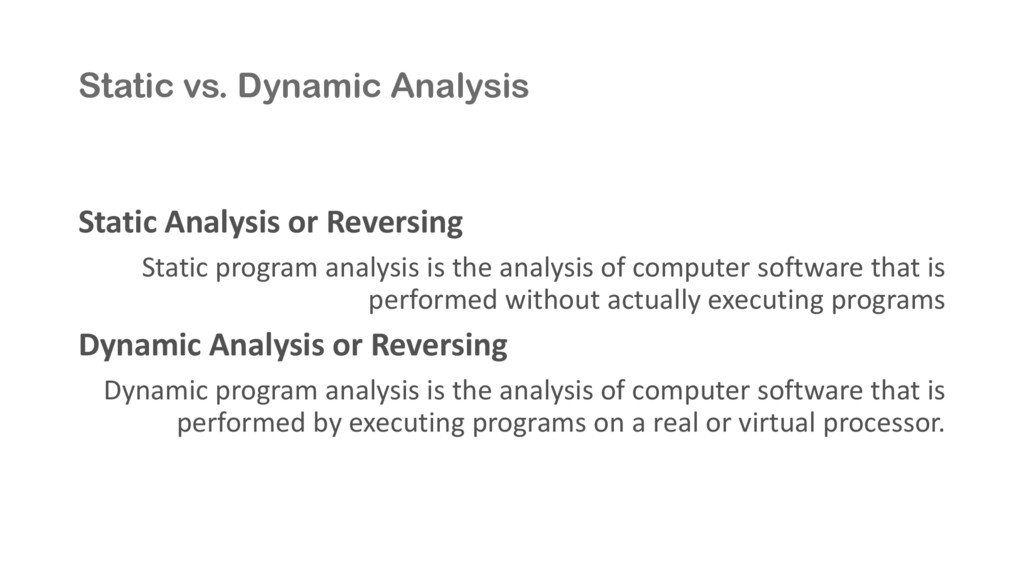
analysis is the analysis of computer software that is performed without actually executing programs Dynamic Analysis or Reversing Dynamic program analysis is the analysis of computer software that is performed by executing programs on a real or virtual processor.
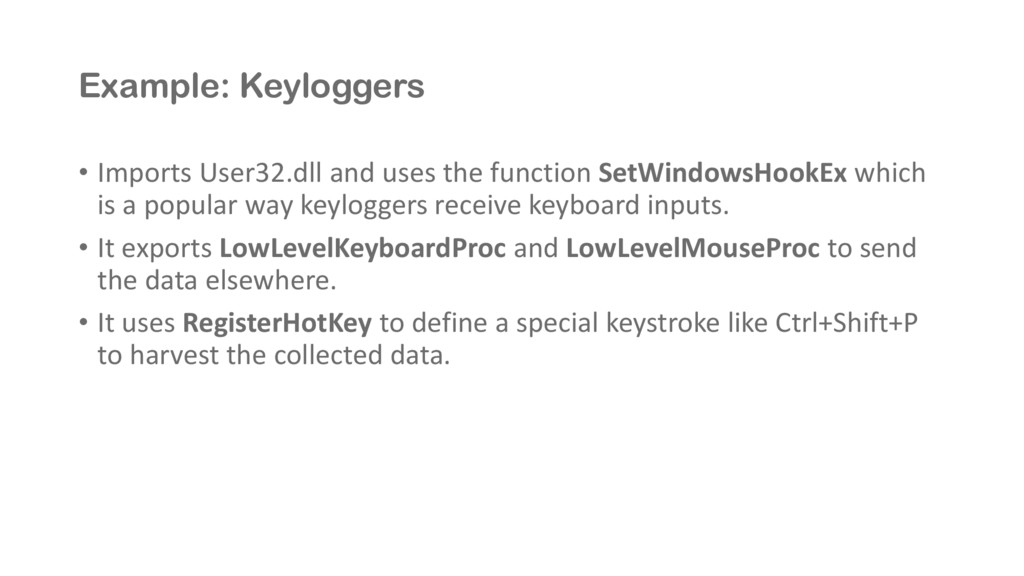
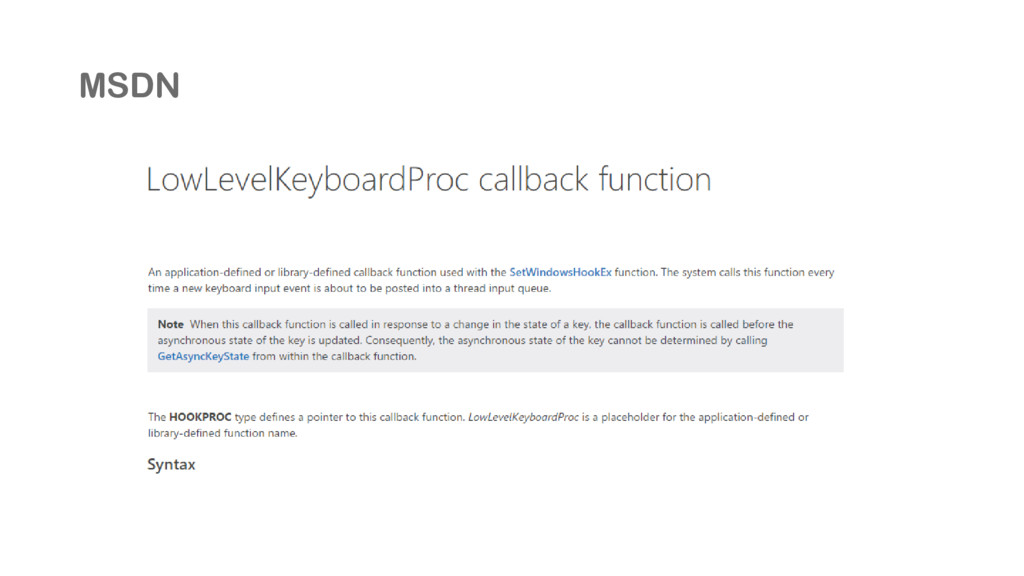
which is a popular way keyloggers receive keyboard inputs. • It exports LowLevelKeyboardProc and LowLevelMouseProc to send the data elsewhere. • It uses RegisterHotKey to define a special keystroke like Ctrl+Shift+P to harvest the collected data.
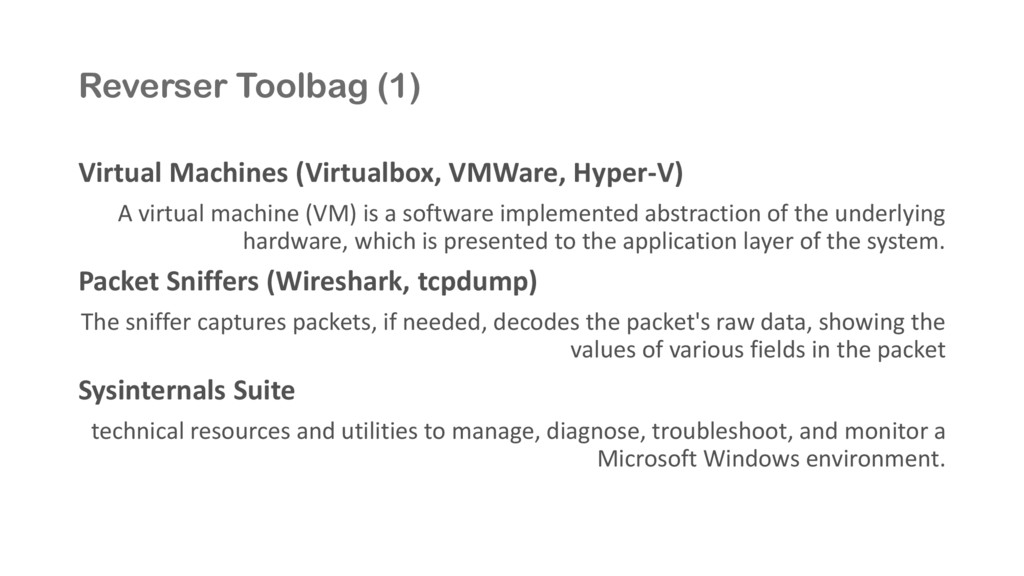
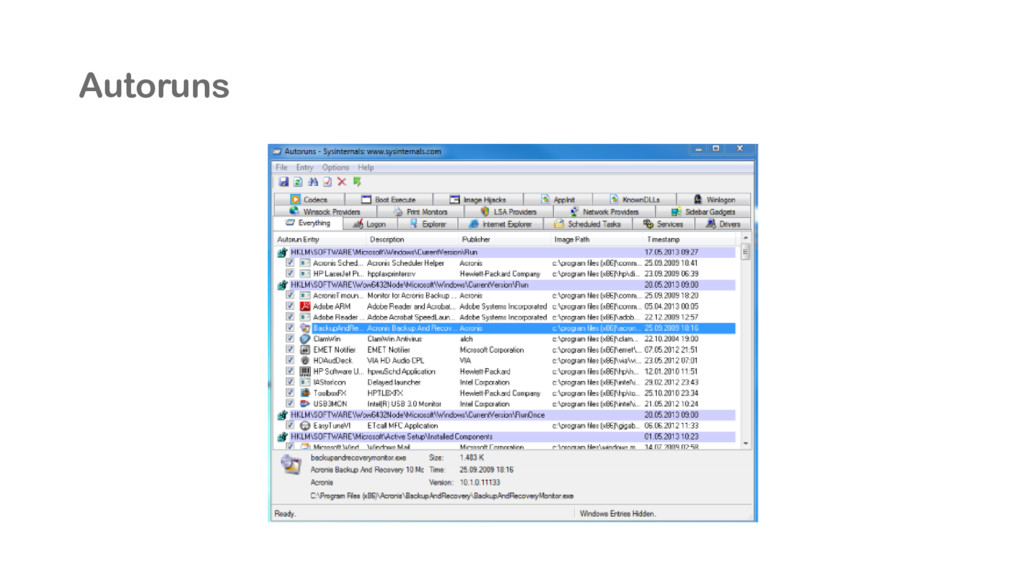
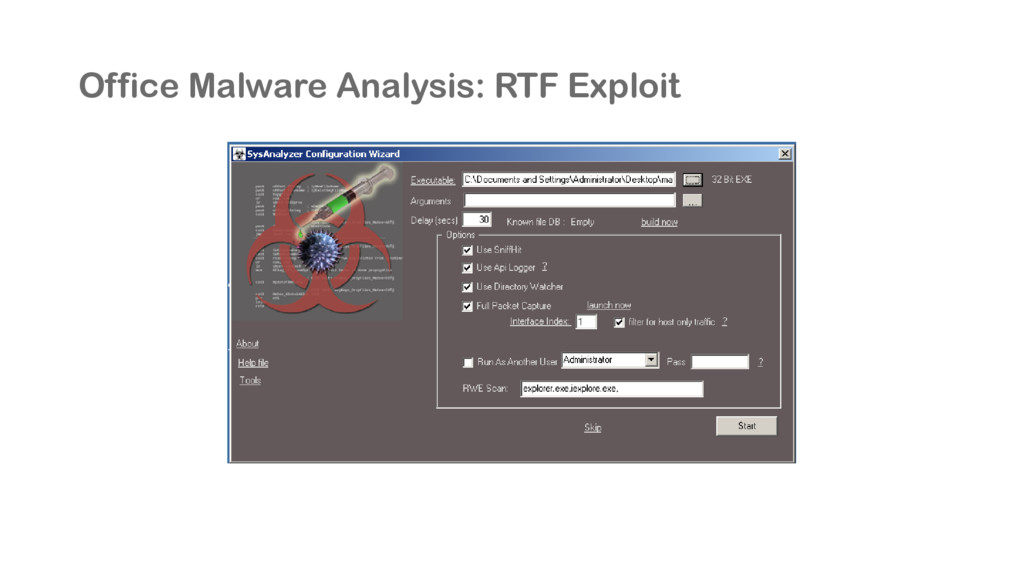
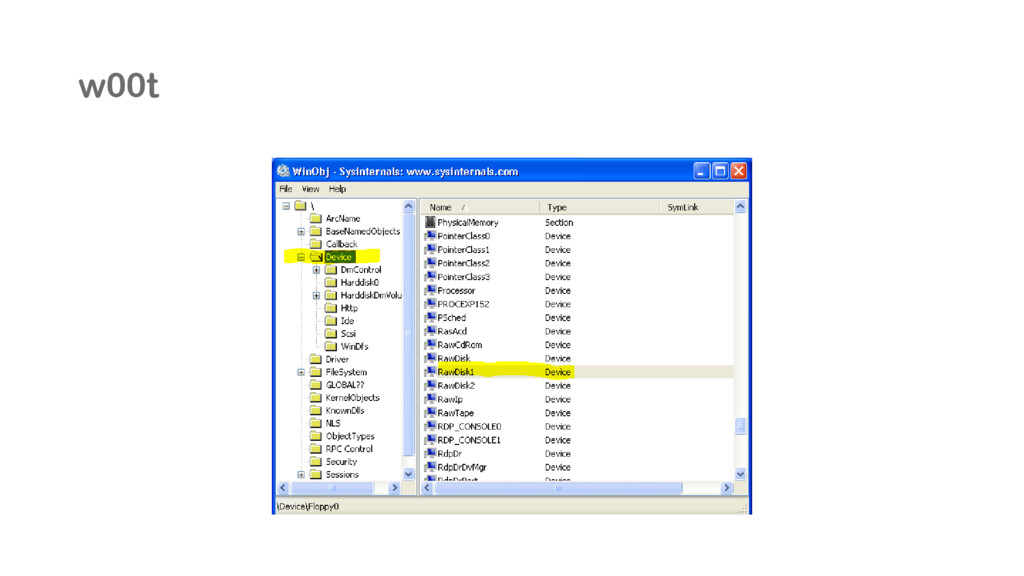
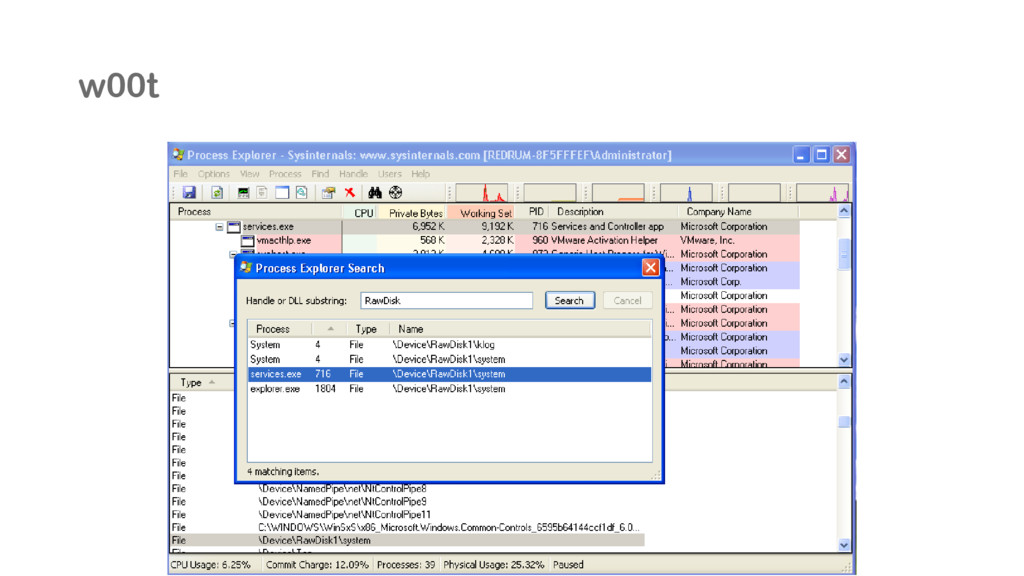
machine (VM) is a software implemented abstraction of the underlying hardware, which is presented to the application layer of the system. Packet Sniffers (Wireshark, tcpdump) The sniffer captures packets, if needed, decodes the packet's raw data, showing the values of various fields in the packet Sysinternals Suite technical resources and utilities to manage, diagnose, troubleshoot, and monitor a Microsoft Windows environment.
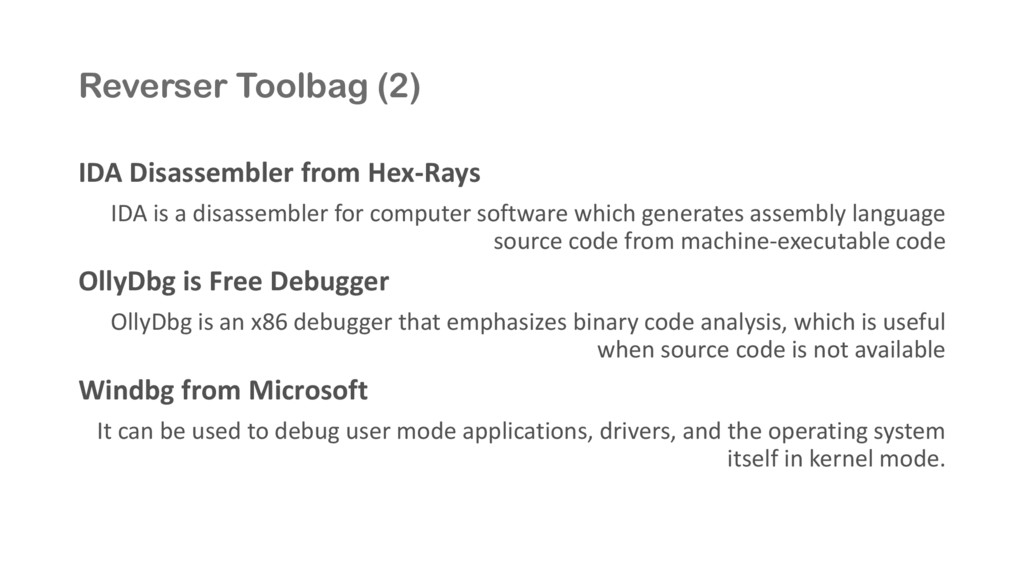
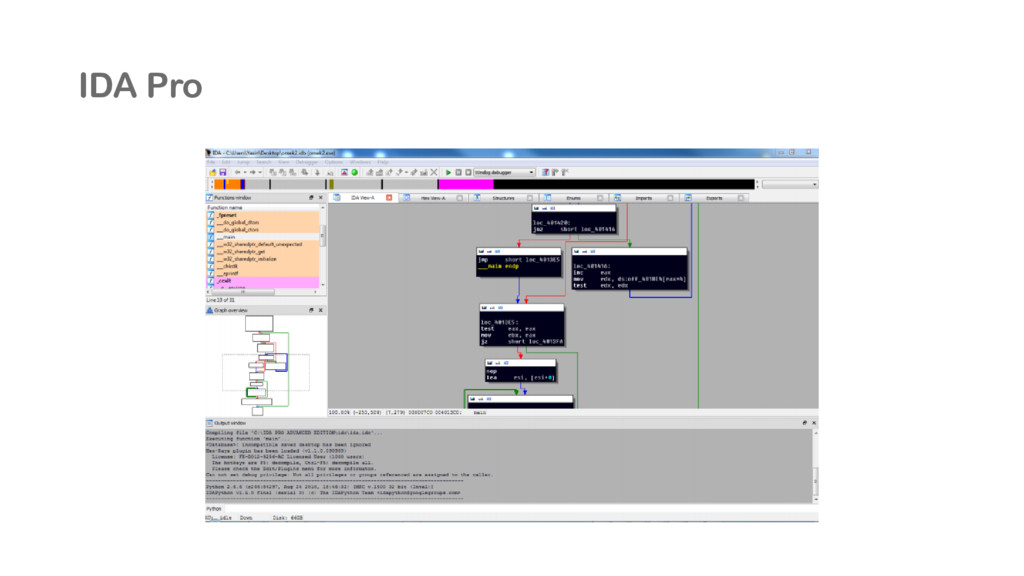
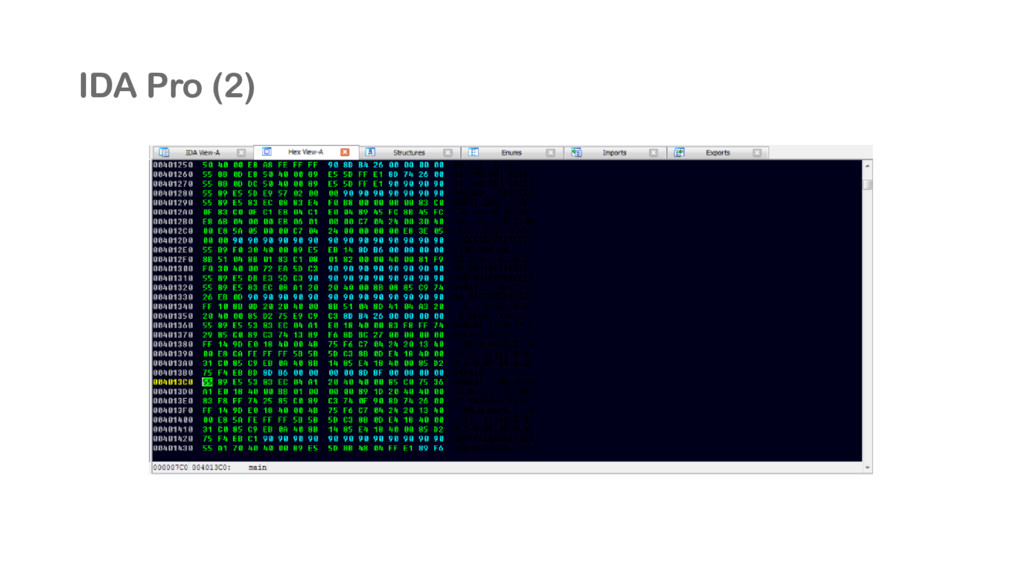
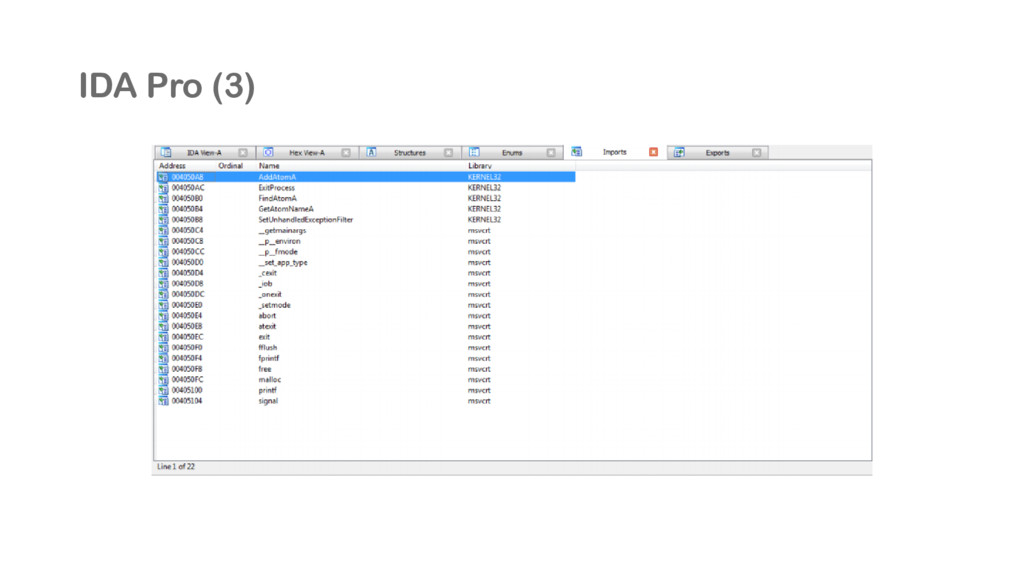
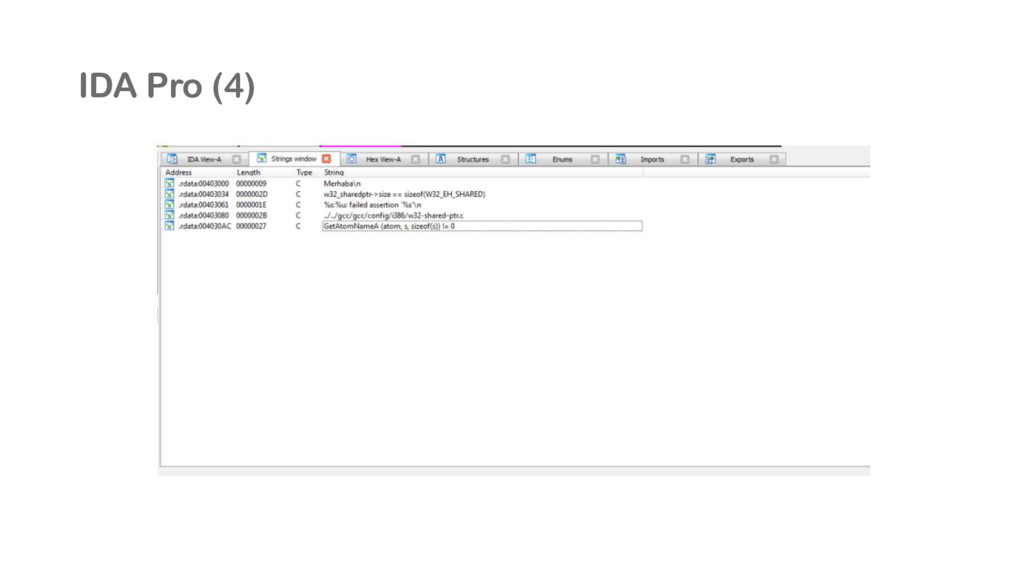
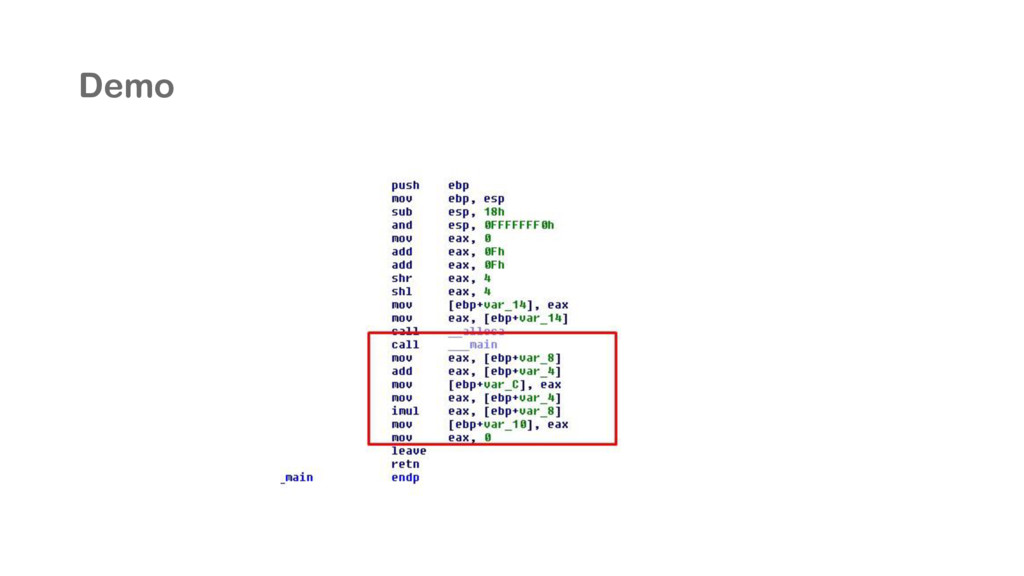
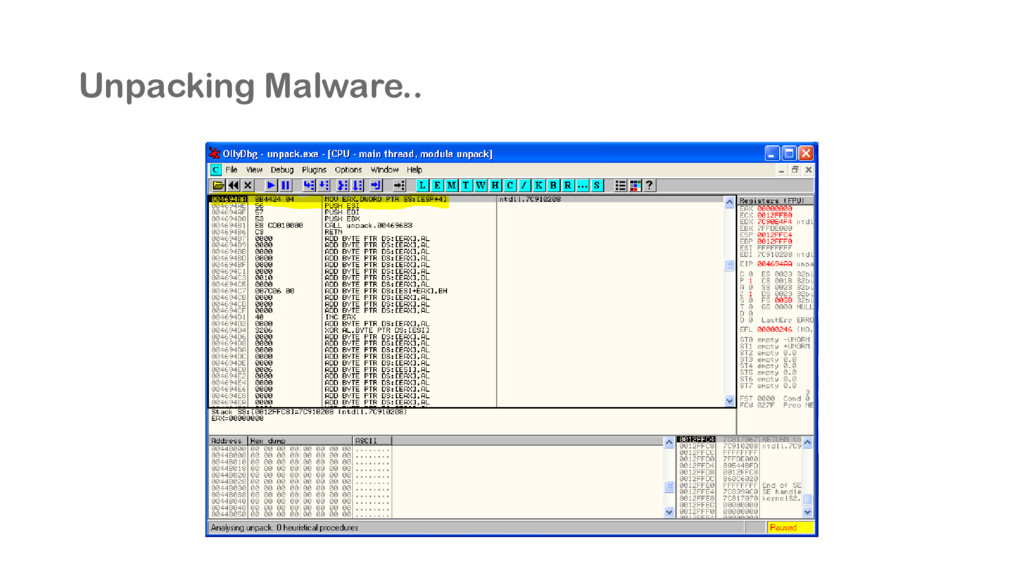
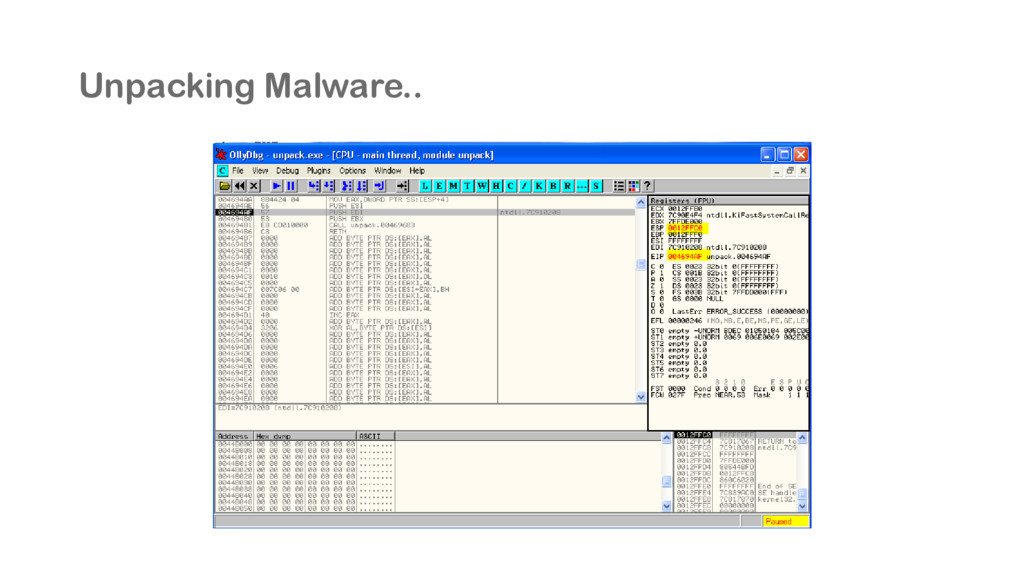
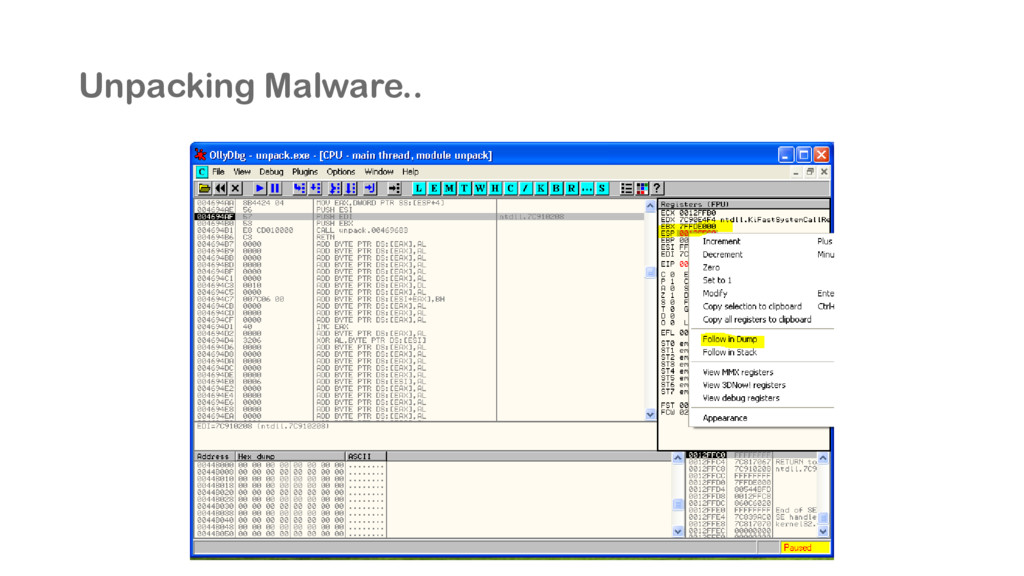
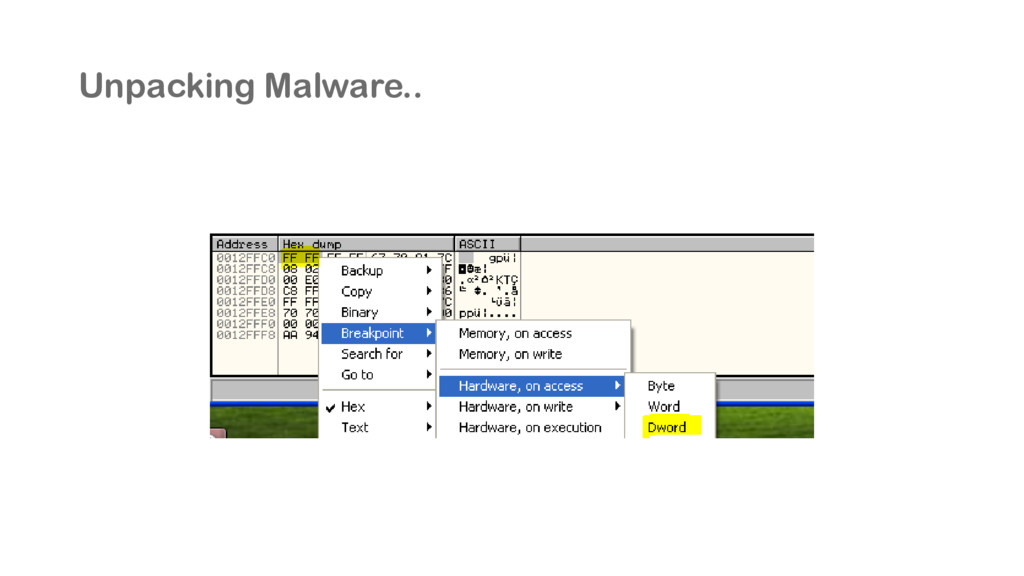
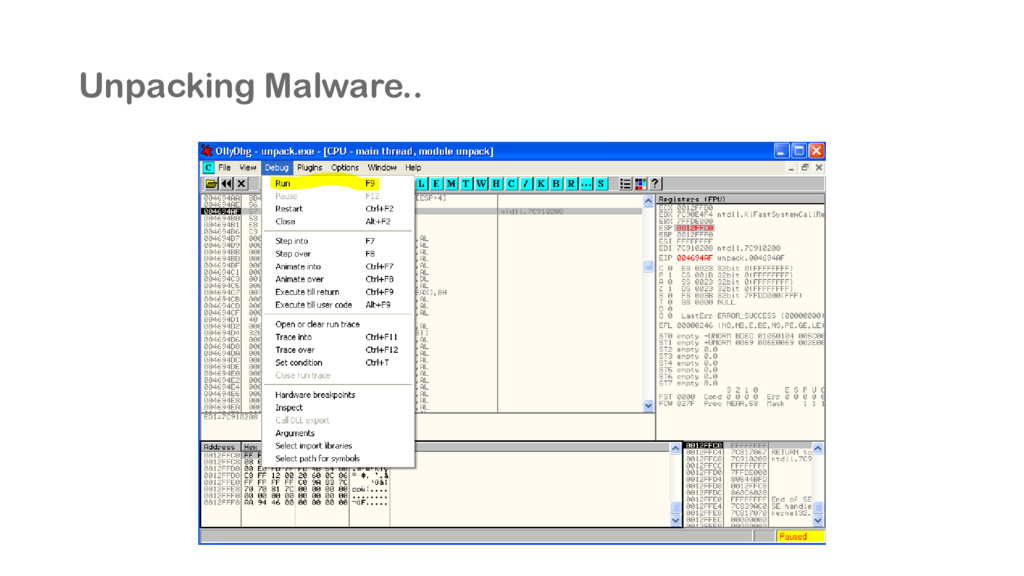
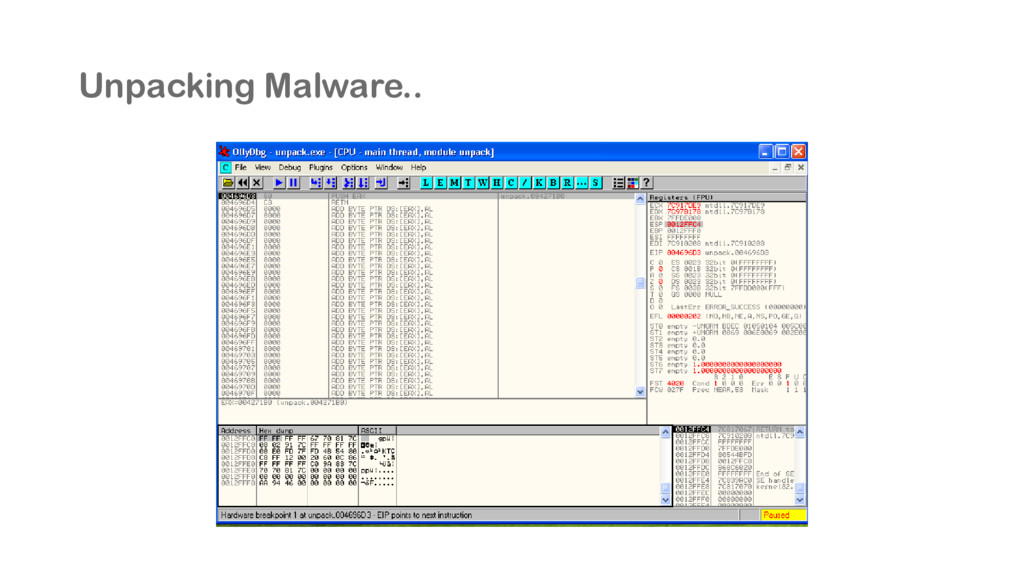
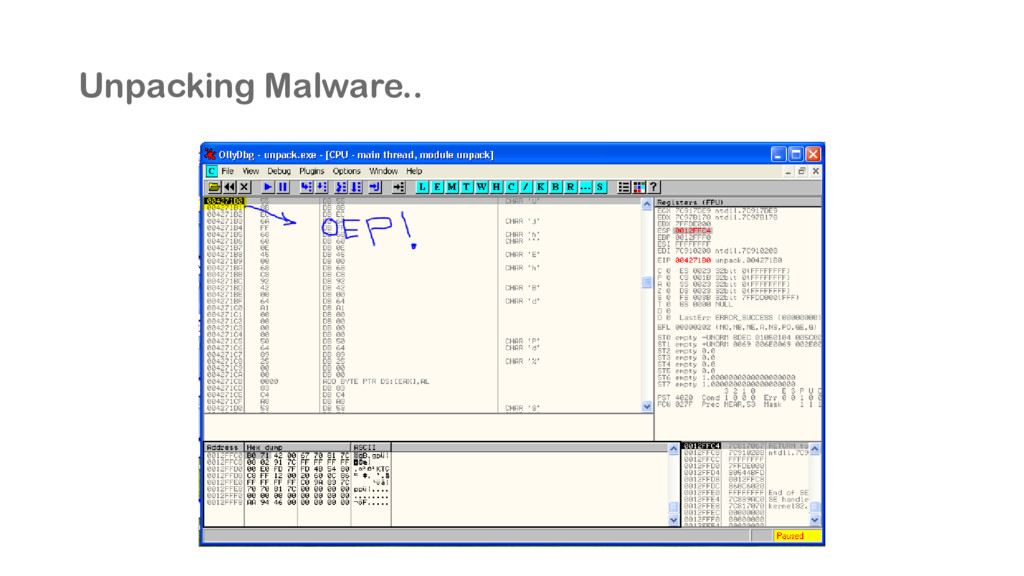
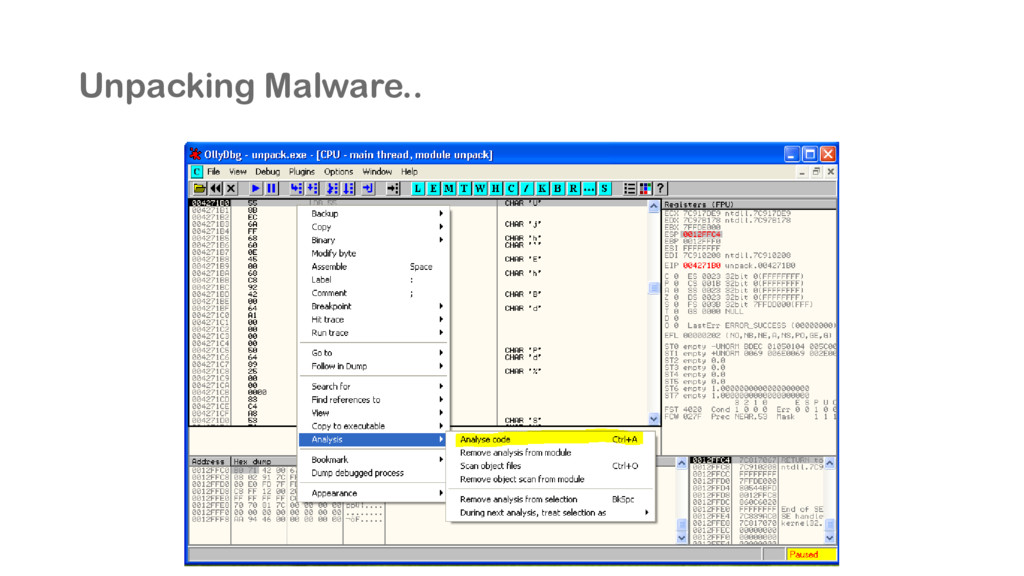
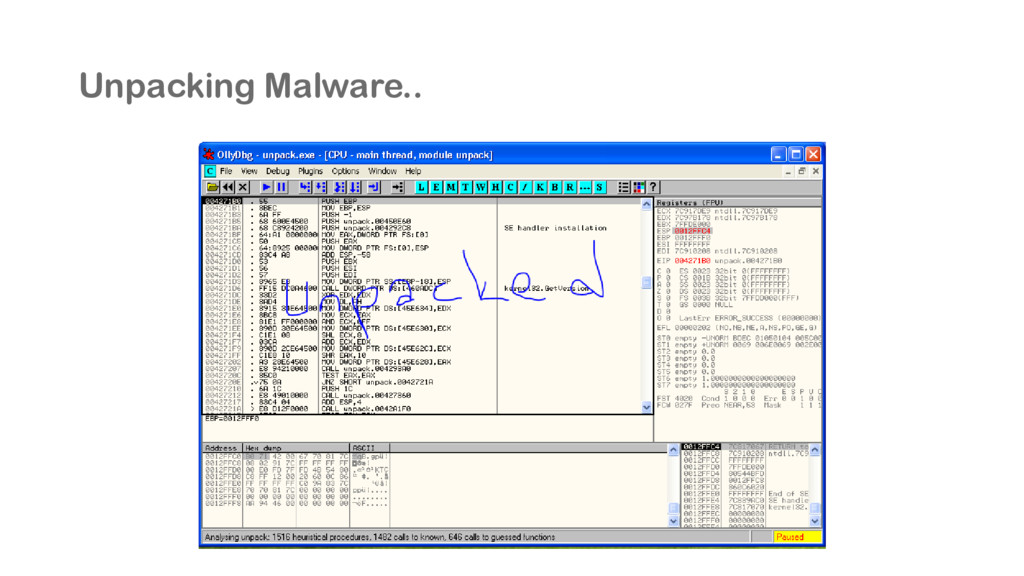
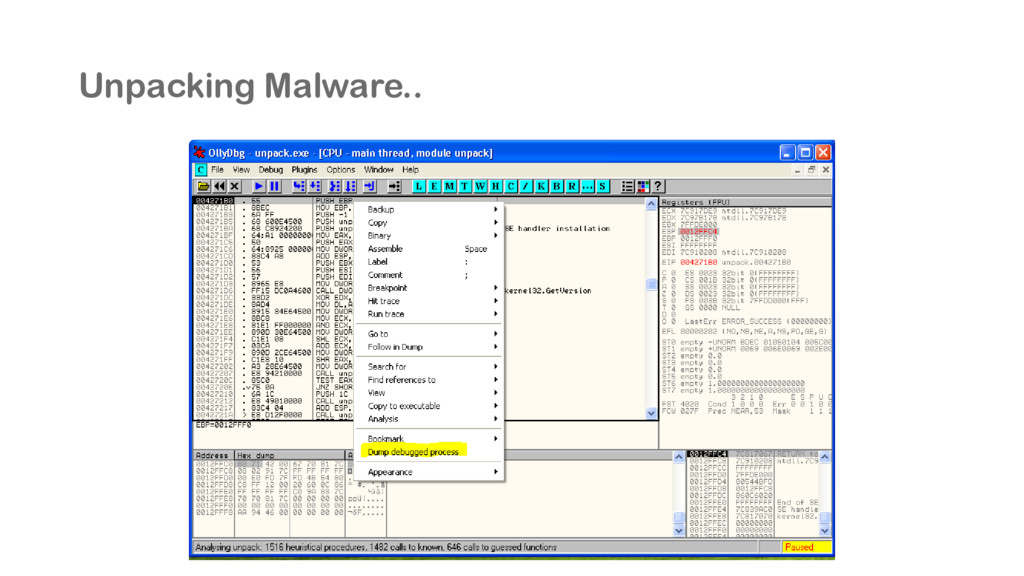
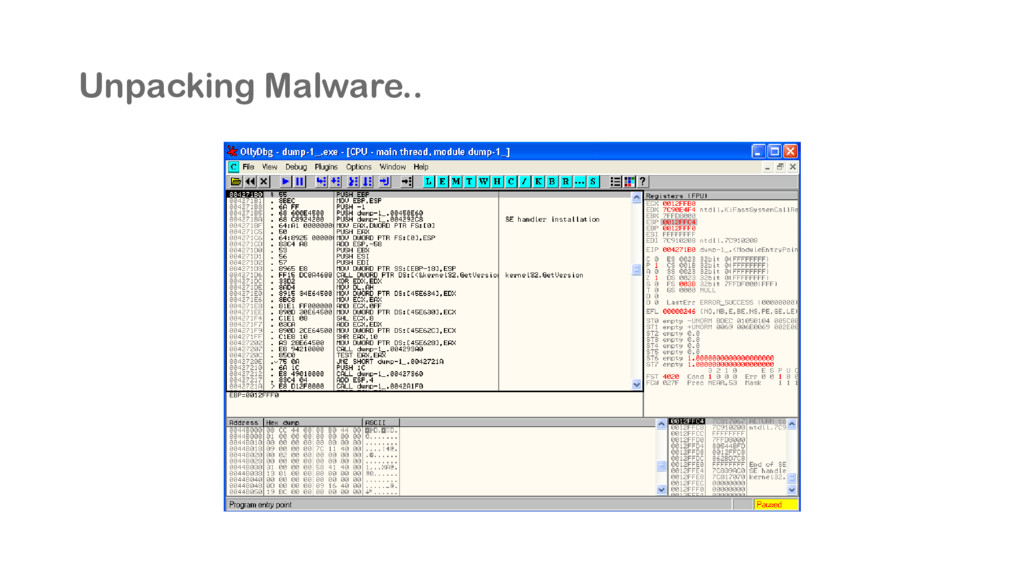
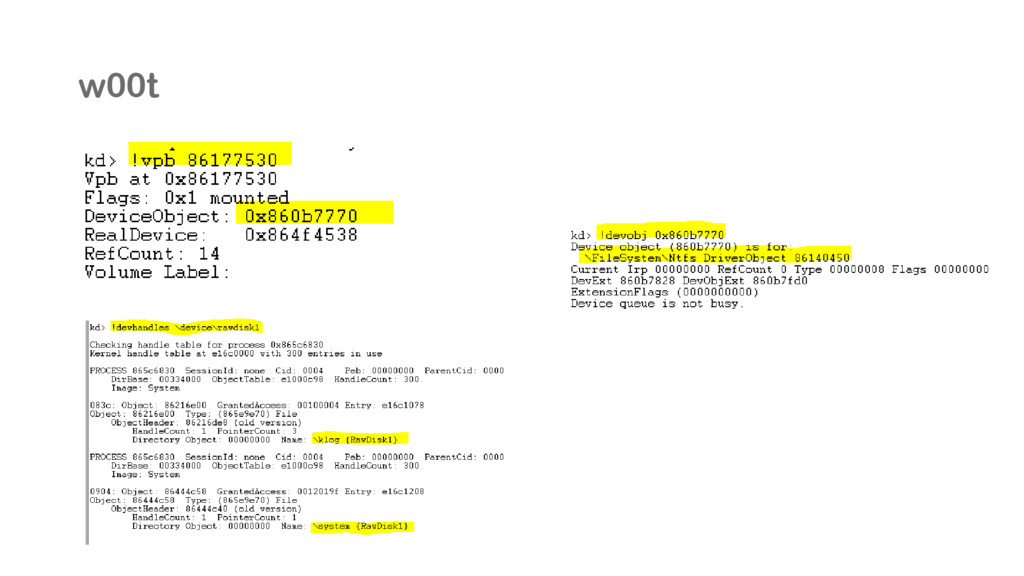
disassembler for computer software which generates assembly language source code from machine-executable code OllyDbg is Free Debugger OllyDbg is an x86 debugger that emphasizes binary code analysis, which is useful when source code is not available Windbg from Microsoft It can be used to debug user mode applications, drivers, and the operating system itself in kernel mode.
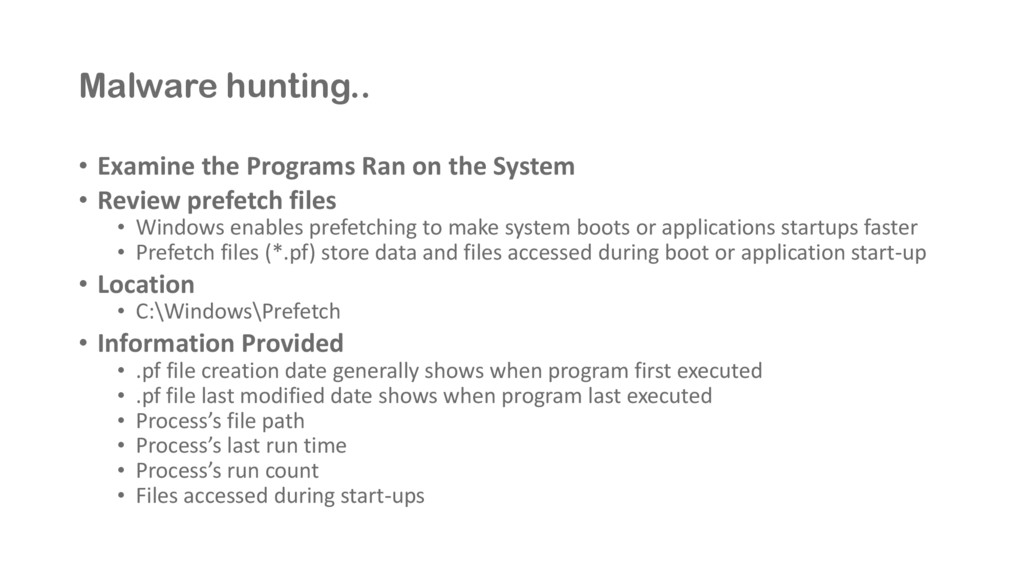
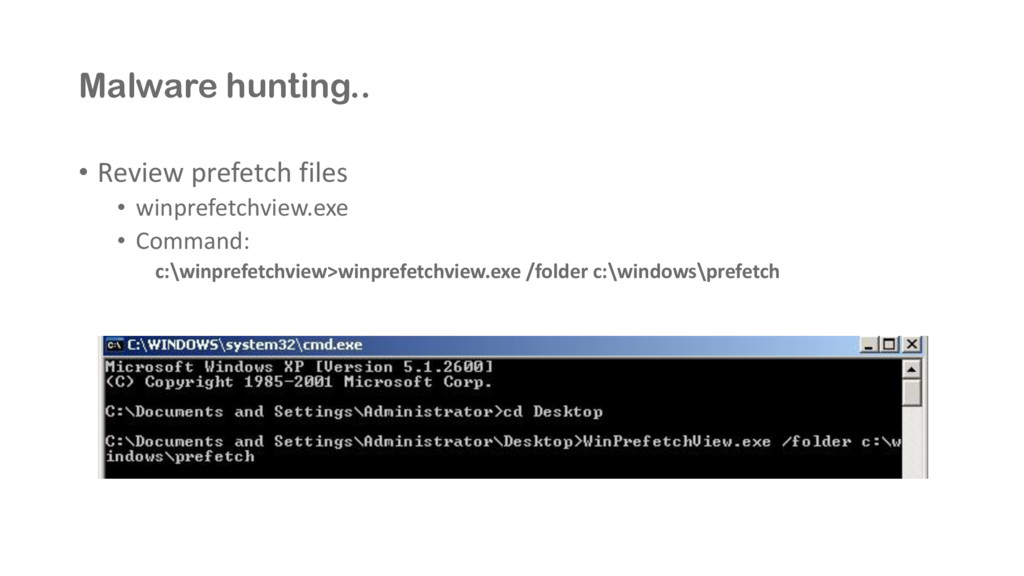
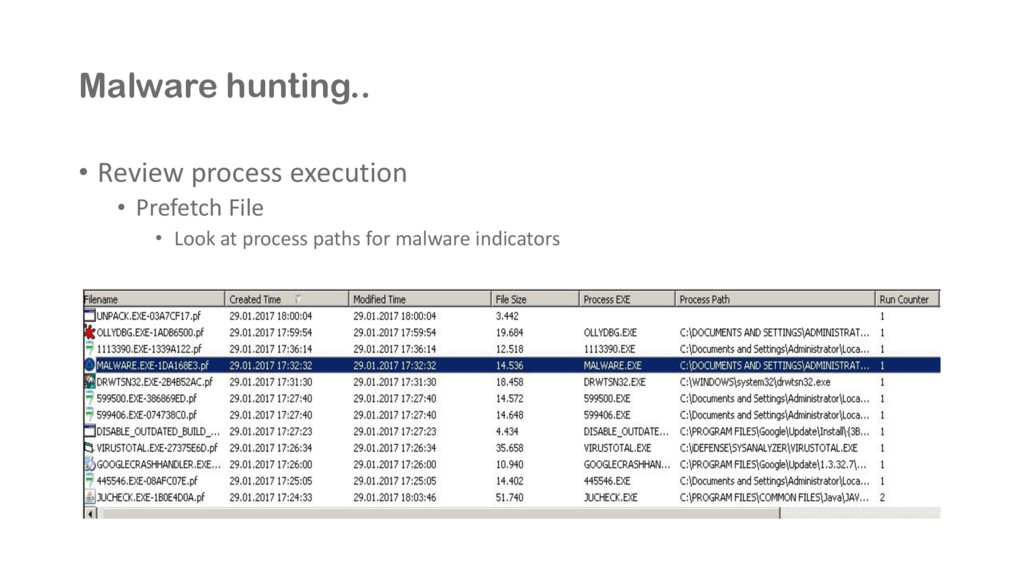
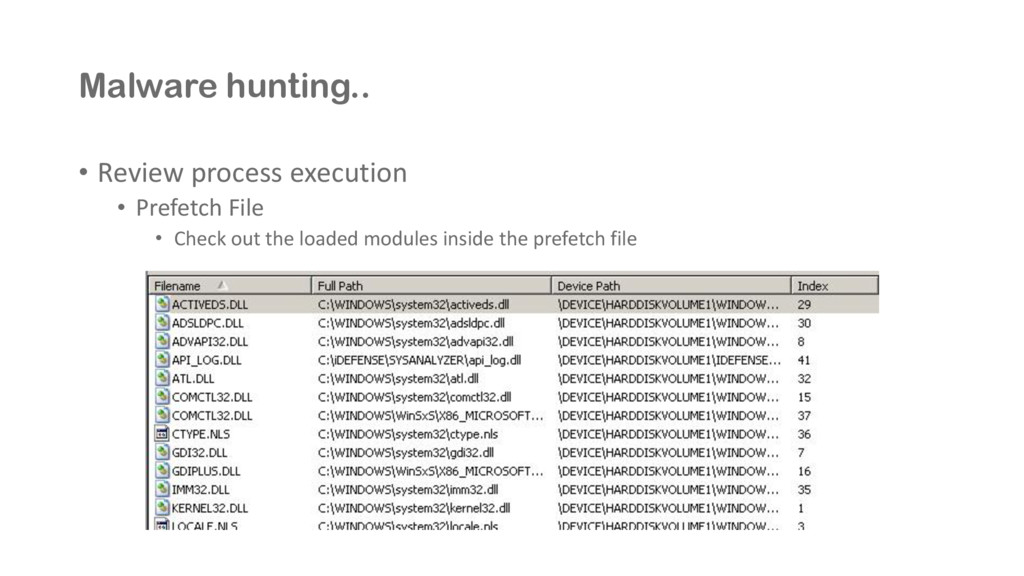
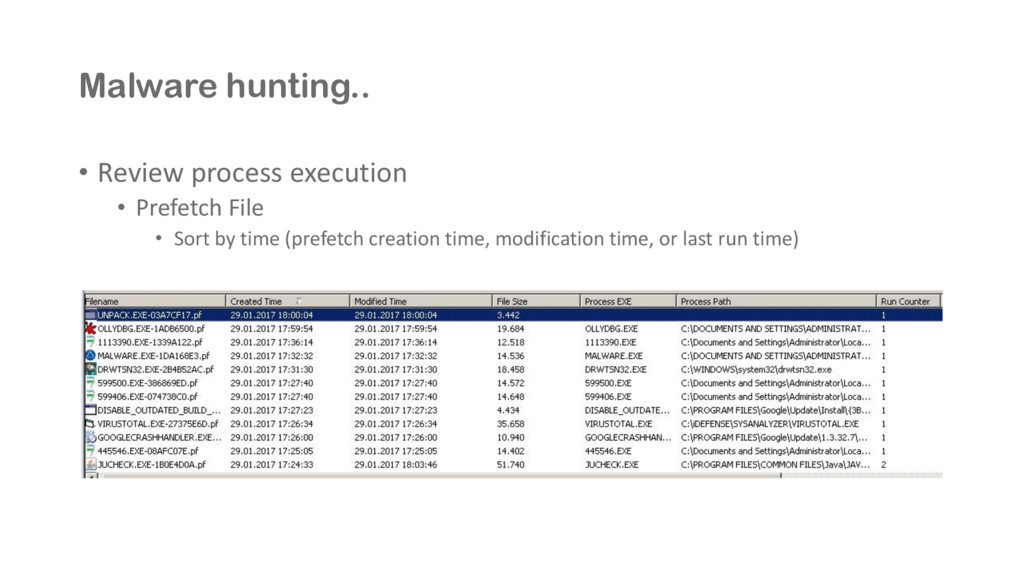
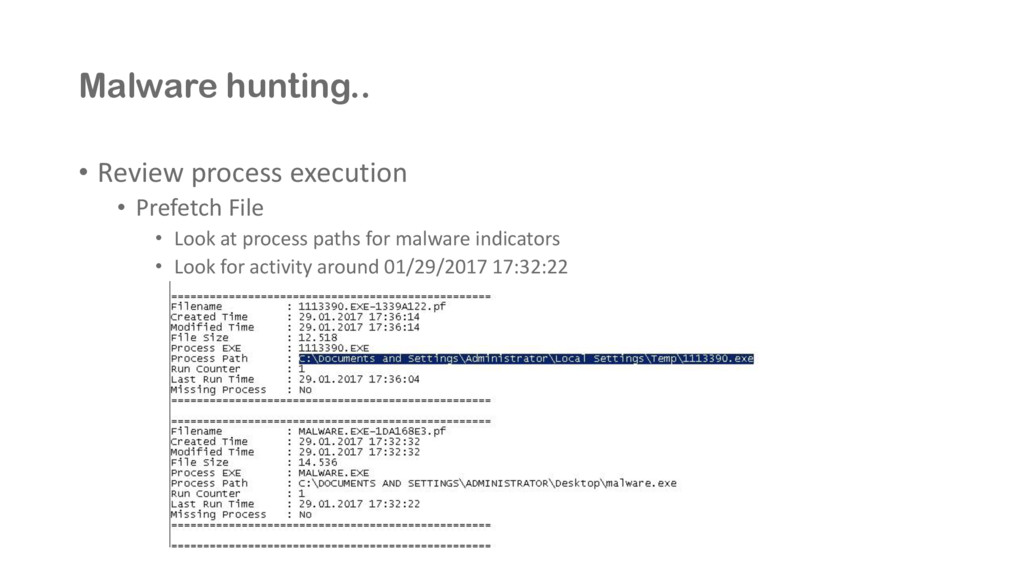
• Review prefetch files • Windows enables prefetching to make system boots or applications startups faster • Prefetch files (*.pf) store data and files accessed during boot or application start-up • Location • C:\Windows\Prefetch • Information Provided • .pf file creation date generally shows when program first executed • .pf file last modified date shows when program last executed • Process’s file path • Process’s last run time • Process’s run count • Files accessed during start-ups
Zip archive was downloaded from the Internet and a program inside it was exected • What was taken? • i.e. Have malware samples to look into and research • Were we targeted or was it a random attack? • Random attack or Targeted Attack? • What can be done to reduce future occurrences • Security Awareness! • Block all unsigned executables!
we know. There are known unknowns. That is to say, there are things that we know we don't know. But there are also unknown unknowns. There are things we don't know we don't know. - Donald Rumsfeld
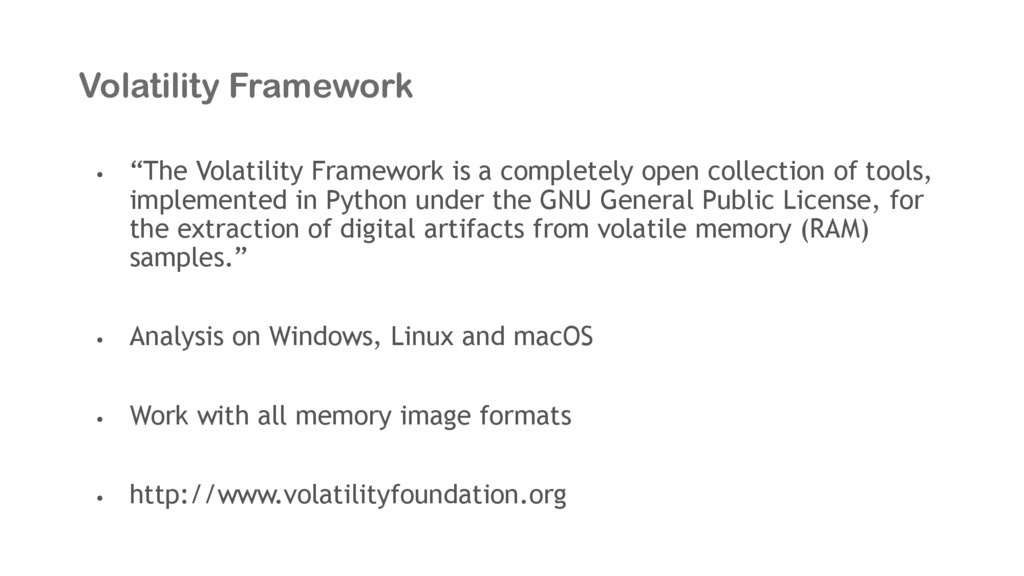
collection of tools, implemented in Python under the GNU General Public License, for the extraction of digital artifacts from volatile memory (RAM) samples.” • Analysis on Windows, Linux and macOS • Work with all memory image formats • http://www.volatilityfoundation.org
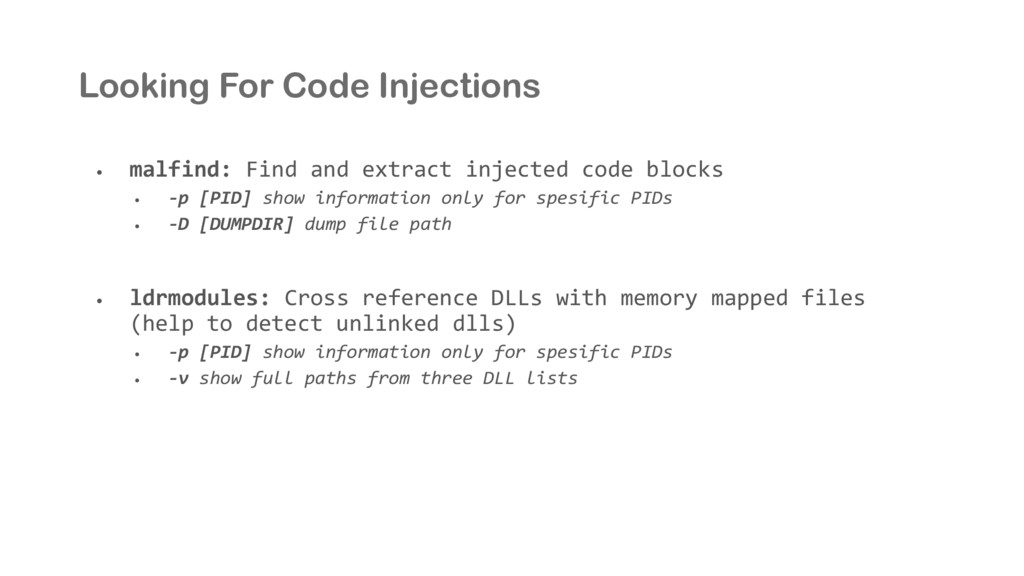
code blocks • -p [PID] show information only for spesific PIDs • -D [DUMPDIR] dump file path • ldrmodules: Cross reference DLLs with memory mapped files (help to detect unlinked dlls) • -p [PID] show information only for spesific PIDs • -v show full paths from three DLL lists
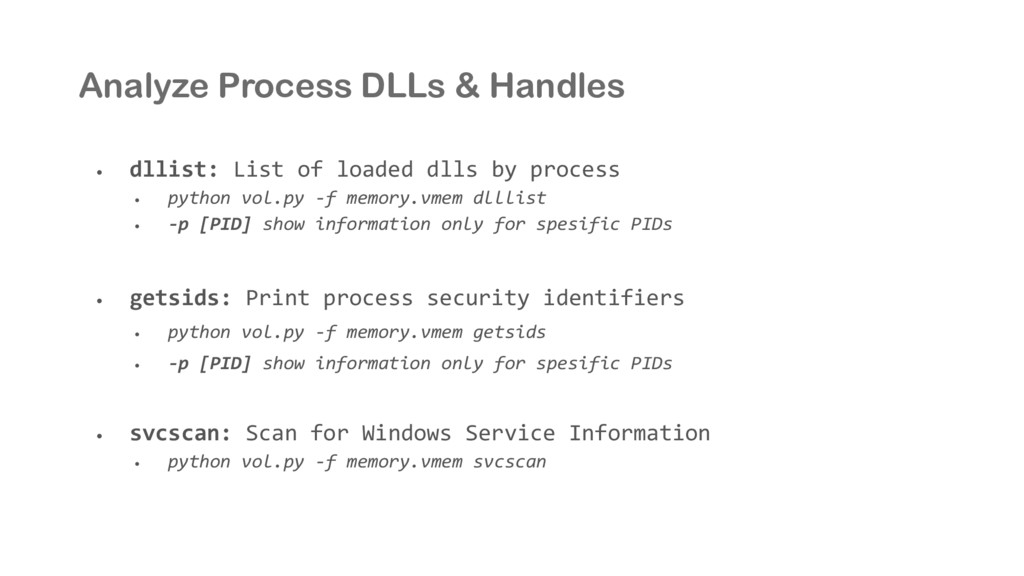
dlls by process • python vol.py -f memory.vmem dlllist • -p [PID] show information only for spesific PIDs • getsids: Print process security identifiers • python vol.py -f memory.vmem getsids • -p [PID] show information only for spesific PIDs • svcscan: Scan for Windows Service Information • python vol.py -f memory.vmem svcscan
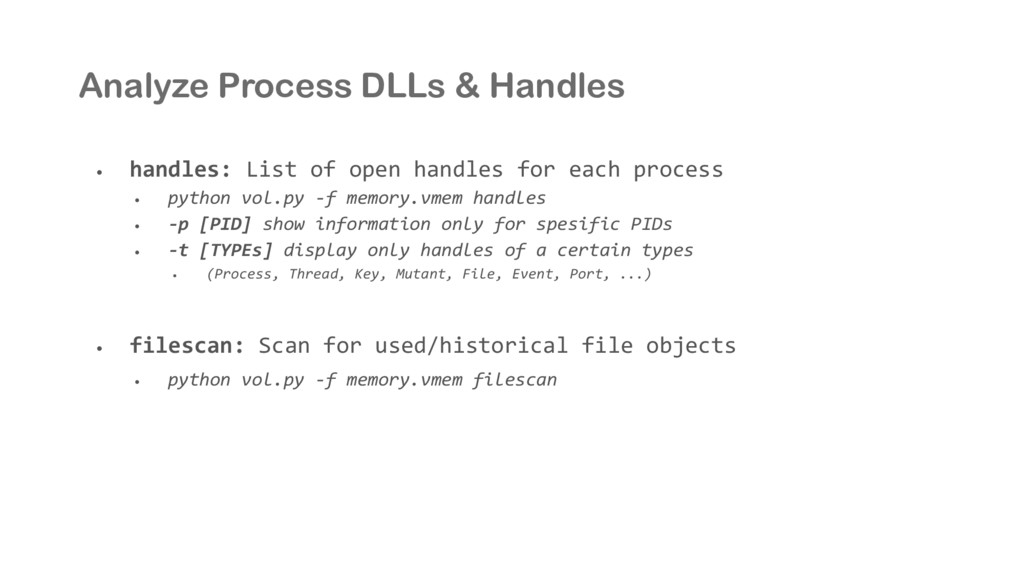
handles for each process • python vol.py -f memory.vmem handles • -p [PID] show information only for spesific PIDs • -t [TYPEs] display only handles of a certain types • (Process, Thread, Key, Mutant, File, Event, Port, ...) • filescan: Scan for used/historical file objects • python vol.py -f memory.vmem filescan
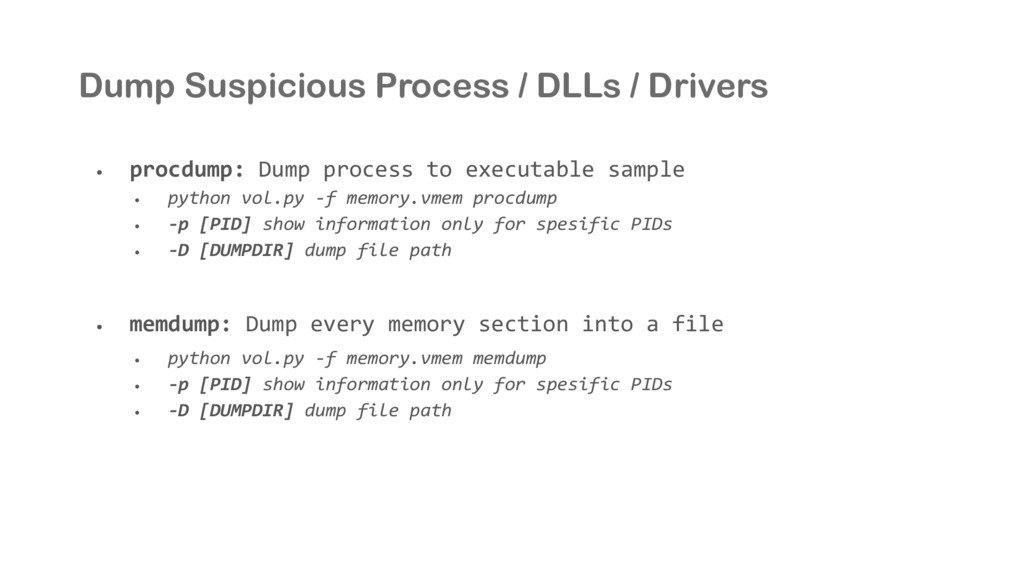
process to executable sample • python vol.py -f memory.vmem procdump • -p [PID] show information only for spesific PIDs • -D [DUMPDIR] dump file path • memdump: Dump every memory section into a file • python vol.py -f memory.vmem memdump • -p [PID] show information only for spesific PIDs • -D [DUMPDIR] dump file path
![Syntax • python vol.py -f [MEMORYFILE] [PLUGIN] --profile=[PROFILE] • python](https://files.speakerdeck.com/presentations/5017e82c37d9418fad5aa415460cc089/slide_119.jpg)