Upgrade to Pro — share decks privately, control downloads, hide ads and more …

How to Grow Subscribership in Your Utility Green Pricing Program: Lessons Learned From Top U.S. Programs

How to Grow Subscribership in Your Utility Green Pricing Program: Lessons Learned From Top U.S. Programs

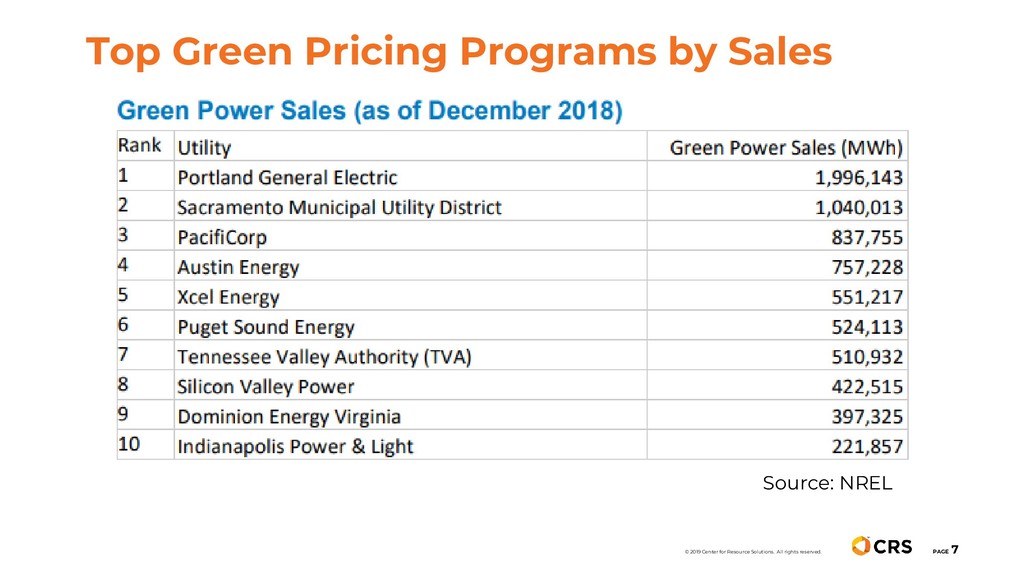
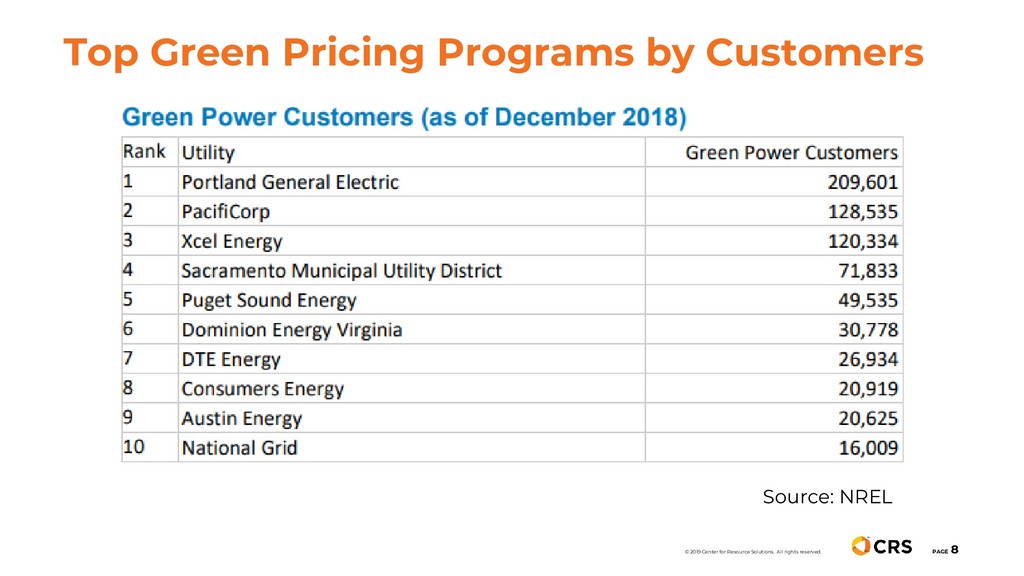
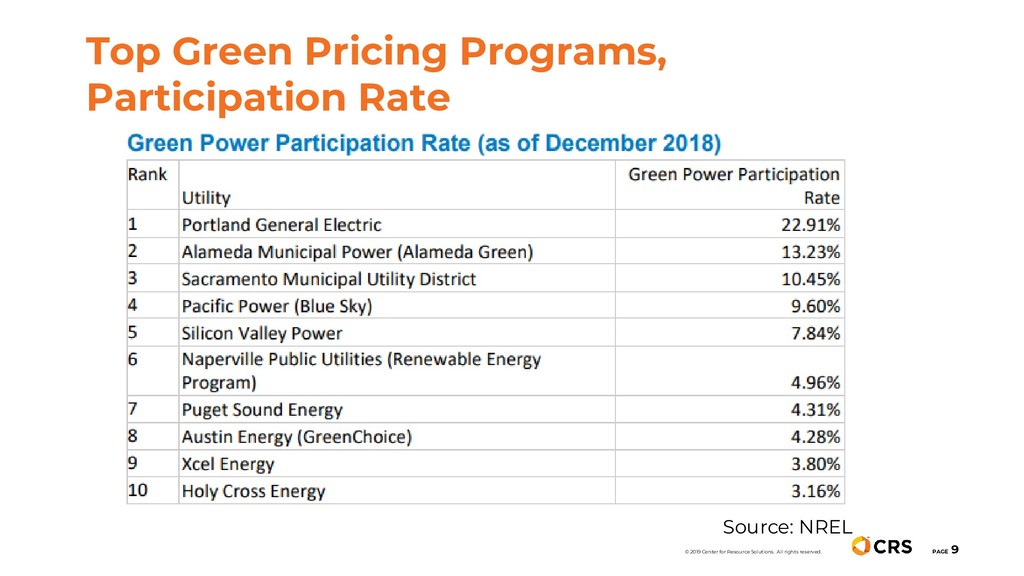
Data from the National Renewable Energy Laboratory show that the top four utility green pricing programs resulted in the lion’s share of 2018 residential and small business voluntary purchasing in the U.S. What are the specifics of program design, marketing and communications, and employee engagement that have driven renewable energy subscribership at those few utilities skyward (accounting for over 10% of eligible households in some locations)? Learn by example what it takes to grow the size and impact of your green power programs.

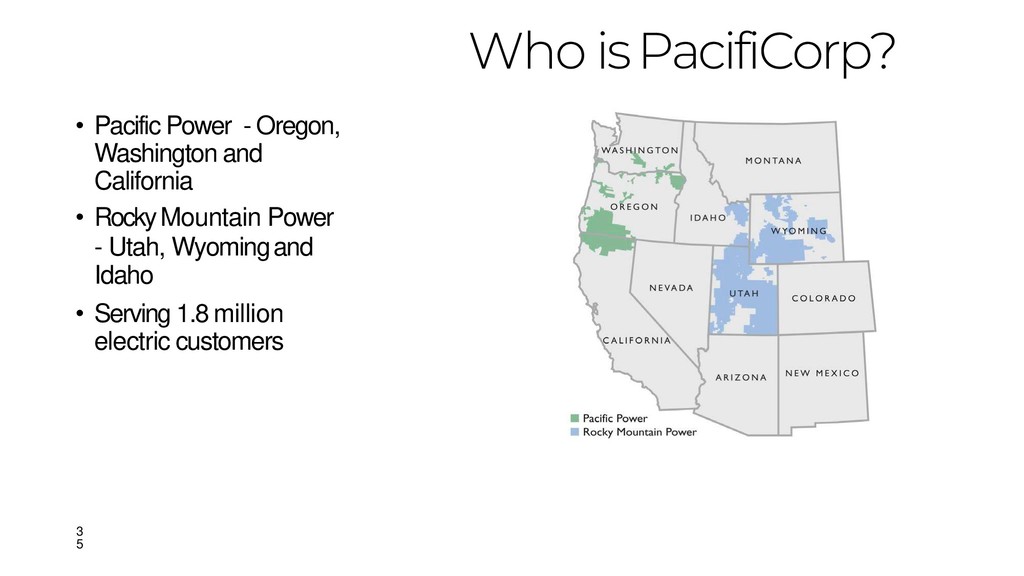
Panelists: Rachael Terada, CRS (Moderator), Josh Halley, Portland General Electric, Berit Kling, PacifiCorp, David McDougall, 3Degrees

Tweet

More Decks by Center for Resource Solutions

Other Decks in Business

Transcript

  1. Speakers RACHAEL TERADA- CRS DAVID MCDOUGALL - 3DEGREES JOSH HALLEY

    - PGE BERIT KLING - PACIFICORP PAGE 2 © 2019 Center for Resource Solutions. All rights reserved.
  2. Nongovernmental Organization (NGO) creating policy and market solutions to advance

    sustainable energy since 1997. • Expert assistance • Renewable energy and climate policy • Renewable Energy Markets annual conference • Green-e® certification for suppliers and users of renewable energy and carbon offsets in the voluntary market About Center for Resource Solutions PAGE 3 © 2019 Center for Resource Solutions. All rights reserved.
  3. Background Information UTILITY GREEN PRICING PROGRAM 101 PAGE 4 ©

    2019 Center for Resource Solutions. All rights reserved.
  4. What is a “green pricing program”? According to the EPA

    Green Power Partnership: • Offered by a customer’s default utility supplier • Electricity bundled with a Renewable Energy Certificate (REC) • Structured either in blocks of KWh or MWh, or sold as a percentage of use • RECs are usually “retired” by the utility on behalf of the customer in proportion to the amount of electricity purchased • Generally, subscription can be started or cancelled at any time • Often sourced from local or regional resources (required by Green-e®) • Green-e® also requires that emission rates per KWh for underlying electricity must be at or below the customer’s average utility emissions rate and may not include differentiated nuclear power (no nukes). Background Information PAGE 5 © 2019 Center for Resource Solutions. All rights reserved.
  5. Utility Green Pricing Programs in Green-e® FACTS, FIGURES, AND RESOURCES

    PAGE 6 © 2019 Center for Resource Solutions. All rights reserved.
  6. Top Green Pricing Programs by Sales PAGE 7 © 2019

    Center for Resource Solutions. All rights reserved. Source: NREL
  7. Top Green Pricing Programs by Customers PAGE 8 © 2019

    Center for Resource Solutions. All rights reserved. Source: NREL
  8. Top Green Pricing Programs, Participation Rate PAGE 9 © 2019

    Center for Resource Solutions. All rights reserved. Source: NREL
  9. Green-e® Energy Certified Sales of Green Pricing Programs, 1998 –

    2018 (In MWH) PAGE 10 © 2019 Center for Resource Solutions. All rights reserved.
  10. Retail Customers Purchasing Green-e® Energy Certified Green Pricing Programs, 1998

    – 2018(In MWH) PAGE 11 © 2019 Center for Resource Solutions. All rights reserved.
  11. PAGE 12 Utility green pricing programs certified by Green- e®

    Energy consistently make up the majority of NREL’s Top Ten rankings in terms of customer participation rate, total number of subscribers, total MWh sold, and green power sales as a percentage of total retail electricity sales. Green-e® Energy Certified Sales in Green Pricing Programs by Customer Type © 2019 Center for Resource Solutions. All rights reserved.
  12. A thriving program will have: • Resource types and locations

    valued by customers • Relatively new generators providing supply (Green-e® Energy New Date) • Support from utility staff • A clear strategy on program implementation and easy to explain plan for covering costs Factors that Influence Success PAGE 13 © 2019 Center for Resource Solutions. All rights reserved.
  13. Upcoming Events. www.resource-solutions.org/events 11/20 – RY2018 Green-e® Verification Report Webinar

    PAGE 14 © 2019 Center for Resource Solutions. All rights reserved.
  14. © 2019 Center for Resource Solutions. All rights reserved. Contact.

    Rachael Terada DIRECTOR TECHNICAL PROJECTS [email protected] 415.561.2135 www.resource-solutions.org
  15. 16

  16. NREL TOP 10 UTILITY PARTNERS PacifiCorp Puget Sound Energy Portland

    General Electric Dominion Energy Virginia Tennessee Valley Authority Silicon Valley Power ABOUT 3DEGREES GREEN TARIFFS RENEWABLE ENERGY CERTIFICATES (RECS) CARBON OFFSETS COMMUNITY SOLAR GREEN POWER PROGRAMS RENEWABLE NATURAL GAS
  17. Why grow your Green Power Program? CRS WEBINAR | 3DEGREES

    + Huge opportunity for utilities + Address climate change/ decarbonize + Meet customers’ needs + Prevent attrition + New engagement channel
  18. Best Practices: Program Design CRS WEBINAR | 3DEGREES + Start

    with a great design + Customer research/insights + Supply strategy + Stakeholder engagement + Pricing + Marketing investment
  19. KNOW YOUR AUDIENCE Identify top prospects, understand their motivations/ needs.

    Raise awareness and educate customers. INCREASE AWARENESS ENROLL ENGAGE OPTIMIZE Provide ample opportunities for customers to enroll. Keep customers informed and excited about the program. Test messaging, test segments, test conversion paths. Test everything. Measure results and refine plans. Marketing and Implementation Strategy CRS WEBINAR | 3DEGREES
  20. Best Practices: Marketing and Outreach CRS WEBINAR | 3DEGREES +

    Multi-channel engagement is critical to program success + “Build it, SELL it, and they will come” + Meet customers where they are... + Existing utility channels (lower cost) + Digital platforms + In-person outreach + …..and deliver the right message + Well-funded programs can afford a diverse set of tactics
  21. Green Future at a Glance • Established in 1999 •

    More than 225,000 (25%) of customers enrolled • Sourced regionally • Ranked #1 in US for • Total customers (10 years) • Total MWh Sold • % of customers enrolled • Sales Rate 25 | Confidential and Proprietary
  22. 26 | Confidential and Proprietary Product Content Price Customers Green

    Source Matches 100% of customer's monthly usage with RECs 70% Wind, 24% Solar,4% Biomass, 1% Geothermal, 1% Low Impact Hydro OR, WA, ID, MT, UT 0.8 Cents/kWh 199,013 Clean Wind Block Customers purchase blocks of 100% wind power for fixed amount/month, includes a fixed contribution to RDF. 100% Wind OR, WA, ID, MT, UT $2.50/200 kWh block 7,620 Green Future Solar Customers purchase RECs produced by 1kW blocks of local solar facility 100% Solar OR, in service territory $5.00/1kW block 2,760 Habitat Support Customers fund Oregon-sited fish habitat restoration projects with a focus on rivers and streams in PGE service territory and on which PGE has operations. 350 miles restored to date. $2.50/month 10,878 Renewable Development Fund Green Future customer funds for purpose of granting out to qualified renewable energy development projects in PGE service territory via competitive annual RFP process. 58 projects, $13M, 12.8MW installed
  23. 27 | Confidential and Proprietary Customer Growth 69,110 72,663 77,751

    80,058 87,841 99,660 106,477 126,389 147,962 170,747 205,016 40,000 60,000 80,000 100,000 120,000 140,000 160,000 180,000 200,000 220,000 2008 2009 2010 2011 2012 2013 2014 2015 2016 2017 2018
  24. Channels of Engagement 28 | Confidential and Proprietary Call Center

    Web Face to Face Storefronts ▪ 75+ StorefrontPartners ▪ Distributed across entire PGE service territory Events ▪ 225+ Events annually ▪ Range in size from small farmers markets to large trade shows Courtesy Knock Program ▪ Highest performing channel ▪ Allows greater reach ▪ Can generate customer feedback & inquiries
  25. Enrollments By Channel 29 | Confidential and Proprietary 0 5,000

    10,000 15,000 20,000 25,000 30,000 35,000 2011 2012 2013 2014 2015 2016 2017 2018 Store Front / Events Courtesy Knock TCC Web Sch. 32 Clean Wind
  26. Fostering Community Regular communication with our Green future community helps

    to reinforce their role in our vision for a decarbonized future • Welcome letter packet (PCL) • Annual Coupon Book • Window decals • Personalized annual CO2 report • Website
  27. Business Customers Products: ▪ Clean Wind – Wind RECs ▪

    Green Tariff – local, bundled, additional Different Values, Price sensitive, Green-e matters Municipalities 31 | Confidential and Proprietary
  28. Lessons Learned • In-person engagement is worth it • Accessibility:

    price • Local, local, local • Residential vs. Business • Synergies & Differences • Cross Promotion • Green-e 32 | Confident ial and Proprieta ry
  29. • Pacific Power - Oregon, Washington and California • Rocky

    Mountain Power - Utah, Wyomingand Idaho • Serving 1.8million electric customers Who isPacifiCorp? 3 5
  30. • Launched in 2000 • More than 130,000participants or ~7%

    of our customers systemwide • More than a dozen communities have participation rates above20% • Helped fund more than 300community- based projects since 2006 • Supported more than 8billion megawatt-hours of renewableenergy • Ranked on the NREL top ten list for 17 years Blue Sky Renewable Energy 3 6
  31. Program Growth Continues - 200,000 400,000 600,000 800,000 2000 2001

    2002 2003 2004 2005 2006 2007 2008 2009 2010 2011 2012 2013 2014 2015 2016 2017 2018 0 40,000 80,000 120,000 160,000 MWhs Participants MWh Supported Participants 3 7
  32. Bill inserts,1% 3 8 Outreach,36% NewConnects, 38% Direct Mail/Email,3% Advertising,

    Web, Misc.,12% CourtesyCalls, 10% Finding the RightTactics • 86% enroll through person-to- person channels • Courtesy Calls (outbound calls) • Outreach (courtesy knock andevents & tabling • New connects (inbound calls to utility customer carecenter)
  33. • Leverage low-cost utility channels • Utilize high touch(people-to-people) channels

    • Connect at a local level (even acrossa diverse service area) • Test and iterate to find the best, sometimes evolving, mix of marketing tactics 3 9 Finding the RightTactics
  34. Case Study: Oregon Coast Program participants along the coast have

    grown at 184% the rateas the rest of the state thanks to focusedefforts: • County-wide CommunityChallenge (Clatsop Co) • Residential + Commercial“Power Teams” • Targetedoutbound calling campaigns • Targeted Direct Mail 4 0
  35. Case Study: Customer Care Center (Inbound Calls) • New Hire

    & refresher classtrainings • Monthly communications (visibility) • Prizes and incentives designed to motivate staff • Job aids and intranet resources • Integrate program prompt on callingscreens • Ease of technical enrollment process • Manager engagement (expectation setting, support) 4 2