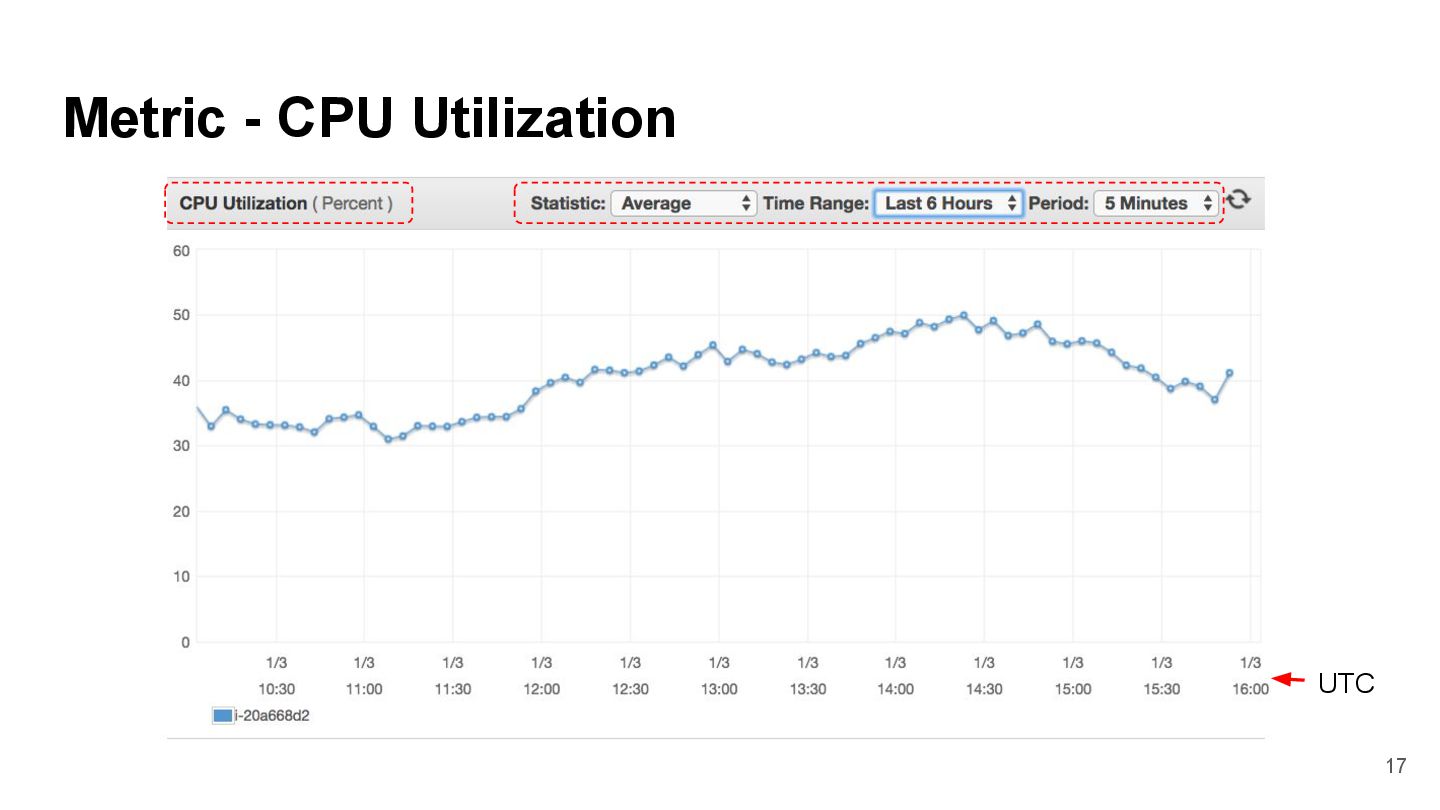
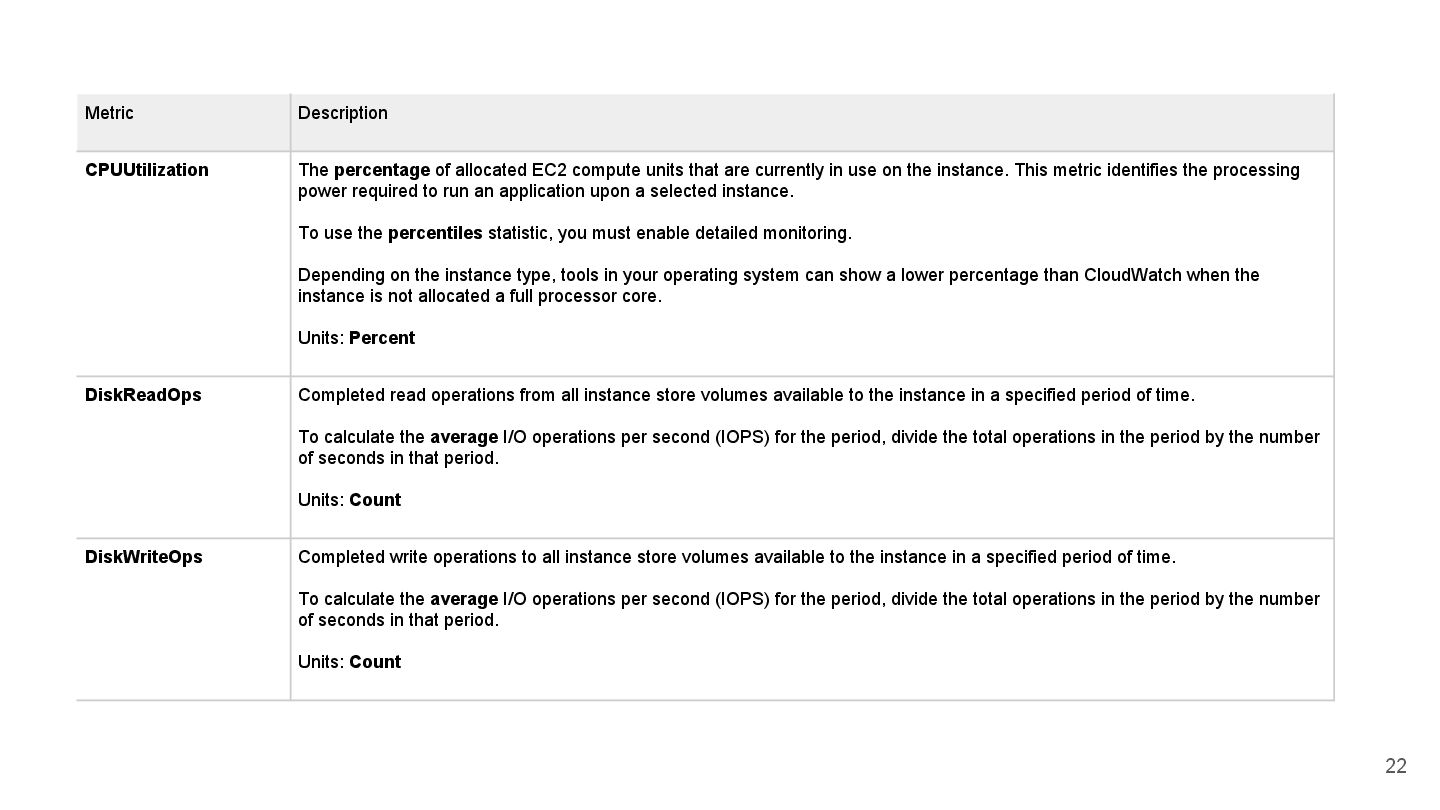
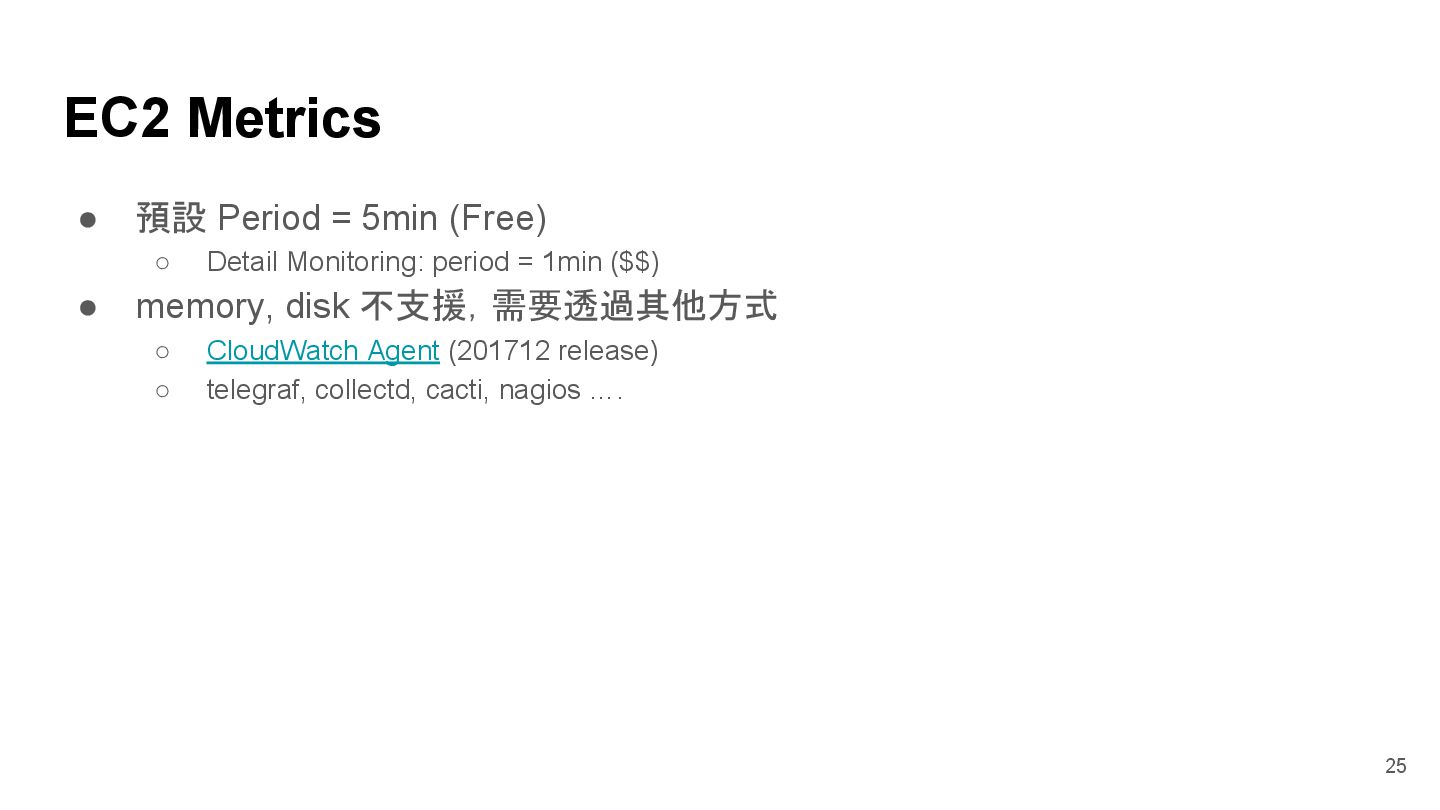
units that are currently in use on the instance. This metric identifies the processing power required to run an application upon a selected instance. To use the percentiles statistic, you must enable detailed monitoring. Depending on the instance type, tools in your operating system can show a lower percentage than CloudWatch when the instance is not allocated a full processor core. Units: Percent DiskReadOps Completed read operations from all instance store volumes available to the instance in a specified period of time. To calculate the average I/O operations per second (IOPS) for the period, divide the total operations in the period by the number of seconds in that period. Units: Count DiskWriteOps Completed write operations to all instance store volumes available to the instance in a specified period of time. To calculate the average I/O operations per second (IOPS) for the period, divide the total operations in the period by the number of seconds in that period. Units: Count
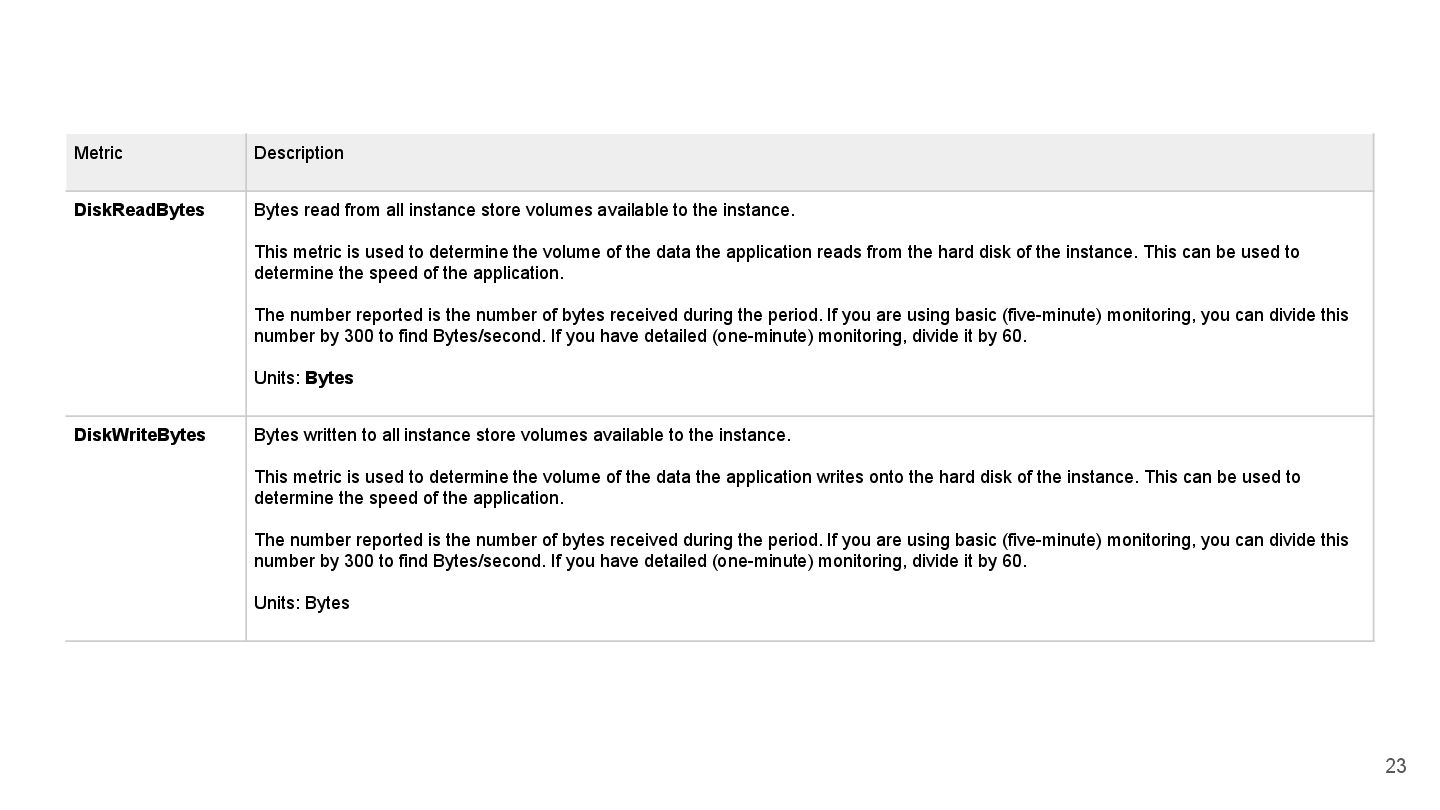
volumes available to the instance. This metric is used to determine the volume of the data the application reads from the hard disk of the instance. This can be used to determine the speed of the application. The number reported is the number of bytes received during the period. If you are using basic (five-minute) monitoring, you can divide this number by 300 to find Bytes/second. If you have detailed (one-minute) monitoring, divide it by 60. Units: Bytes DiskWriteBytes Bytes written to all instance store volumes available to the instance. This metric is used to determine the volume of the data the application writes onto the hard disk of the instance. This can be used to determine the speed of the application. The number reported is the number of bytes received during the period. If you are using basic (five-minute) monitoring, you can divide this number by 300 to find Bytes/second. If you have detailed (one-minute) monitoring, divide it by 60. Units: Bytes
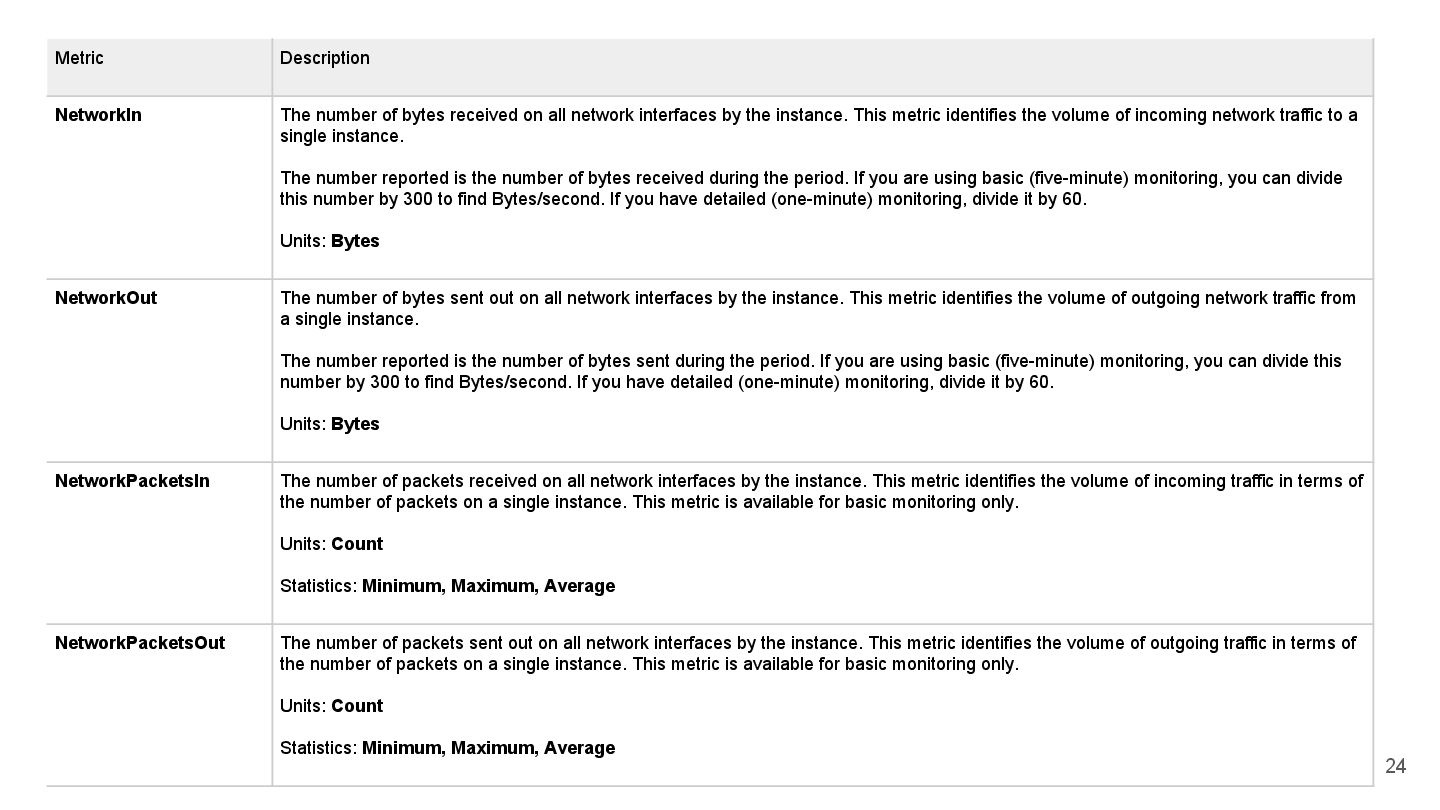
all network interfaces by the instance. This metric identifies the volume of incoming network traffic to a single instance. The number reported is the number of bytes received during the period. If you are using basic (five-minute) monitoring, you can divide this number by 300 to find Bytes/second. If you have detailed (one-minute) monitoring, divide it by 60. Units: Bytes NetworkOut The number of bytes sent out on all network interfaces by the instance. This metric identifies the volume of outgoing network traffic from a single instance. The number reported is the number of bytes sent during the period. If you are using basic (five-minute) monitoring, you can divide this number by 300 to find Bytes/second. If you have detailed (one-minute) monitoring, divide it by 60. Units: Bytes NetworkPacketsIn The number of packets received on all network interfaces by the instance. This metric identifies the volume of incoming traffic in terms of the number of packets on a single instance. This metric is available for basic monitoring only. Units: Count Statistics: Minimum, Maximum, Average NetworkPacketsOut The number of packets sent out on all network interfaces by the instance. This metric identifies the volume of outgoing traffic in terms of the number of packets on a single instance. This metric is available for basic monitoring only. Units: Count Statistics: Minimum, Maximum, Average
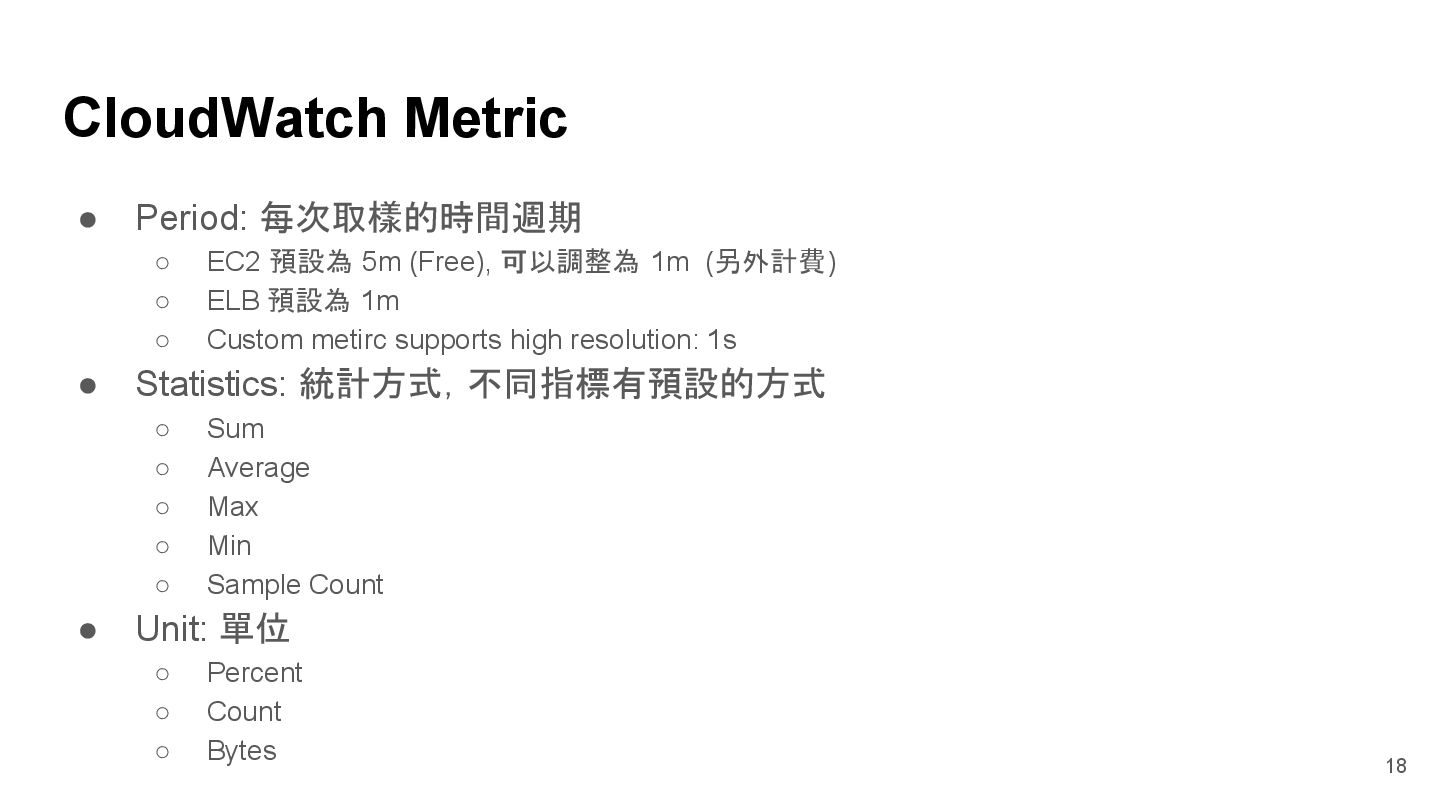
in seconds, from the time the load balancer sent the request to a registered instance until the instance started to send the response headers. [TCP listener] The total time elapsed, in seconds, for the load balancer to successfully establish a connection to a registered instance. Reporting criteria: There is a nonzero value Statistics: The most useful statistic is Average. Use Maximum to determine whether some requests are taking substantially longer than the average. Note that Minimum is typically not useful. Example: Suppose that your load balancer has 2 instances in us-west-2a and 2 instances in us-west-2b, and that requests sent to 1 instance in us-west-2a have a higher latency. The average for us-west-2a has a higher value than the average for us-west-2b. RequestCount The number of requests completed or connections made during the specified interval (1 or 5 minutes). [HTTP listener] The number of requests received and routed, including HTTP error responses from the registered instances. [TCP listener] The number of connections made to the registered instances. Reporting criteria: There is a nonzero value Statistics: The most useful statistic is Sum. Note that Minimum, Maximum, and Average all return 1. Example: Suppose that your load balancer has 2 instances in us-west-2a and 2 instances in us-west-2b, and that 100 requests are sent to the load balancer. There are 60 requests sent to us-west-2a, with each instance receiving 30 requests, and 40 requests sent to us-west-2b, with each instance receiving 20 requests. With the AvailabilityZone dimension, there is a sum of 60 requests in us-west-2a and 40 requests in us-west-2b. With the LoadBalancerName dimension, there is a sum of 100 requests.
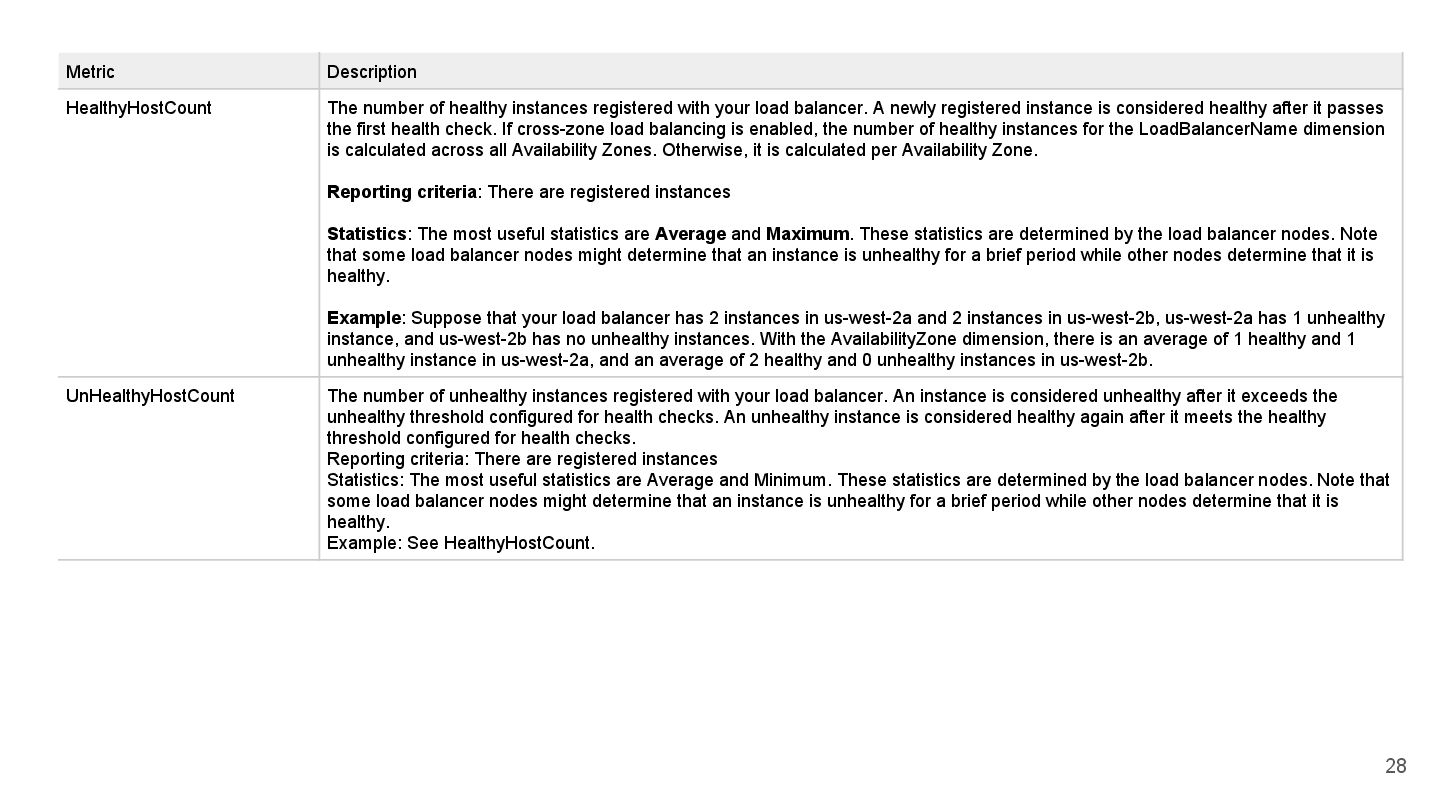
with your load balancer. A newly registered instance is considered healthy after it passes the first health check. If cross-zone load balancing is enabled, the number of healthy instances for the LoadBalancerName dimension is calculated across all Availability Zones. Otherwise, it is calculated per Availability Zone. Reporting criteria: There are registered instances Statistics: The most useful statistics are Average and Maximum. These statistics are determined by the load balancer nodes. Note that some load balancer nodes might determine that an instance is unhealthy for a brief period while other nodes determine that it is healthy. Example: Suppose that your load balancer has 2 instances in us-west-2a and 2 instances in us-west-2b, us-west-2a has 1 unhealthy instance, and us-west-2b has no unhealthy instances. With the AvailabilityZone dimension, there is an average of 1 healthy and 1 unhealthy instance in us-west-2a, and an average of 2 healthy and 0 unhealthy instances in us-west-2b. UnHealthyHostCount The number of unhealthy instances registered with your load balancer. An instance is considered unhealthy after it exceeds the unhealthy threshold configured for health checks. An unhealthy instance is considered healthy again after it meets the healthy threshold configured for health checks. Reporting criteria: There are registered instances Statistics: The most useful statistics are Average and Minimum. These statistics are determined by the load balancer nodes. Note that some load balancer nodes might determine that an instance is unhealthy for a brief period while other nodes determine that it is healthy. Example: See HealthyHostCount.
number of HTTP response codes generated by registered instances. This count does not include any response codes generated by the load balancer. Reporting criteria: There is a nonzero value Statistics: The most useful statistic is Sum. Note that Minimum, Maximum, and Average are all 1. Example: Suppose that your load balancer has 2 instances in us-west-2a and 2 instances in us-west-2b, and that requests sent to 1 instance in us-west-2a result in HTTP 500 responses. The sum for us-west-2a includes these error responses, while the sum for us-west-2b does not include them. Therefore, the sum for the load balancer equals the sum for us-west-2a. HTTPCode_ELB_4XX [HTTP listener] The number of HTTP 4XX client error codes generated by the load balancer. Client errors are generated when a request is malformed or incomplete. Reporting criteria: There is a nonzero value Statistics: The most useful statistic is Sum. Note that Minimum, Maximum, and Average are all 1. Example: Suppose that your load balancer has us-west-2a and us-west-2b enabled, and that client requests include a malformed request URL. As a result, client errors would likely increase in all Availability Zones. The sum for the load balancer is the sum of the values for the Availability Zones. HTTPCode_ELB_5XX [HTTP listener] The number of HTTP 5XX server error codes generated by the load balancer. This count does not include any response codes generated by the registered instances. The metric is reported if there are no healthy instances registered to the load balancer, or if the request rate exceeds the capacity of the instances (spillover) or the load balancer. Reporting criteria: There is a nonzero value Statistics: The most useful statistic is Sum. Note that Minimum, Maximum, and Average are all 1. Example: Suppose that your load balancer has us-west-2a and us-west-2b enabled, and that instances in us-west-2a are experiencing high latency and are slow to respond to requests. As a result, the surge queue for the load balancer nodes in us-west-2a fills and clients receive a 503 error. If us-west-2b continues to respond normally, the sum for the load balancer equals the sum for us-west-2a.
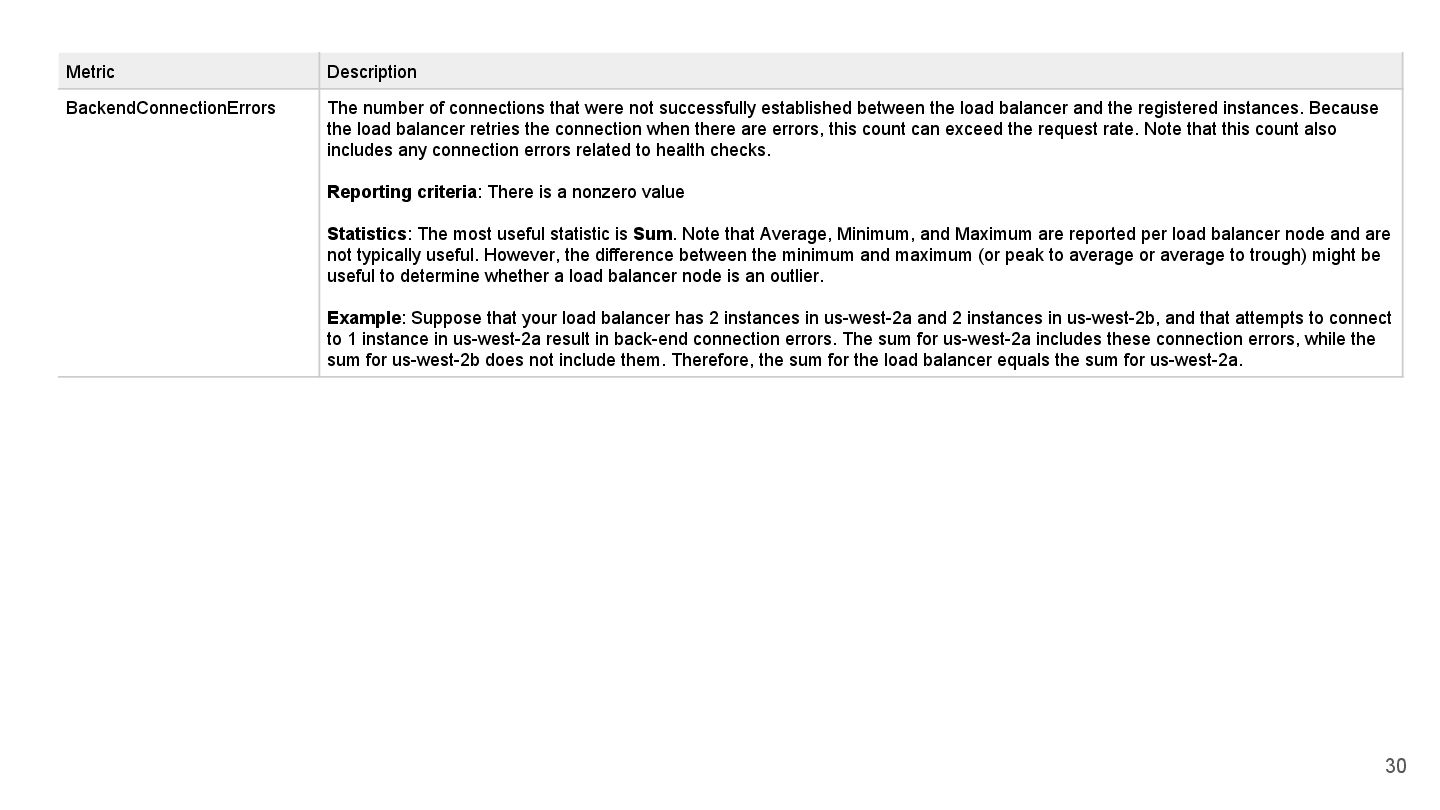
not successfully established between the load balancer and the registered instances. Because the load balancer retries the connection when there are errors, this count can exceed the request rate. Note that this count also includes any connection errors related to health checks. Reporting criteria: There is a nonzero value Statistics: The most useful statistic is Sum. Note that Average, Minimum, and Maximum are reported per load balancer node and are not typically useful. However, the difference between the minimum and maximum (or peak to average or average to trough) might be useful to determine whether a load balancer node is an outlier. Example: Suppose that your load balancer has 2 instances in us-west-2a and 2 instances in us-west-2b, and that attempts to connect to 1 instance in us-west-2a result in back-end connection errors. The sum for us-west-2a includes these connection errors, while the sum for us-west-2b does not include them. Therefore, the sum for the load balancer equals the sum for us-west-2a.
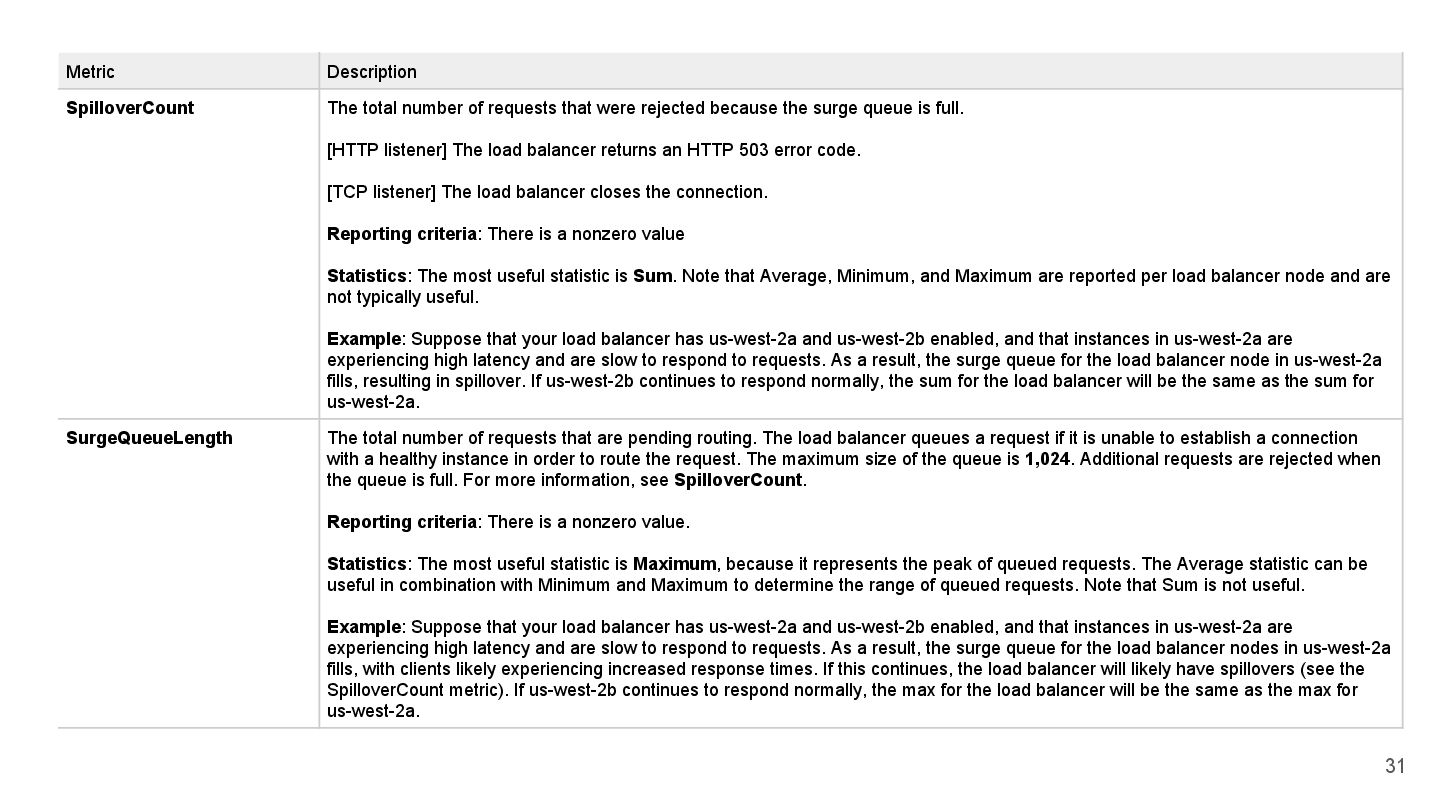
were rejected because the surge queue is full. [HTTP listener] The load balancer returns an HTTP 503 error code. [TCP listener] The load balancer closes the connection. Reporting criteria: There is a nonzero value Statistics: The most useful statistic is Sum. Note that Average, Minimum, and Maximum are reported per load balancer node and are not typically useful. Example: Suppose that your load balancer has us-west-2a and us-west-2b enabled, and that instances in us-west-2a are experiencing high latency and are slow to respond to requests. As a result, the surge queue for the load balancer node in us-west-2a fills, resulting in spillover. If us-west-2b continues to respond normally, the sum for the load balancer will be the same as the sum for us-west-2a. SurgeQueueLength The total number of requests that are pending routing. The load balancer queues a request if it is unable to establish a connection with a healthy instance in order to route the request. The maximum size of the queue is 1,024. Additional requests are rejected when the queue is full. For more information, see SpilloverCount. Reporting criteria: There is a nonzero value. Statistics: The most useful statistic is Maximum, because it represents the peak of queued requests. The Average statistic can be useful in combination with Minimum and Maximum to determine the range of queued requests. Note that Sum is not useful. Example: Suppose that your load balancer has us-west-2a and us-west-2b enabled, and that instances in us-west-2a are experiencing high latency and are slow to respond to requests. As a result, the surge queue for the load balancer nodes in us-west-2a fills, with clients likely experiencing increased response times. If this continues, the load balancer will likely have spillovers (see the SpilloverCount metric). If us-west-2b continues to respond normally, the max for the load balancer will be the same as the max for us-west-2a.
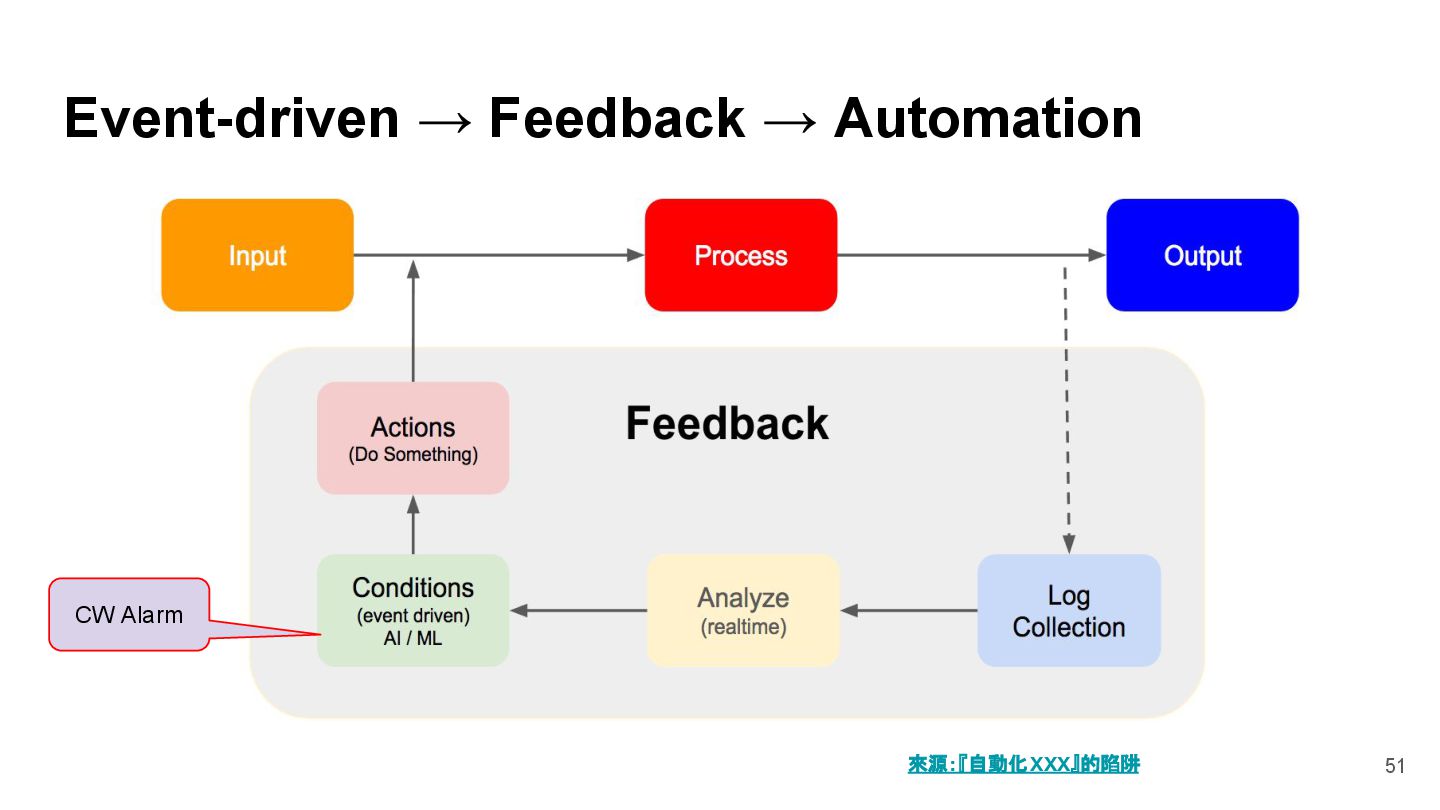
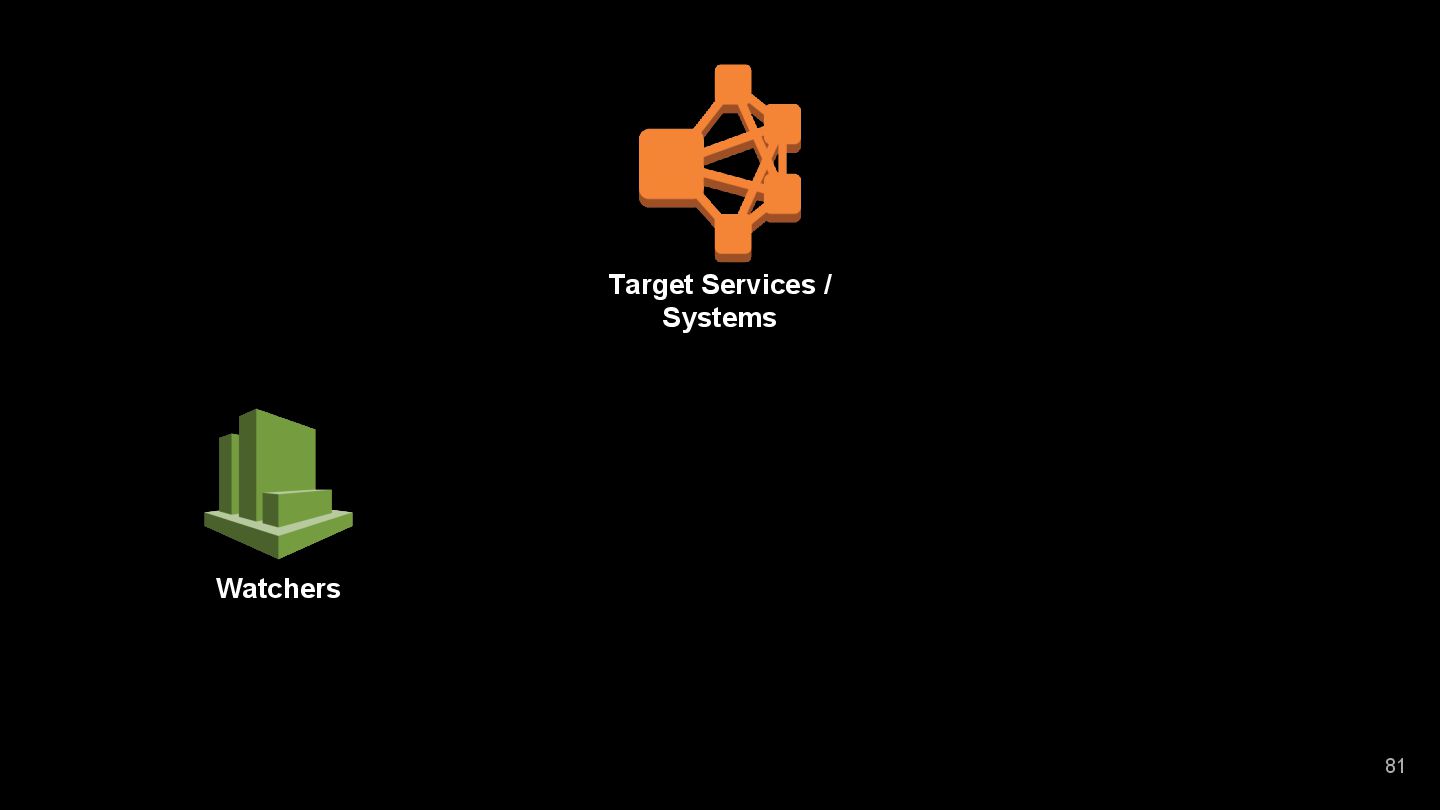
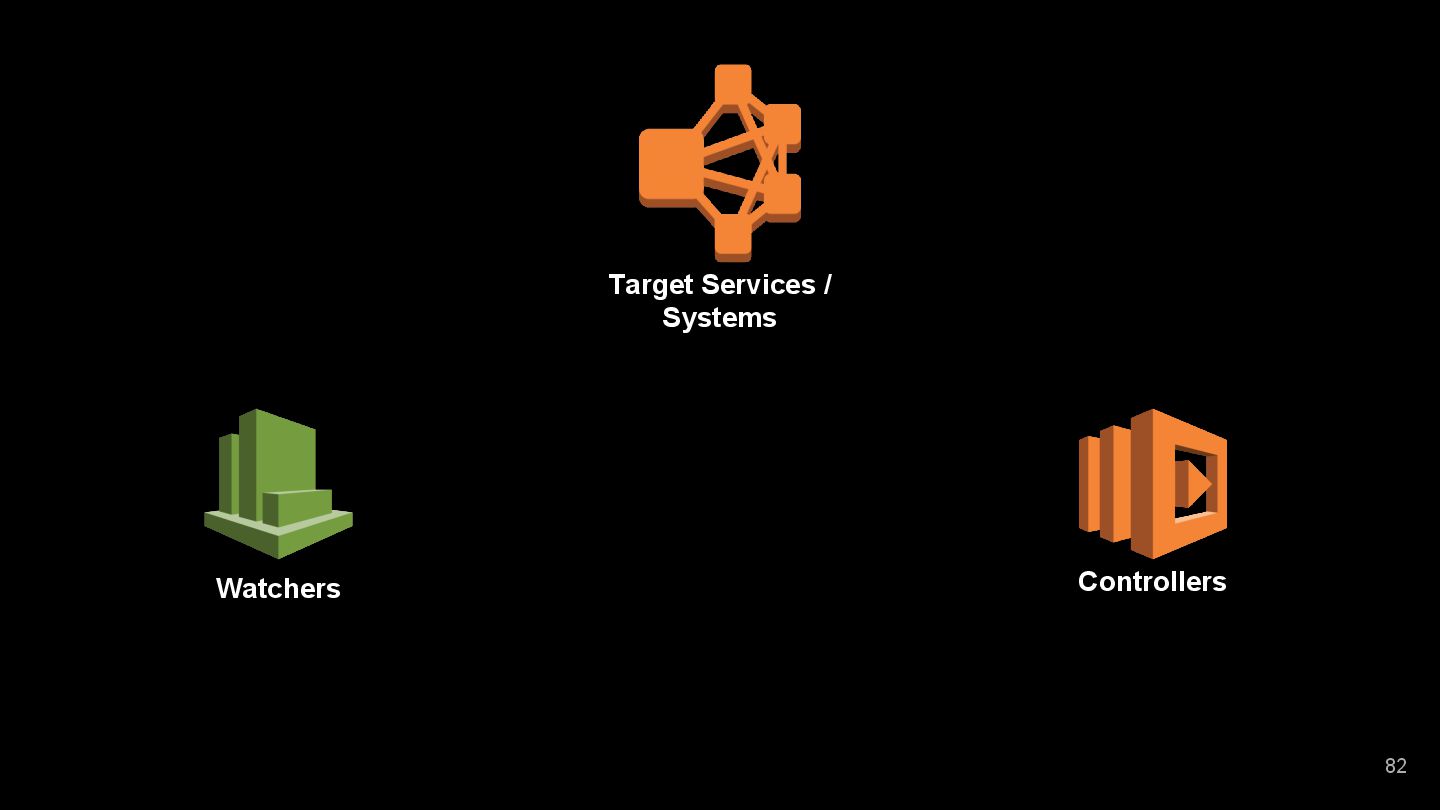
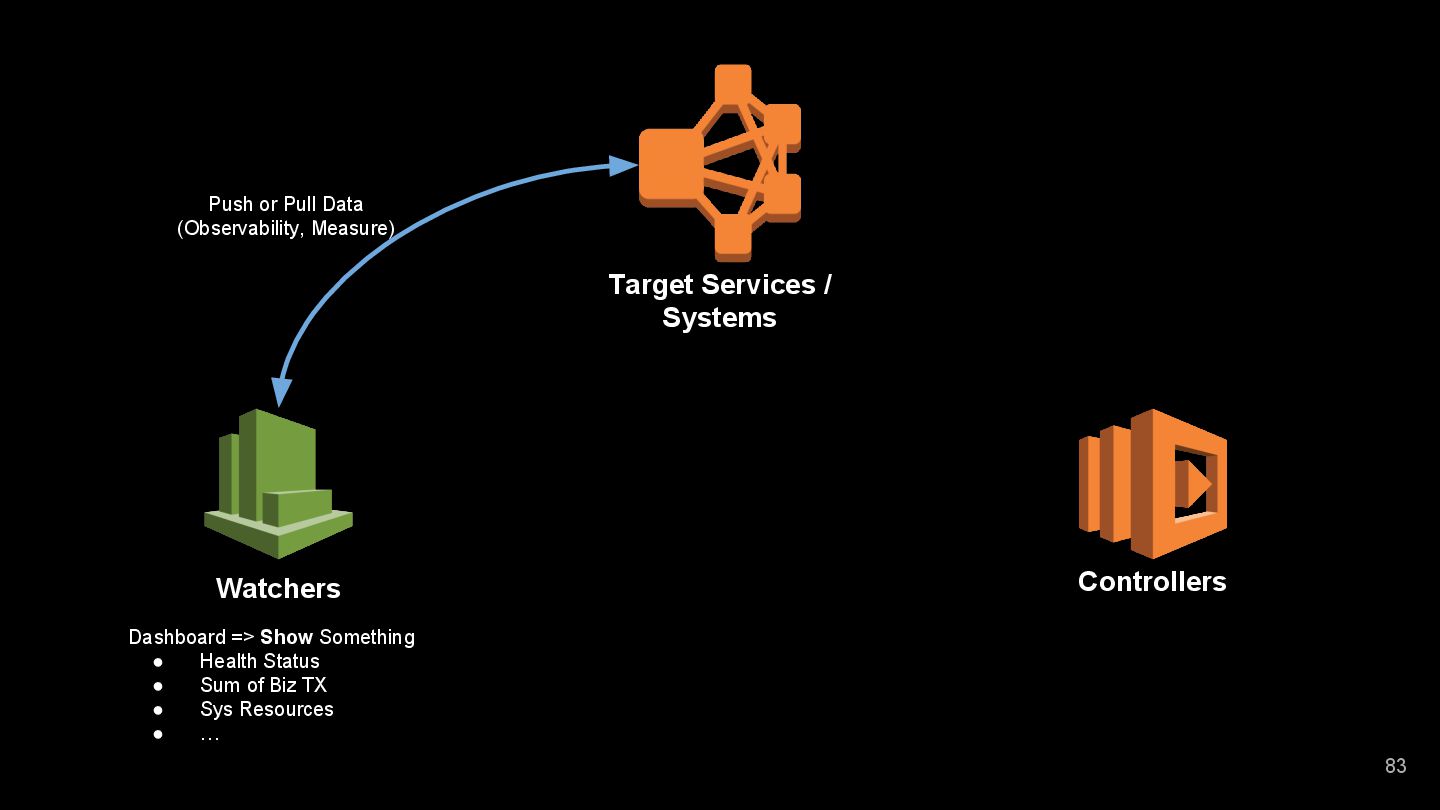
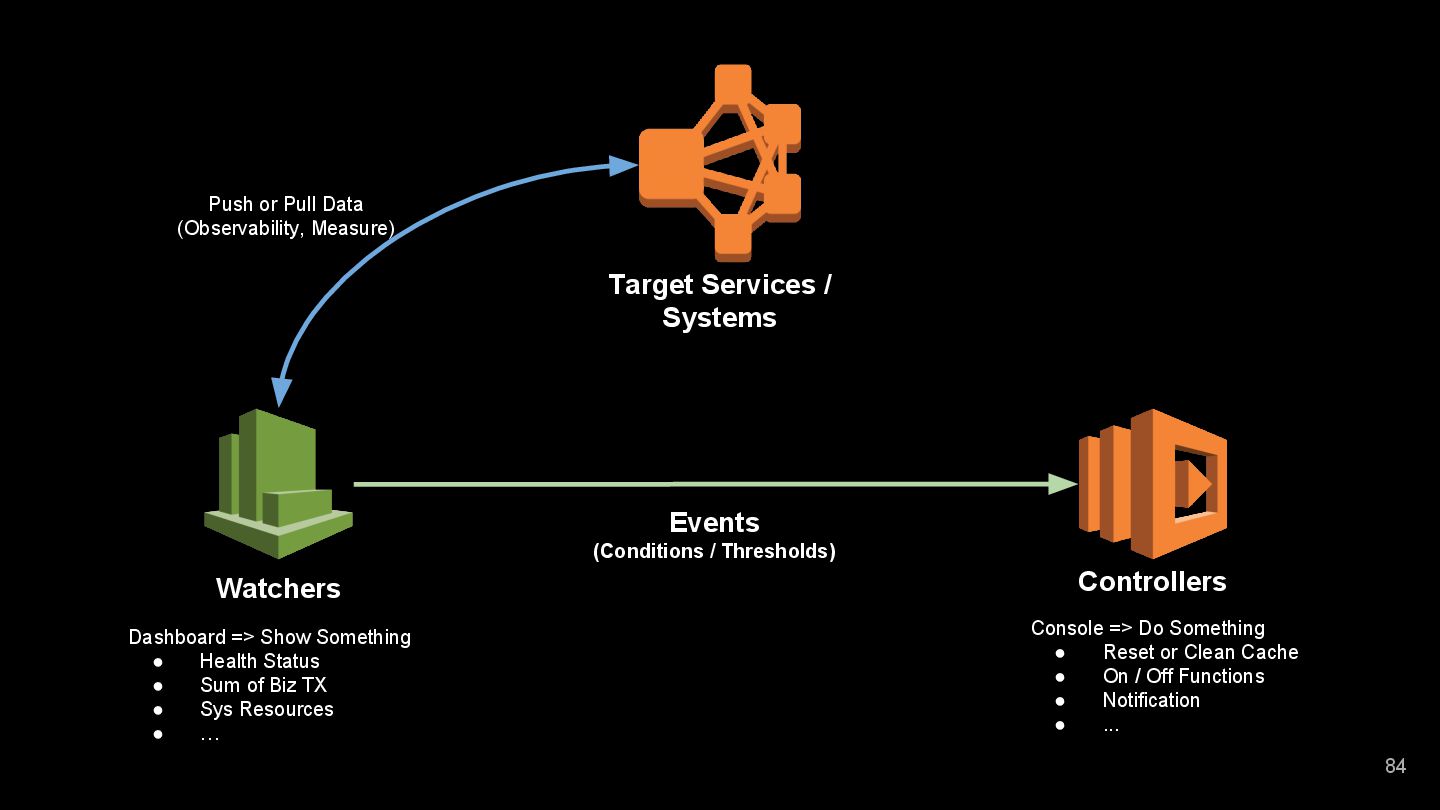
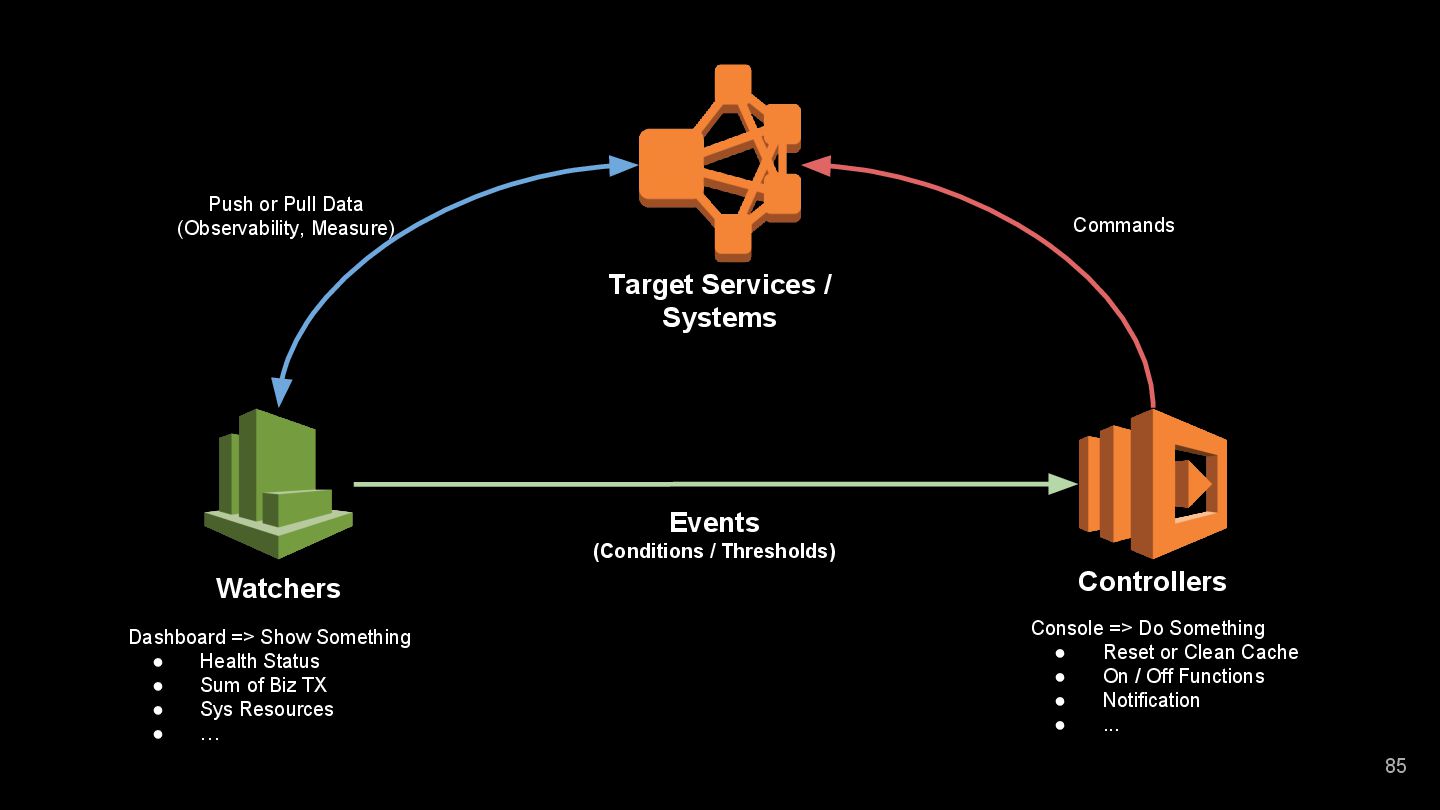
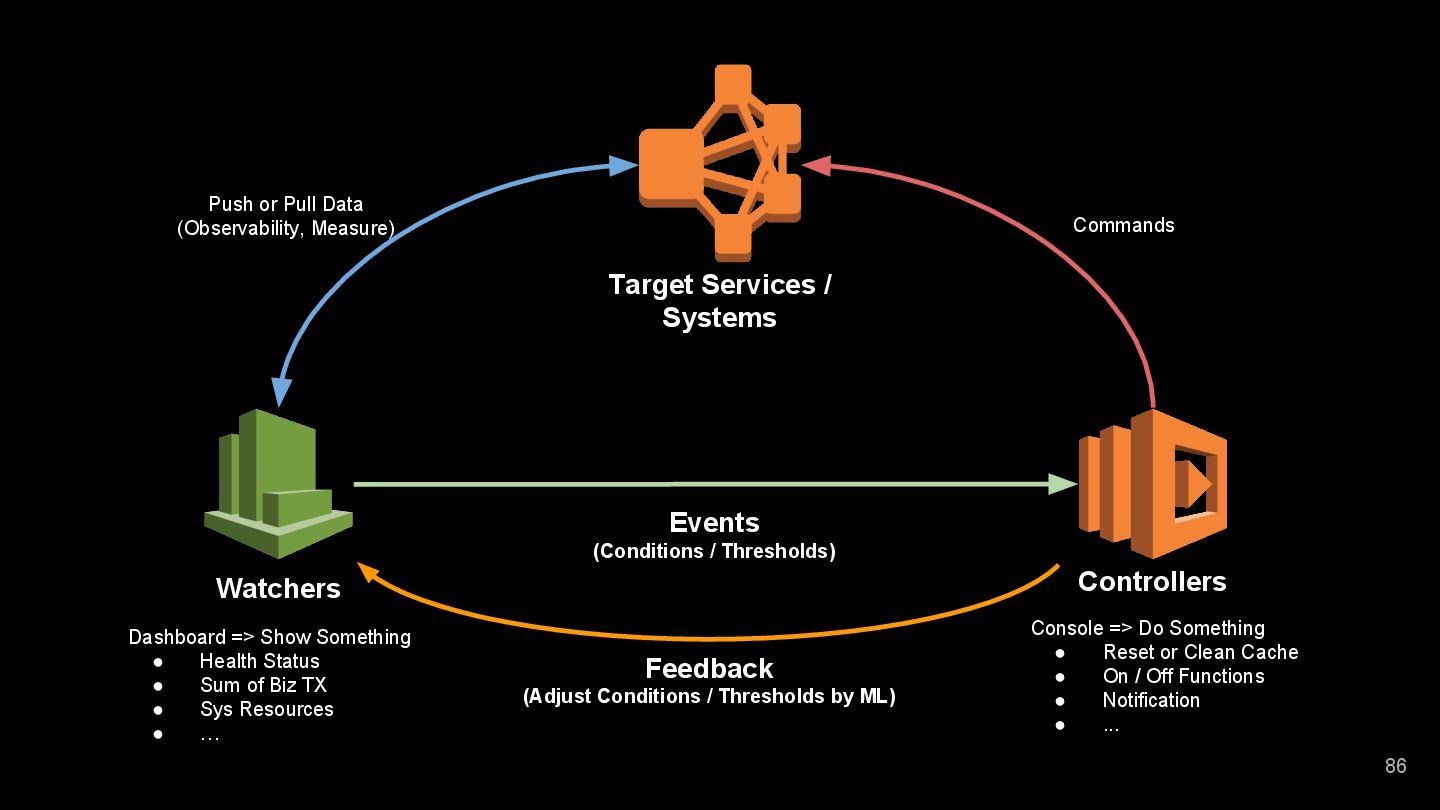
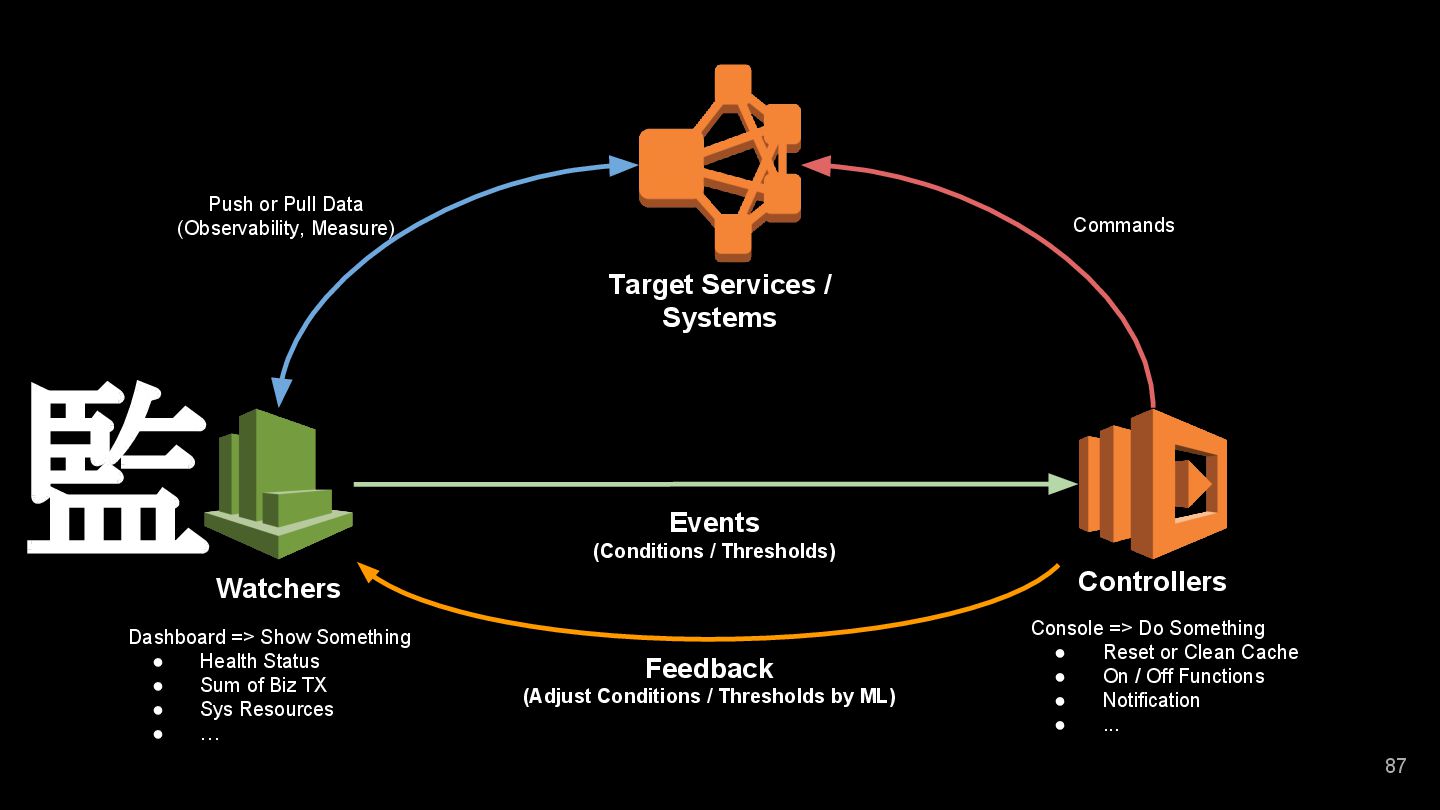
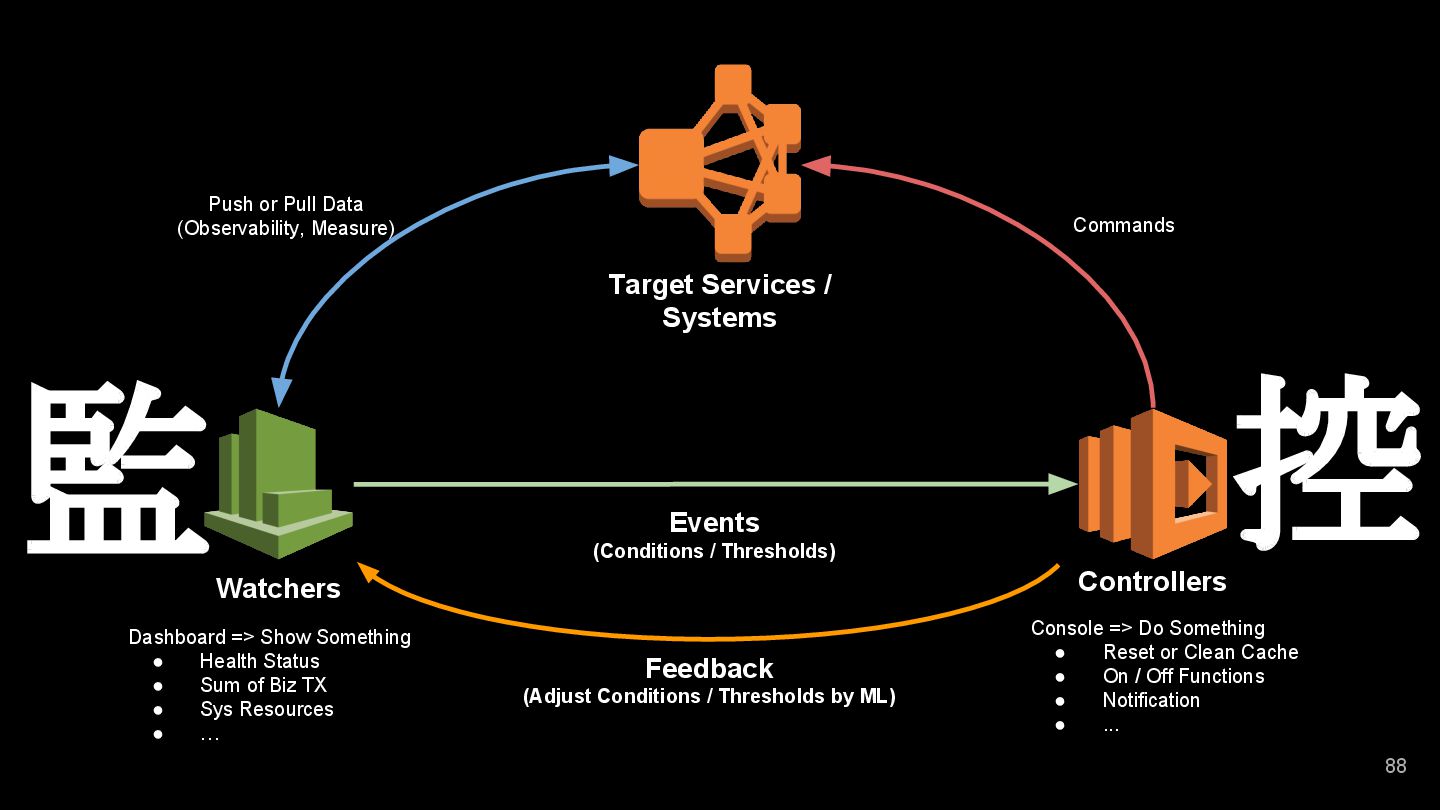
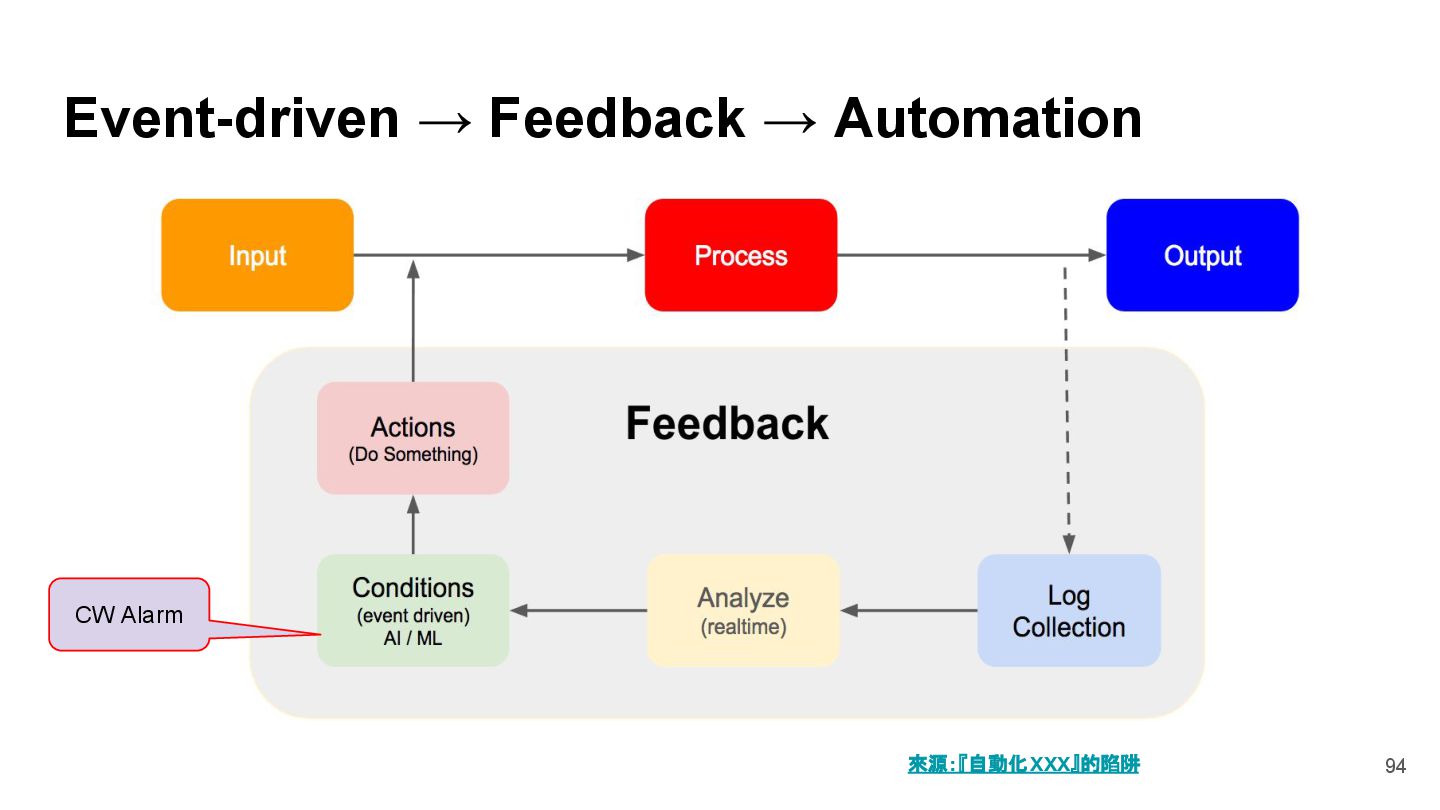
of Biz TX • Sys Resources • … 85 Target Services / Systems Watchers Controllers Events (Conditions / Thresholds) Console => Do Something • Reset or Clean Cache • On / Off Functions • Notification • ... Push or Pull Data (Observability, Measure)
of Biz TX • Sys Resources • … 86 Target Services / Systems Watchers Controllers Events (Conditions / Thresholds) Console => Do Something • Reset or Clean Cache • On / Off Functions • Notification • ... Feedback (Adjust Conditions / Thresholds by ML) Push or Pull Data (Observability, Measure)


 rickhwang
 ytapples613
 hiola
hiola
 doratex
 signer
 ainischool
 juanmartin2026
 okana2ki
 cbtlibrary
 fmarot
 inesmontani
 davidcarrasco
 holman
 thirion
 rkaga
rkaga
 palkan
 brad_frost
 aleyda
 ryanjones
 maggiecrowley
 soysaucechin
 bkeepers

![AWS CloudWatch Observability and Monitoring 2 Rick Hwang [email protected] 2017/12/28](https://files.speakerdeck.com/presentations/bfaa55606afd4a0189b2648a9d77cc02/slide_1.jpg)







![27 Metric Description Latency [HTTP listener] The total time elapsed,](https://files.speakerdeck.com/presentations/bfaa55606afd4a0189b2648a9d77cc02/slide_26.jpg)
![29 Metric Description HTTPCode_Backend_2XX, HTTPCode_Backend_3XX, HTTPCode_Backend_4XX, HTTPCode_Backend_5XX [HTTP listener] The](https://files.speakerdeck.com/presentations/bfaa55606afd4a0189b2648a9d77cc02/slide_28.jpg)