Upgrade to Pro
— share decks privately, control downloads, hide ads and more …
Speaker Deck
Features
Speaker Deck
PRO
Sign in
Sign up for free
Search
Search
Good plot, bad plot
Search
Riinu Pius
August 07, 2025
17
0
Share
Good plot, bad plot
Riinu Pius
August 07, 2025
More Decks by Riinu Pius
See All by Riinu Pius
Data collection principles
riinuots
0
38
R for Health Data Science: from clinicians who code to Shiny interventions
riinuots
0
200
Presenting with confidence
riinuots
0
150
Reporting Apps for data projects
riinuots
0
260
Diesel. Cooking. Wood-burning.
riinuots
0
140
Featured
See All Featured
GraphQLの誤解/rethinking-graphql
sonatard
75
12k
Paper Plane (Part 1)
katiecoart
PRO
0
7.6k
KATA
mclloyd
PRO
35
15k
svc-hook: hooking system calls on ARM64 by binary rewriting
retrage
2
250
Design of three-dimensional binary manipulators for pick-and-place task avoiding obstacles (IECON2024)
konakalab
0
420
The Art of Delivering Value - GDevCon NA Keynote
reverentgeek
16
1.9k
[Rails World 2023 - Day 1 Closing Keynote] - The Magic of Rails
eileencodes
38
2.9k
The Spectacular Lies of Maps
axbom
PRO
1
750
The Impact of AI in SEO - AI Overviews June 2024 Edition
aleyda
5
1.1k
Building Experiences: Design Systems, User Experience, and Full Site Editing
marktimemedia
0
510
jQuery: Nuts, Bolts and Bling
dougneiner
66
8.5k
Beyond borders and beyond the search box: How to win the global "messy middle" with AI-driven SEO
davidcarrasco
3
130
Transcript
Essential skills for global research: Good plot, bad plot.
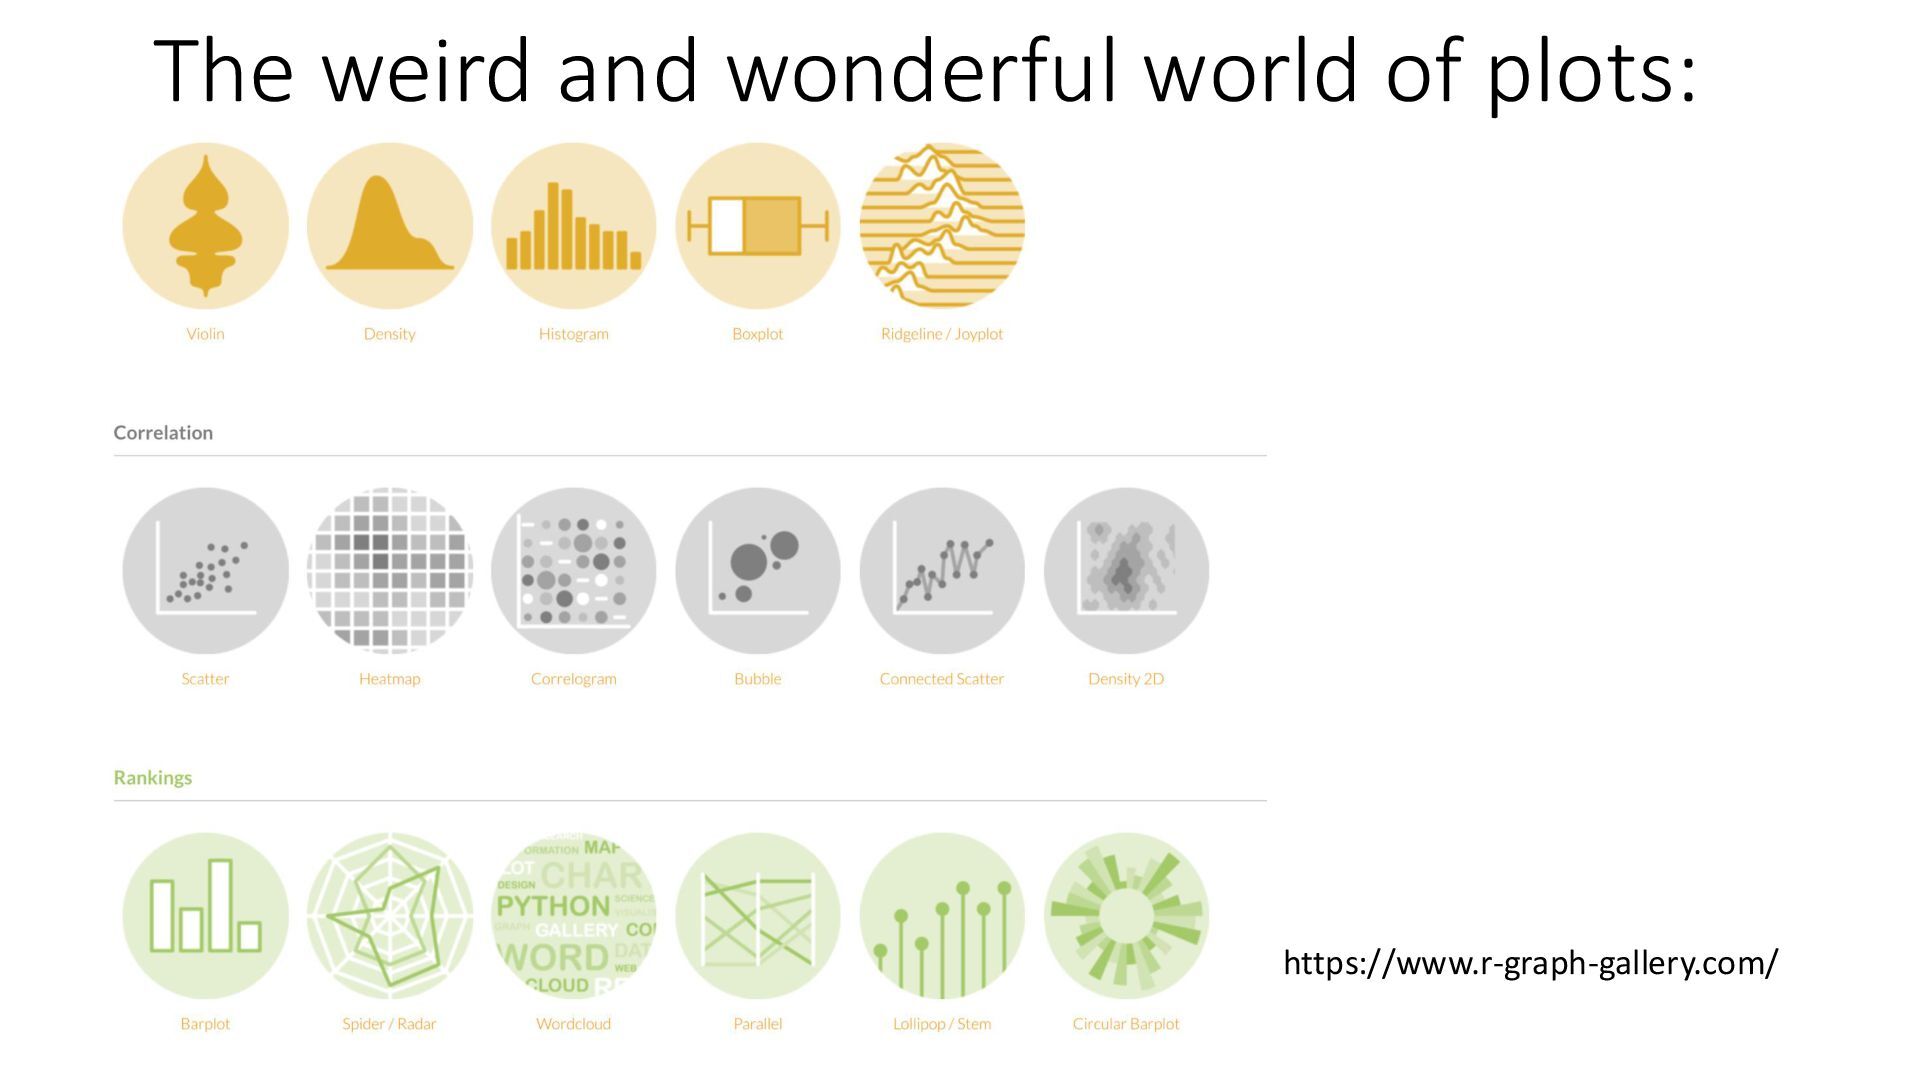
The weird and wonderful world of plots: https://www.r-graph-gallery.com/
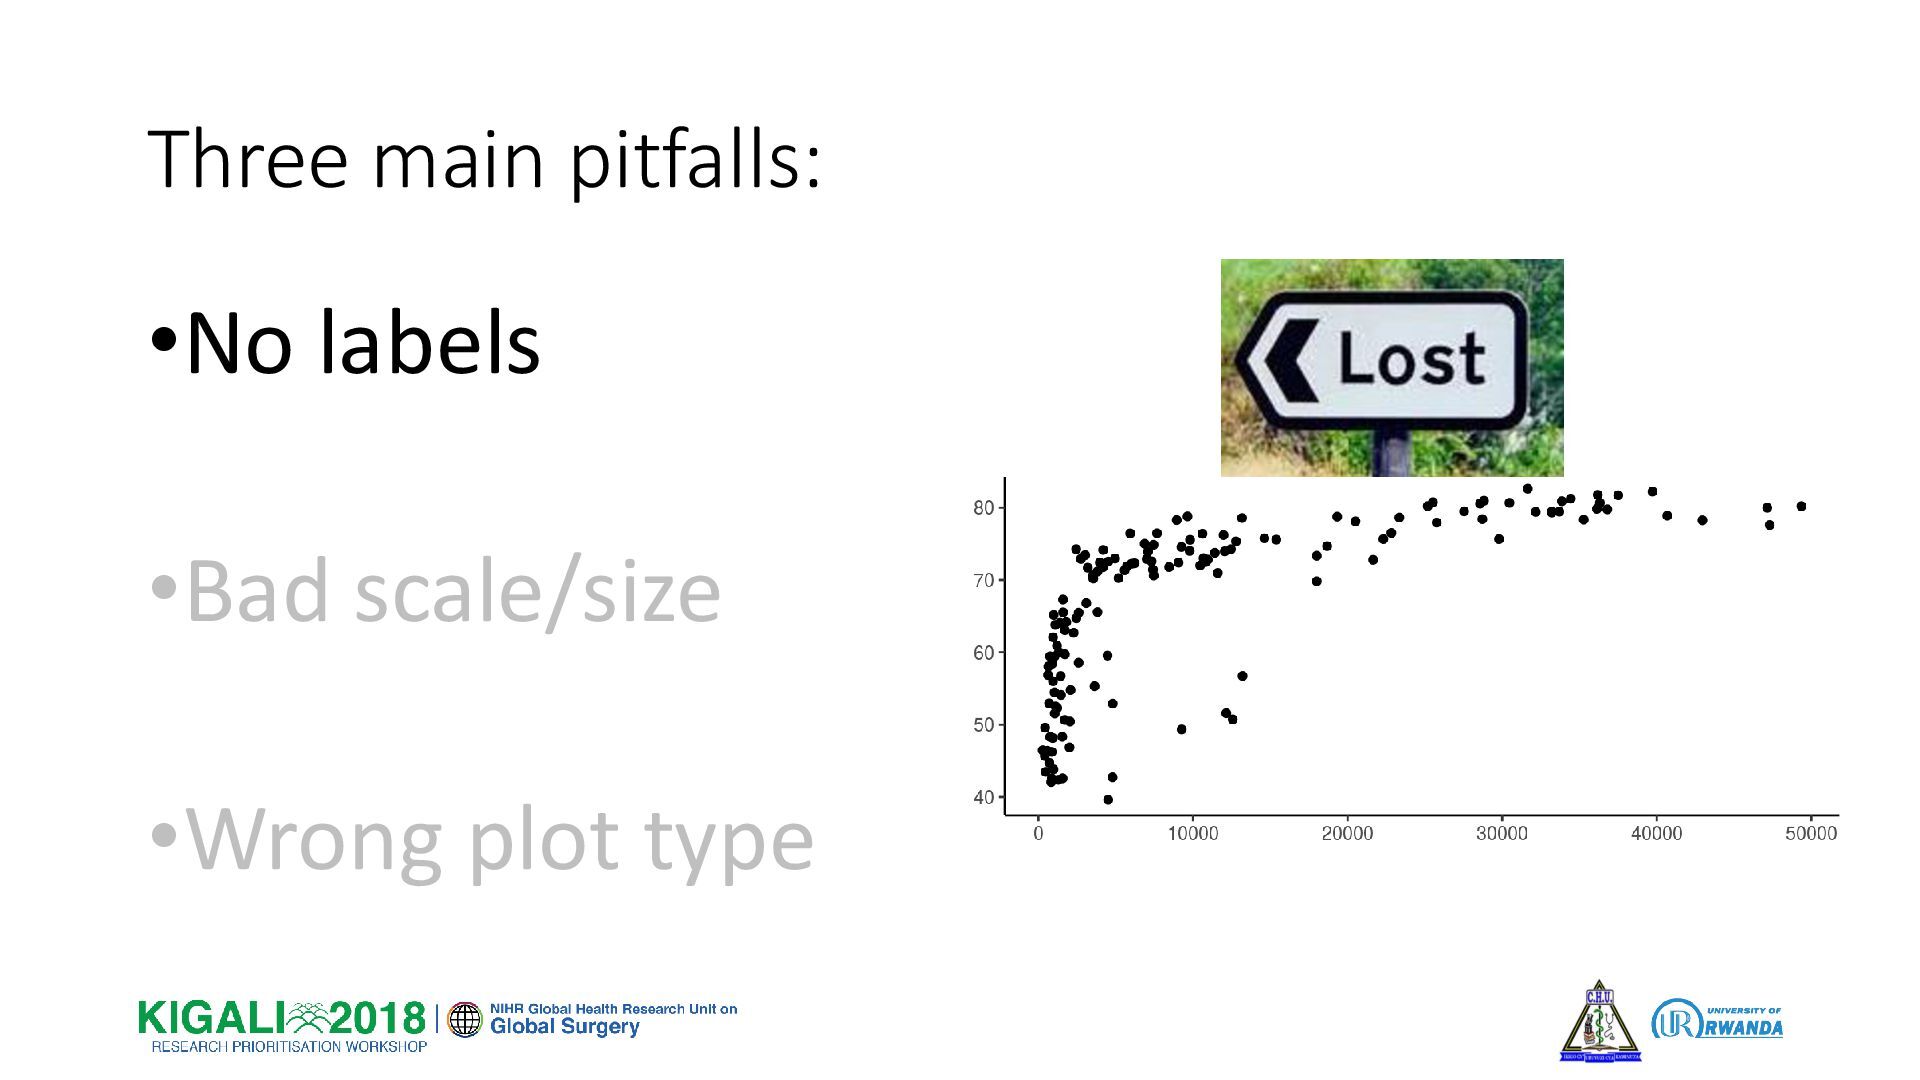
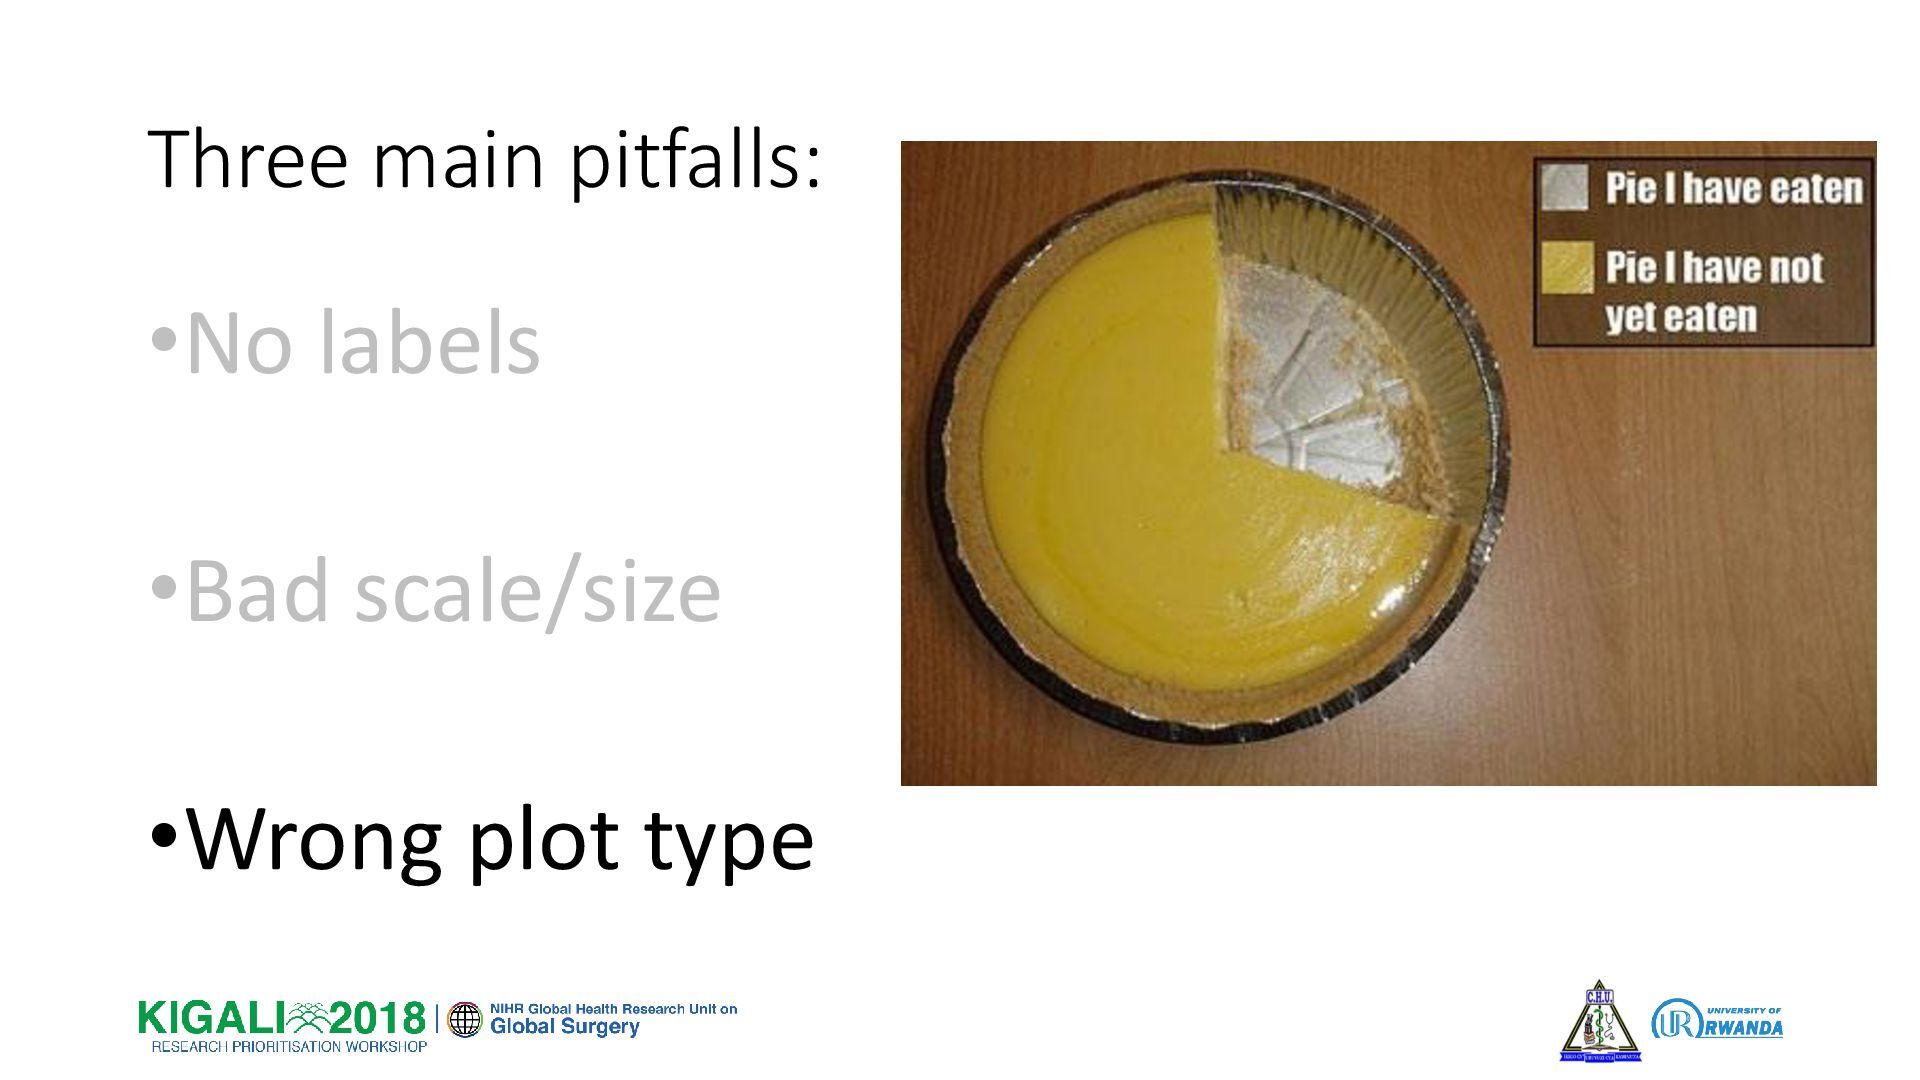
Three main pitfalls: •No labels •Bad scale/size •Wrong plot type
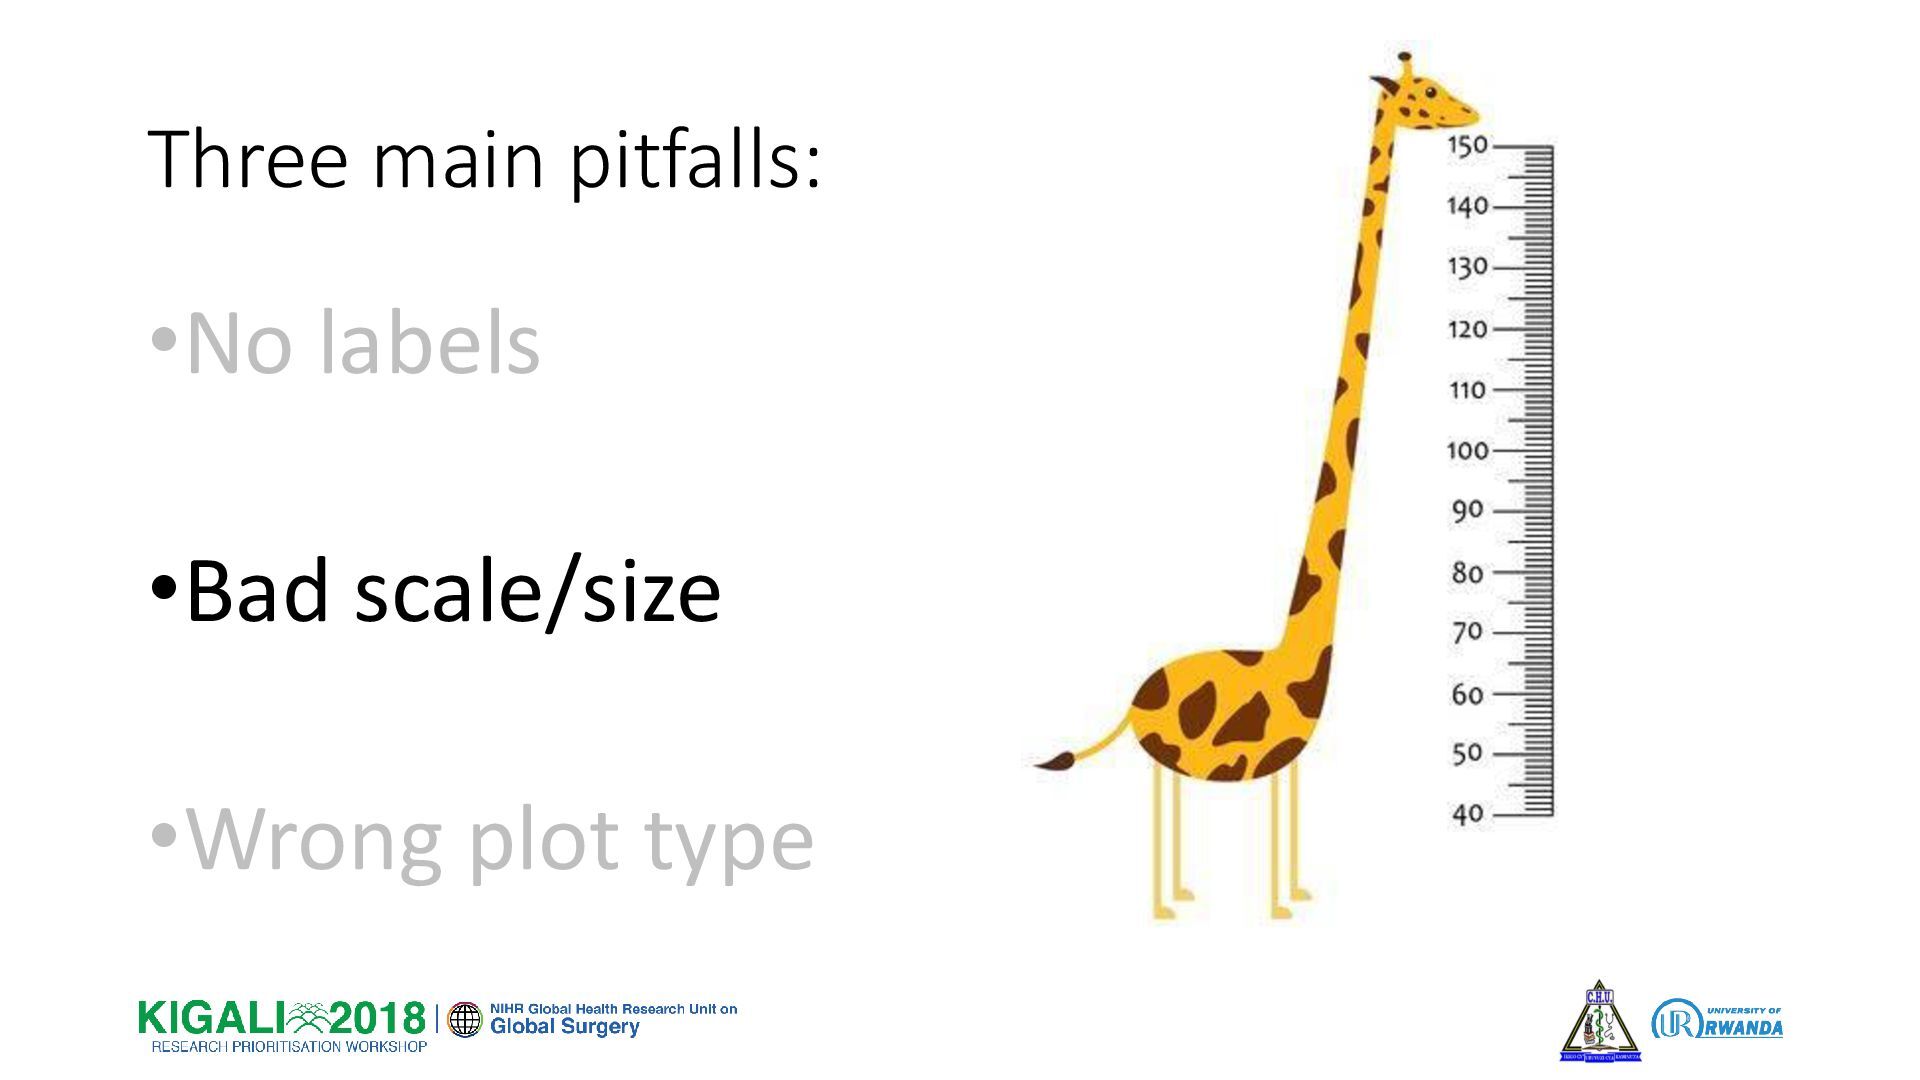
Three main pitfalls: •No labels •Bad scale/size •Wrong plot type
Three main pitfalls: •No labels •Bad scale/size •Wrong plot type
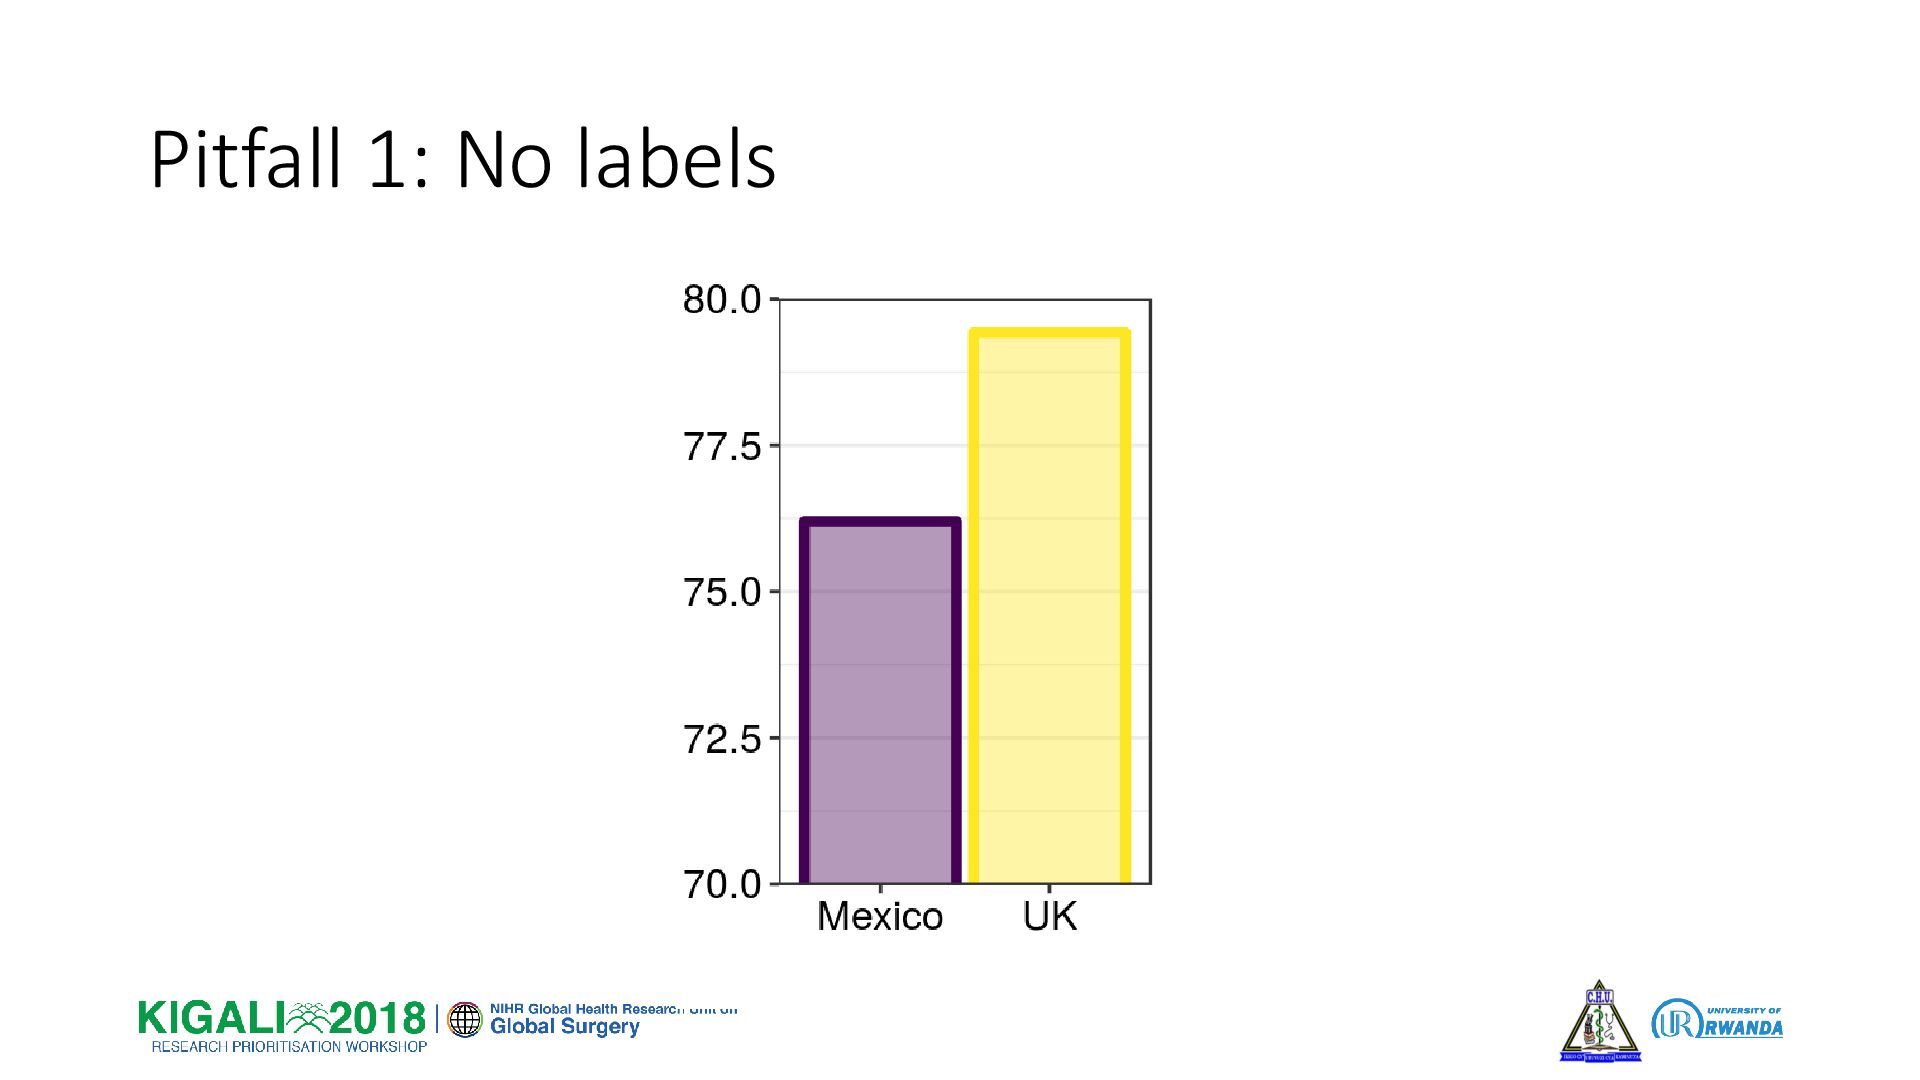
Pitfall 1: No labels
None
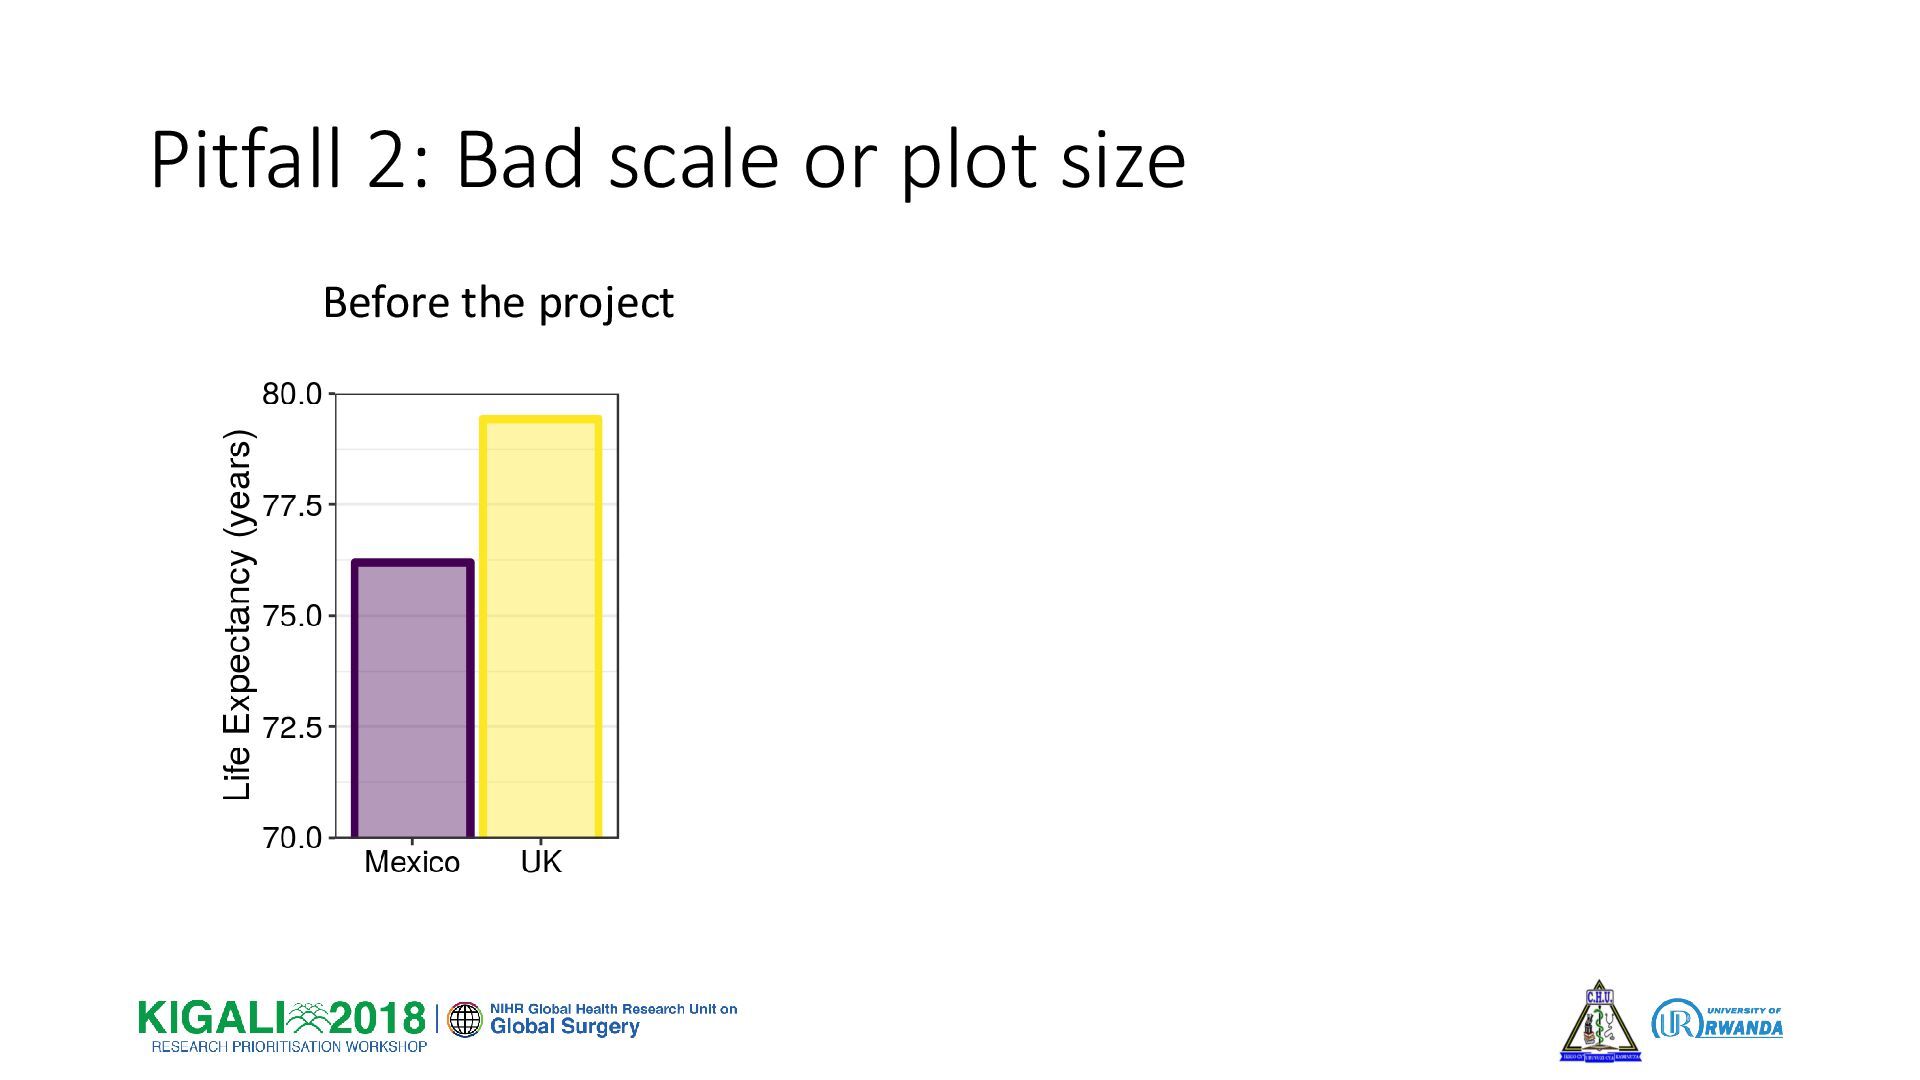
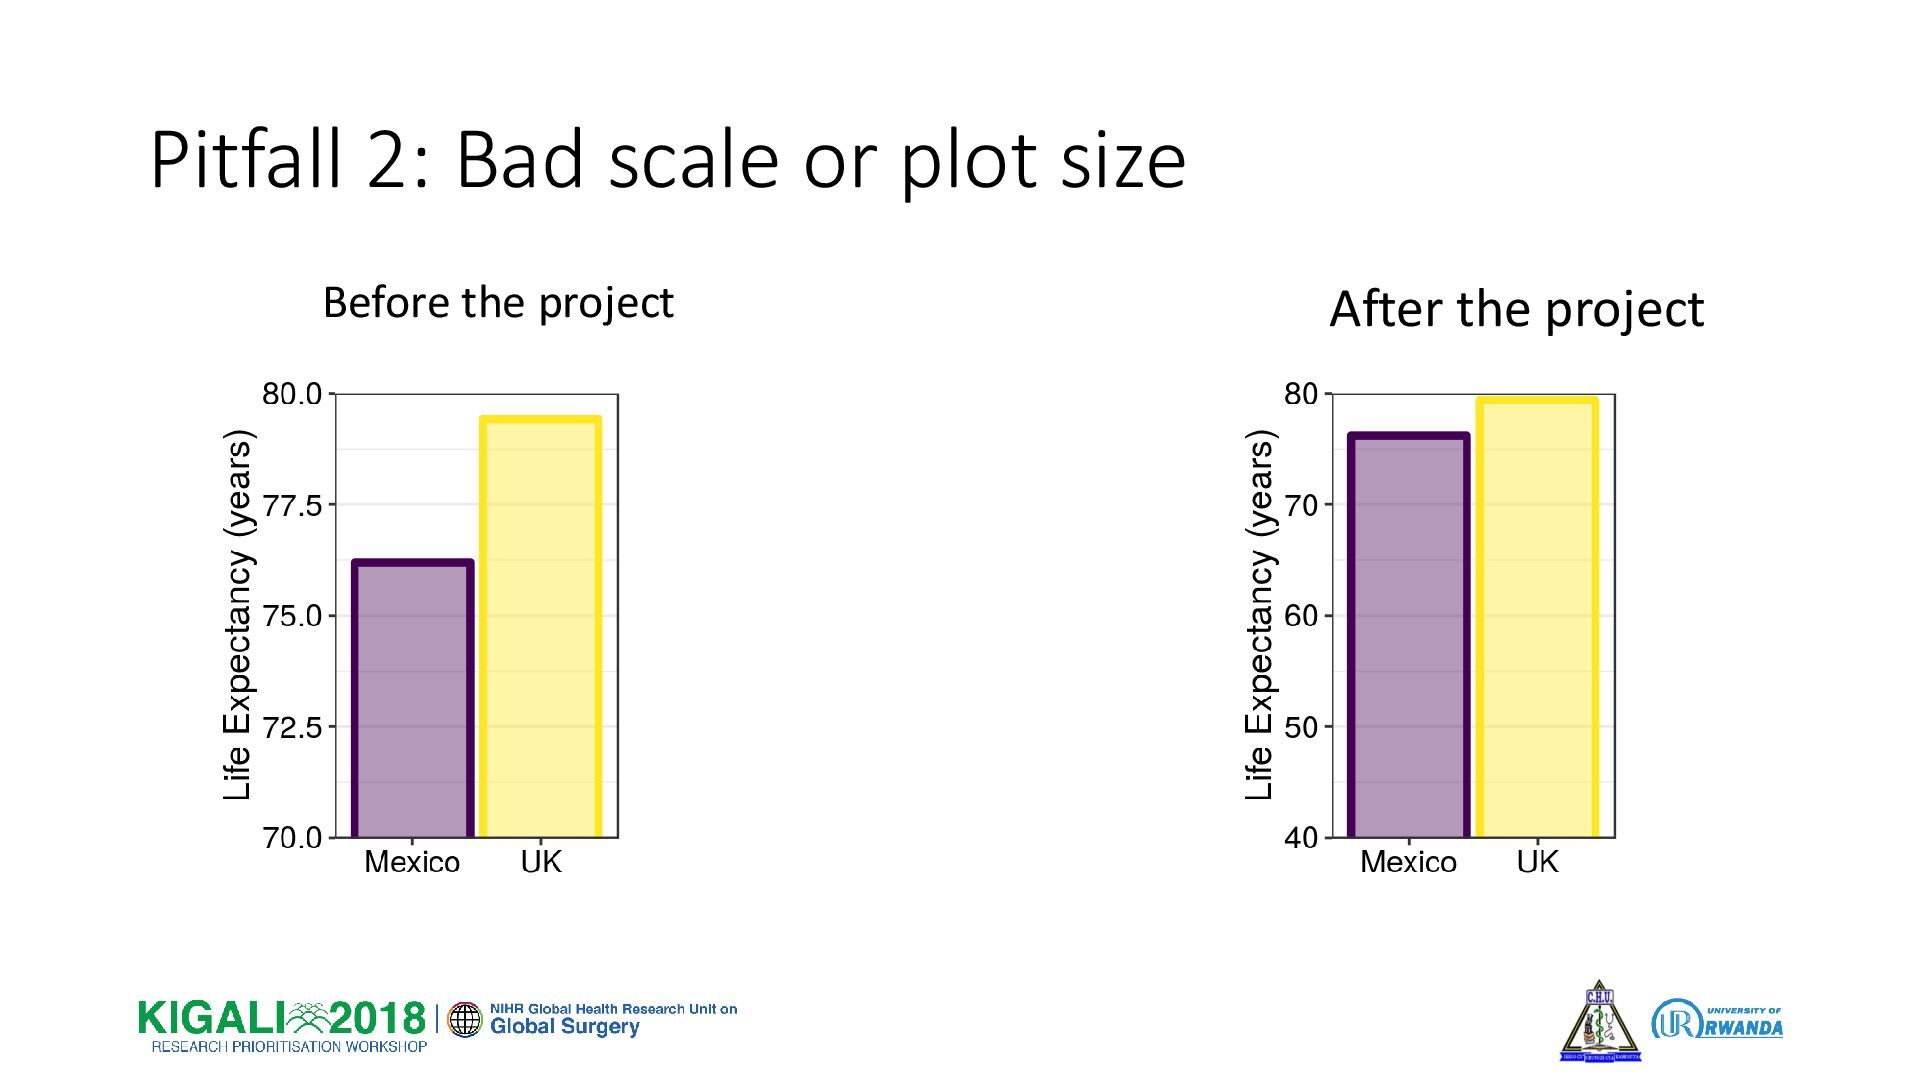
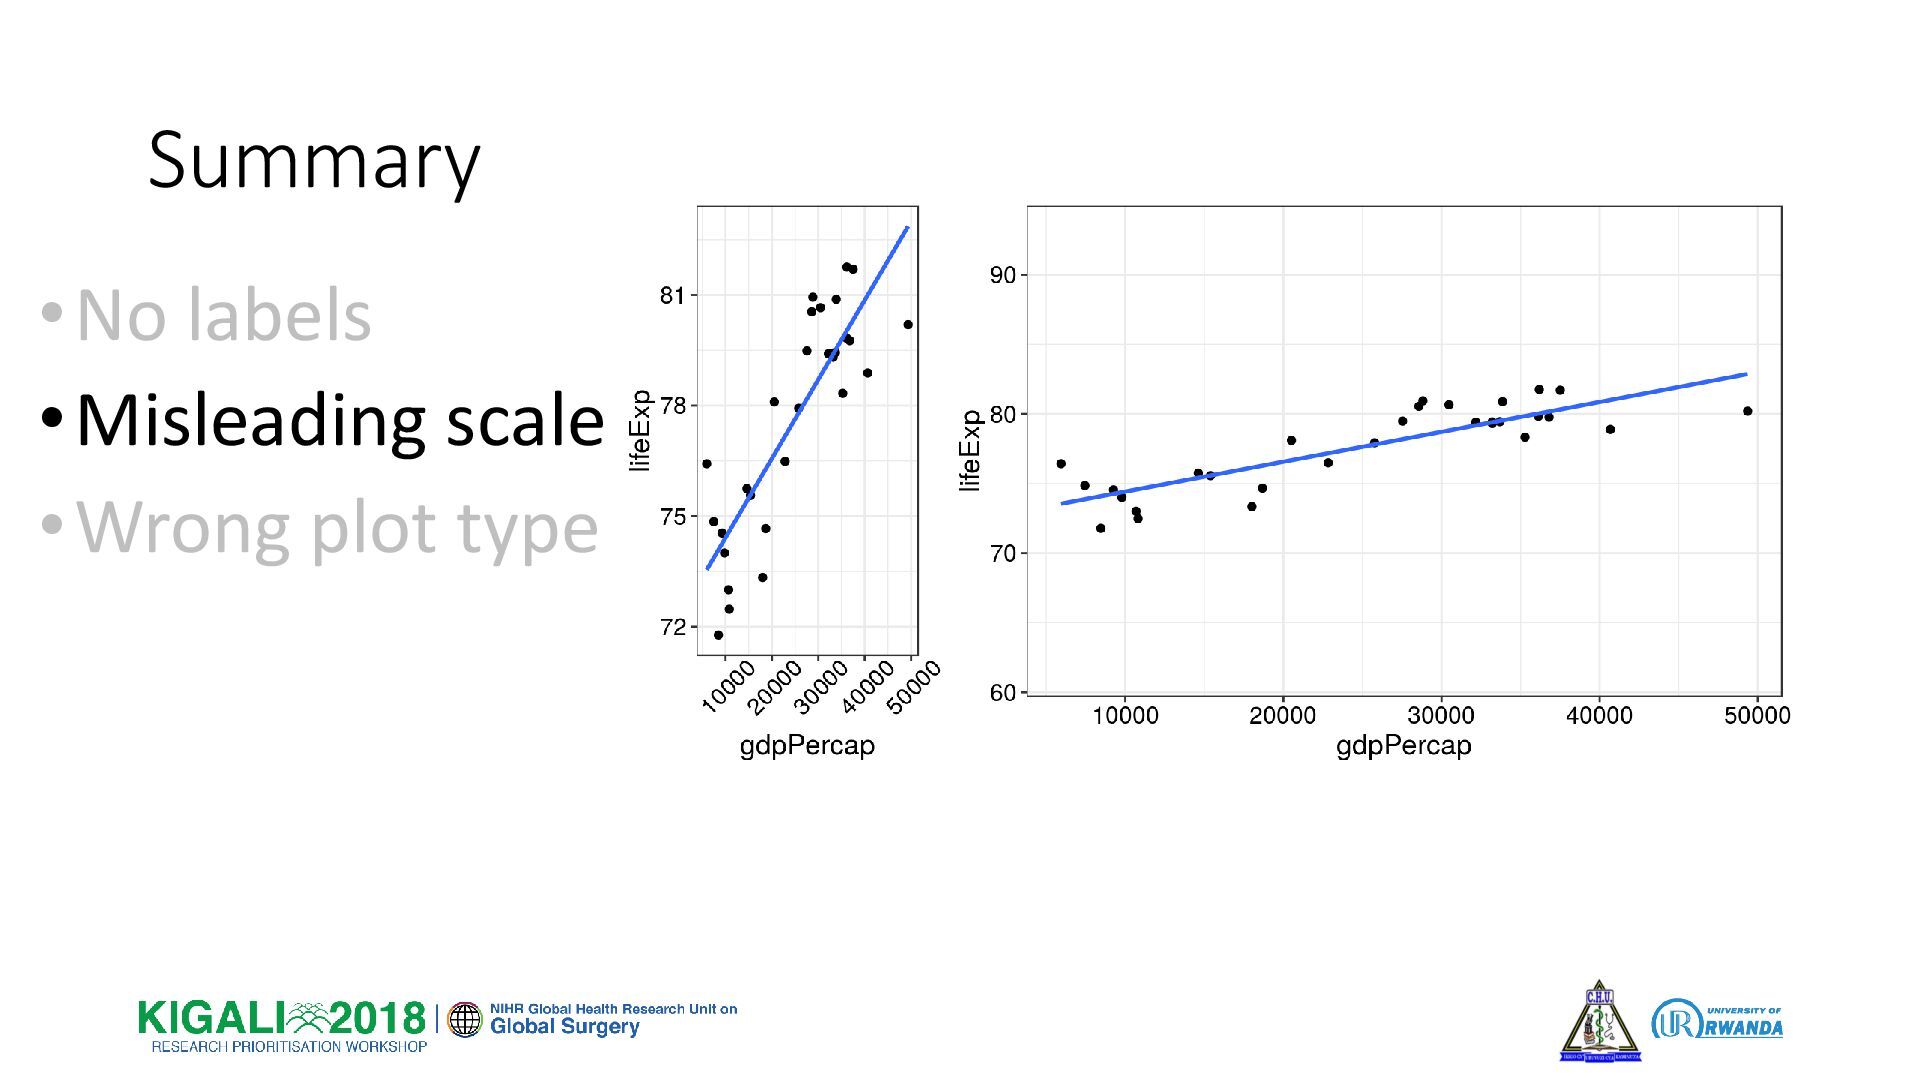
Pitfall 2: Bad scale or plot size Before the project
Pitfall 2: Bad scale or plot size Before the project
After the project
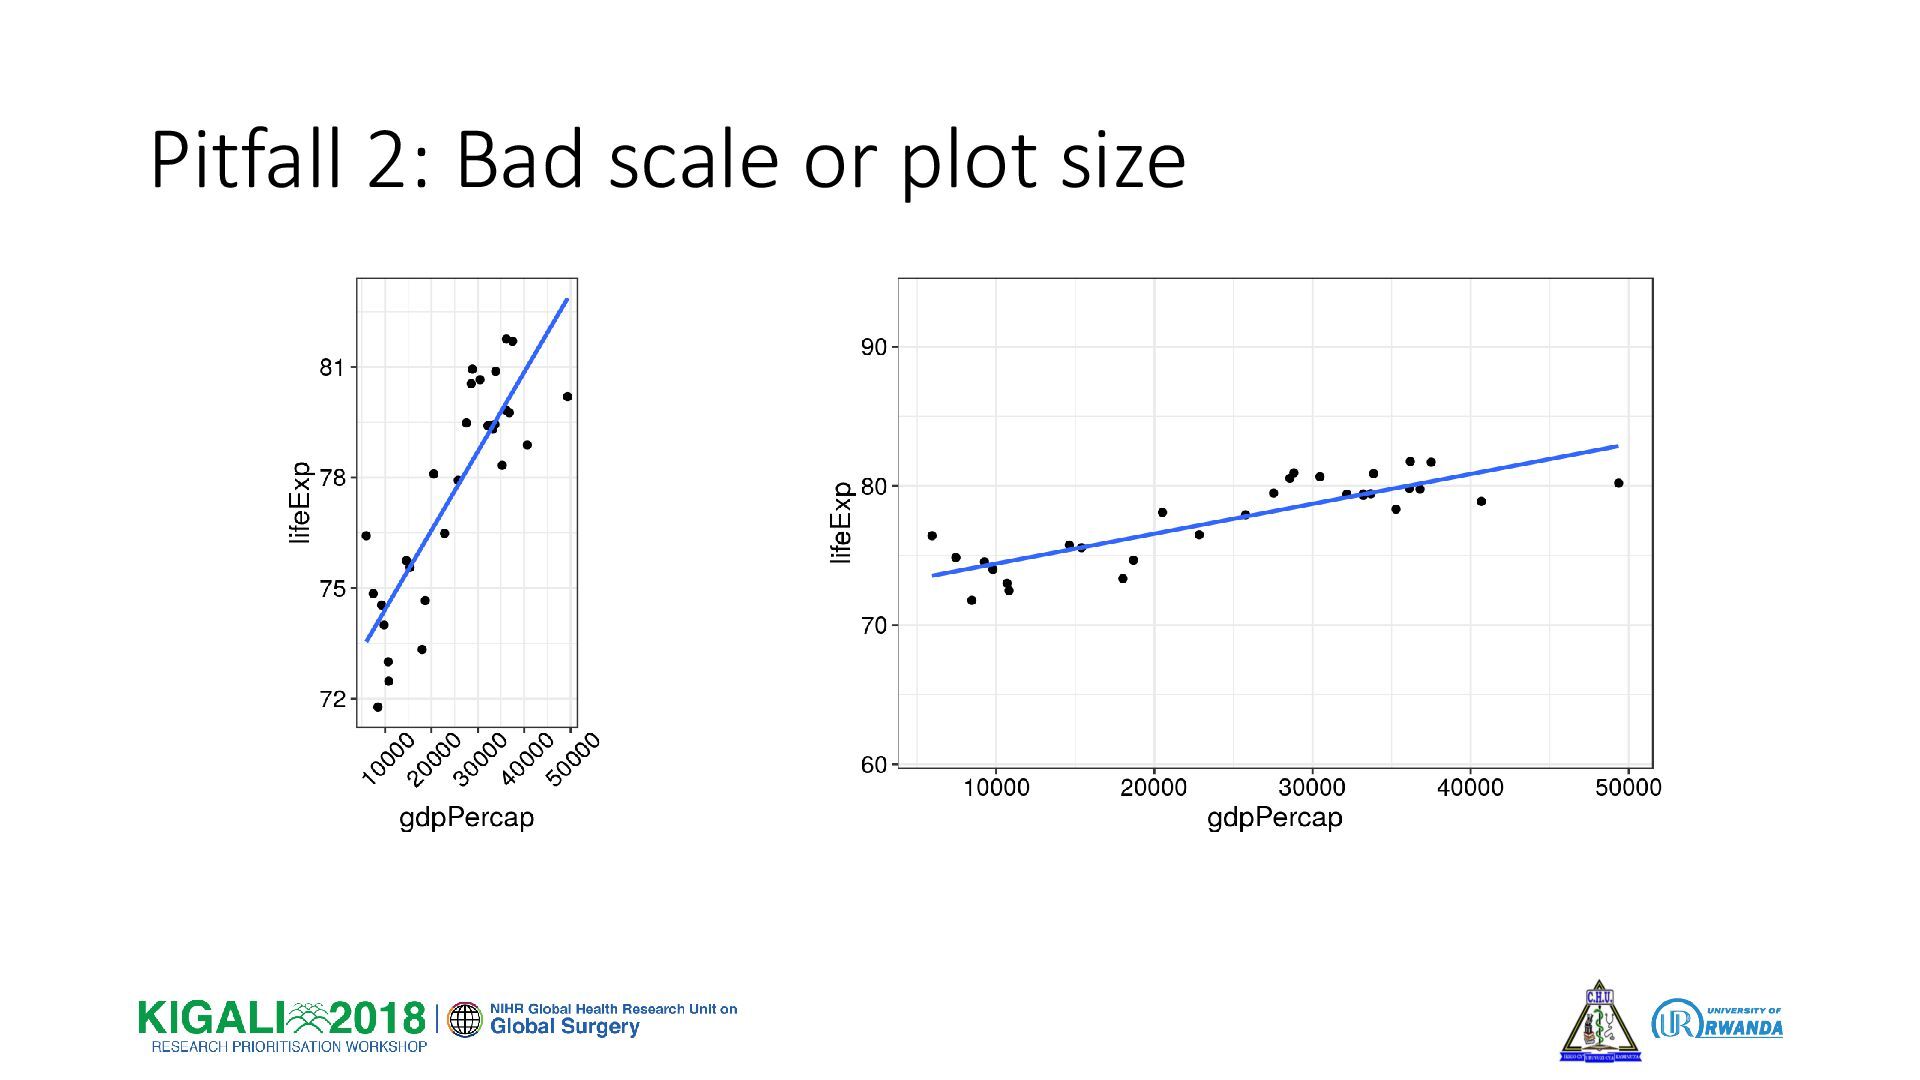
Pitfall 2: Bad scale or plot size
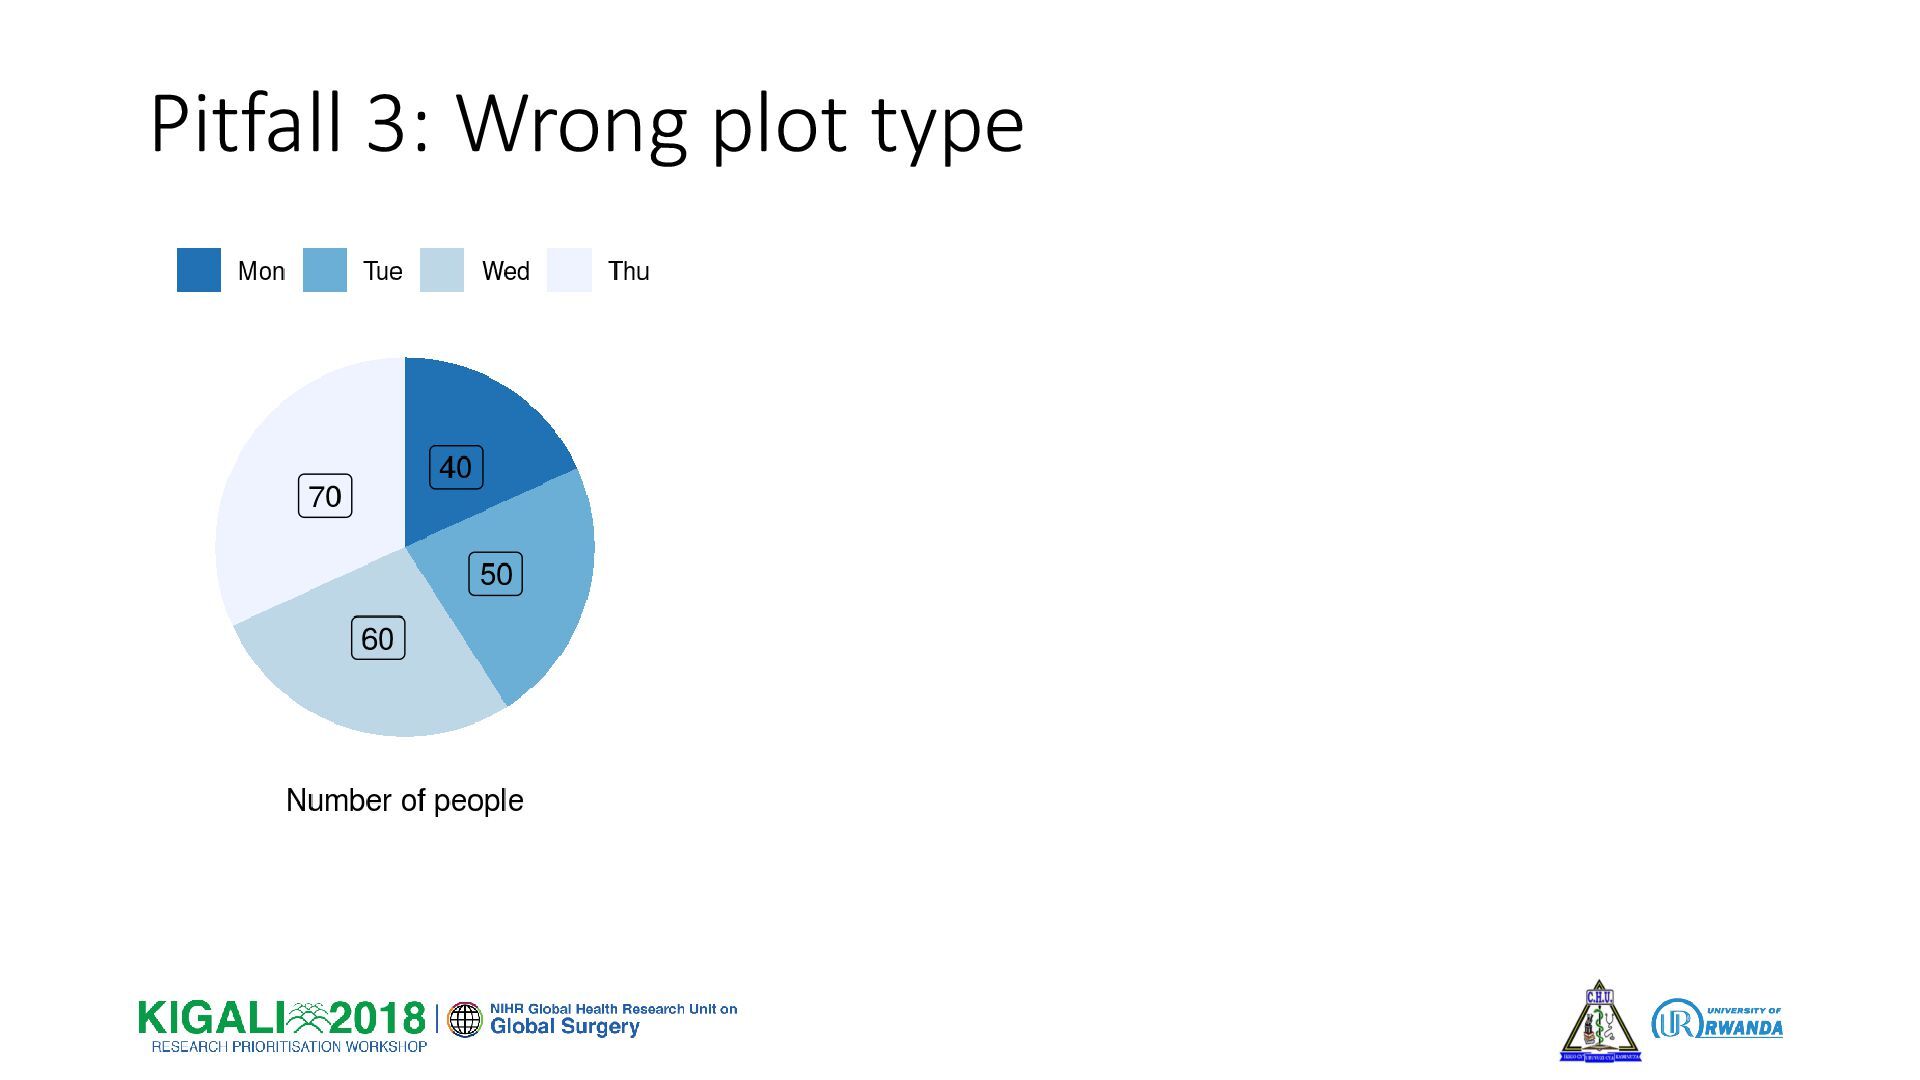
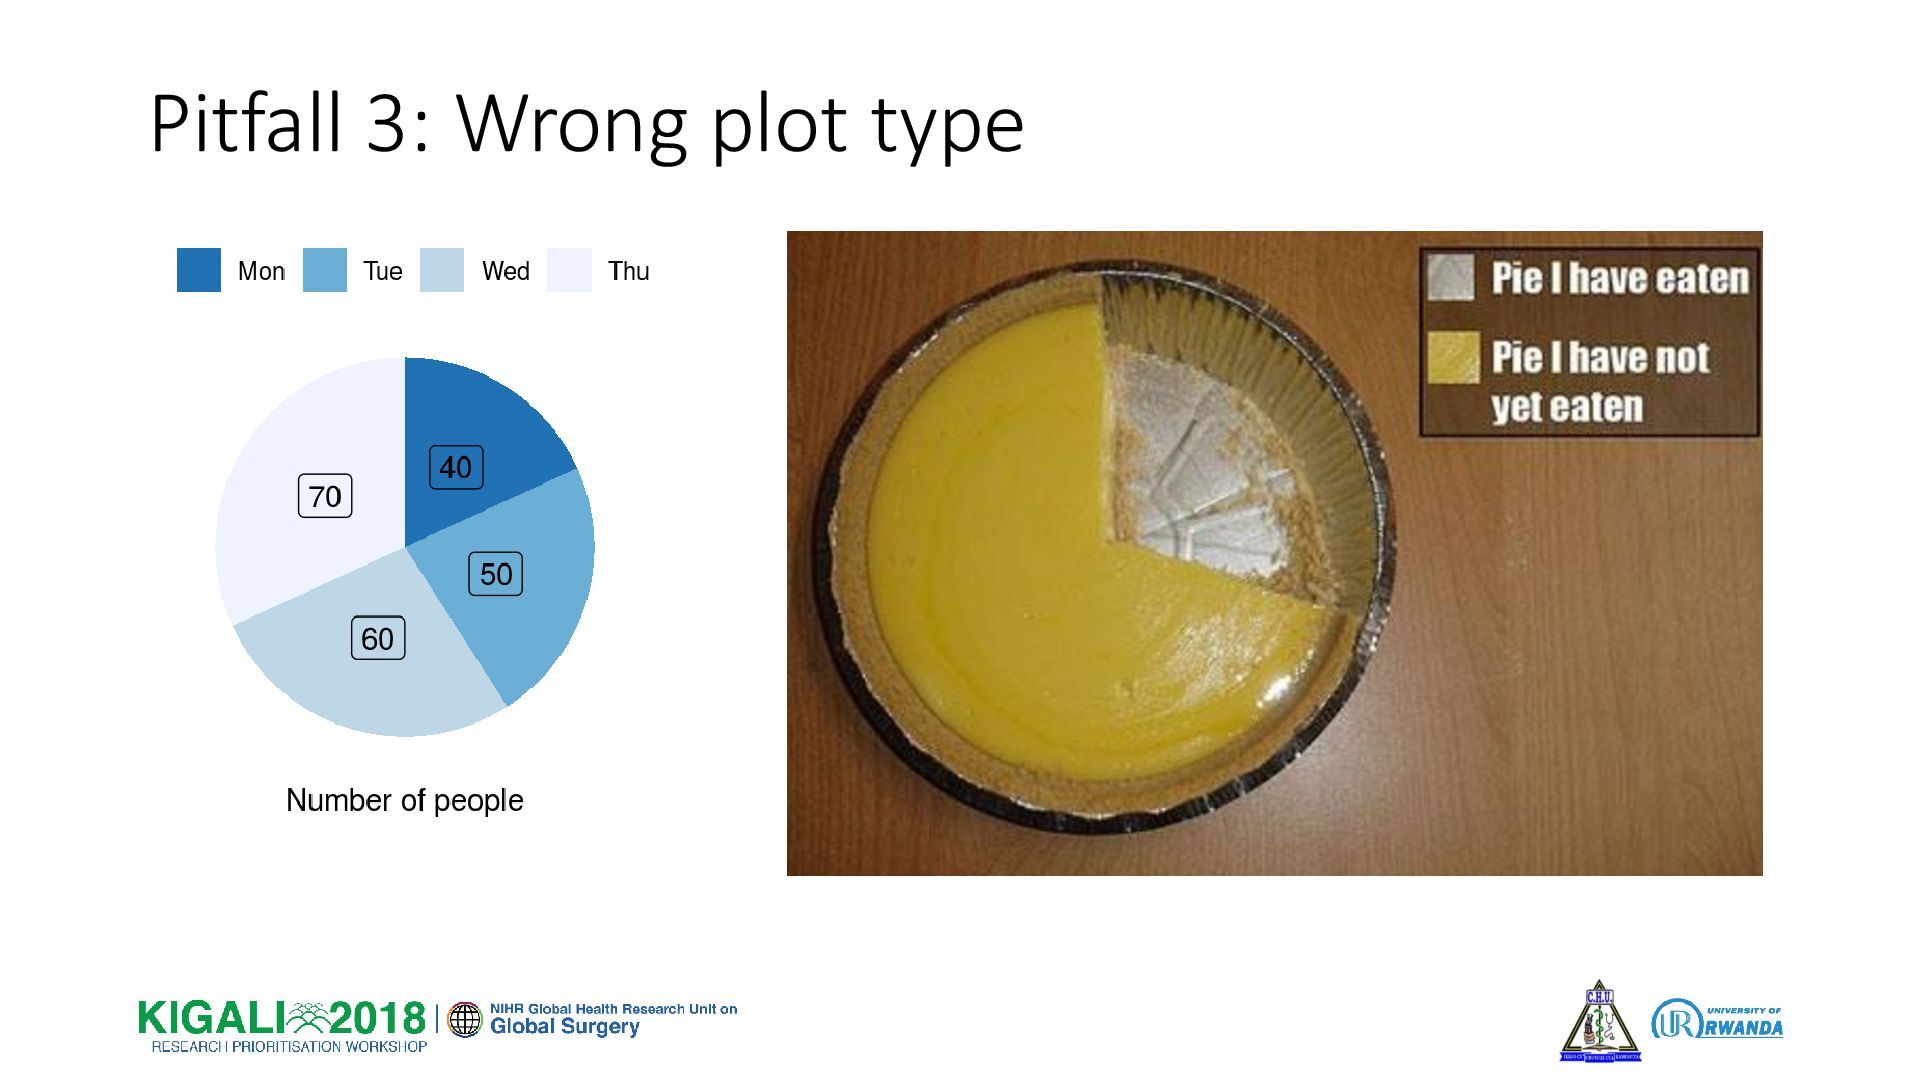
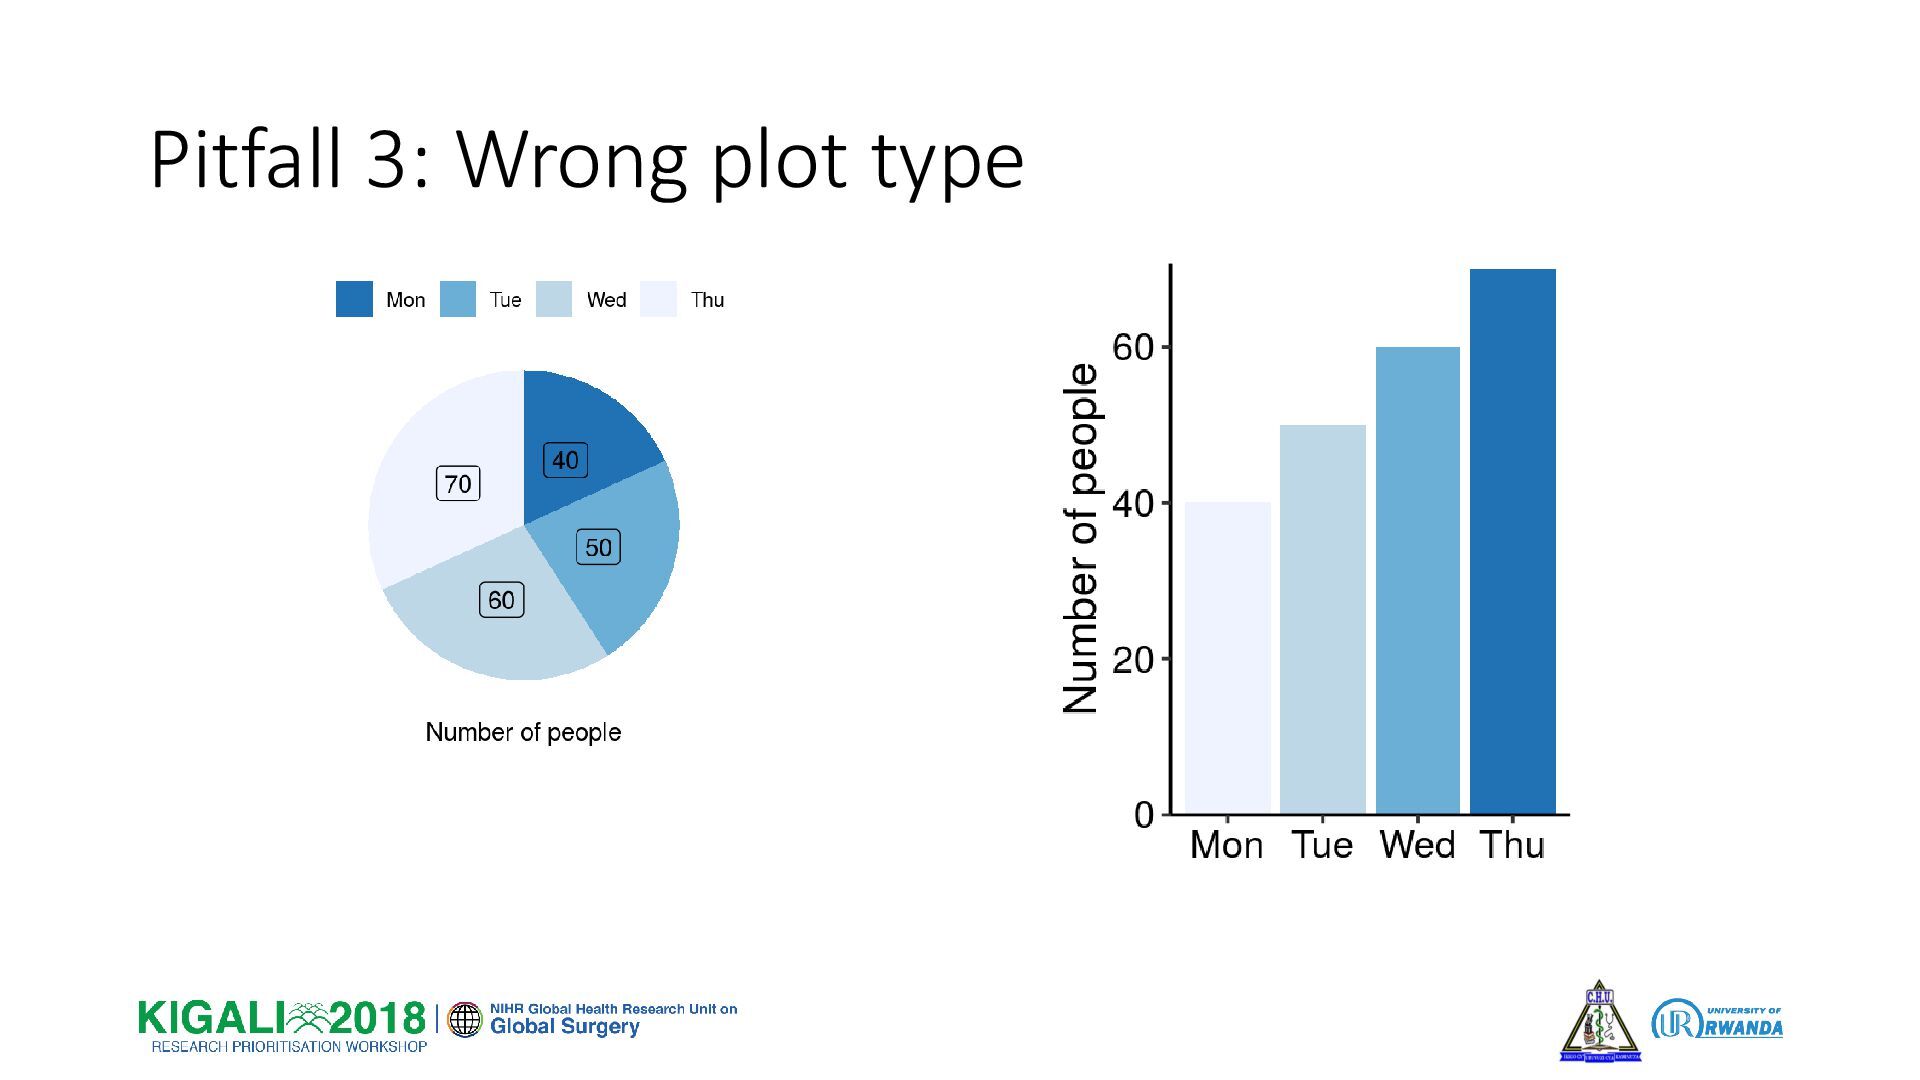
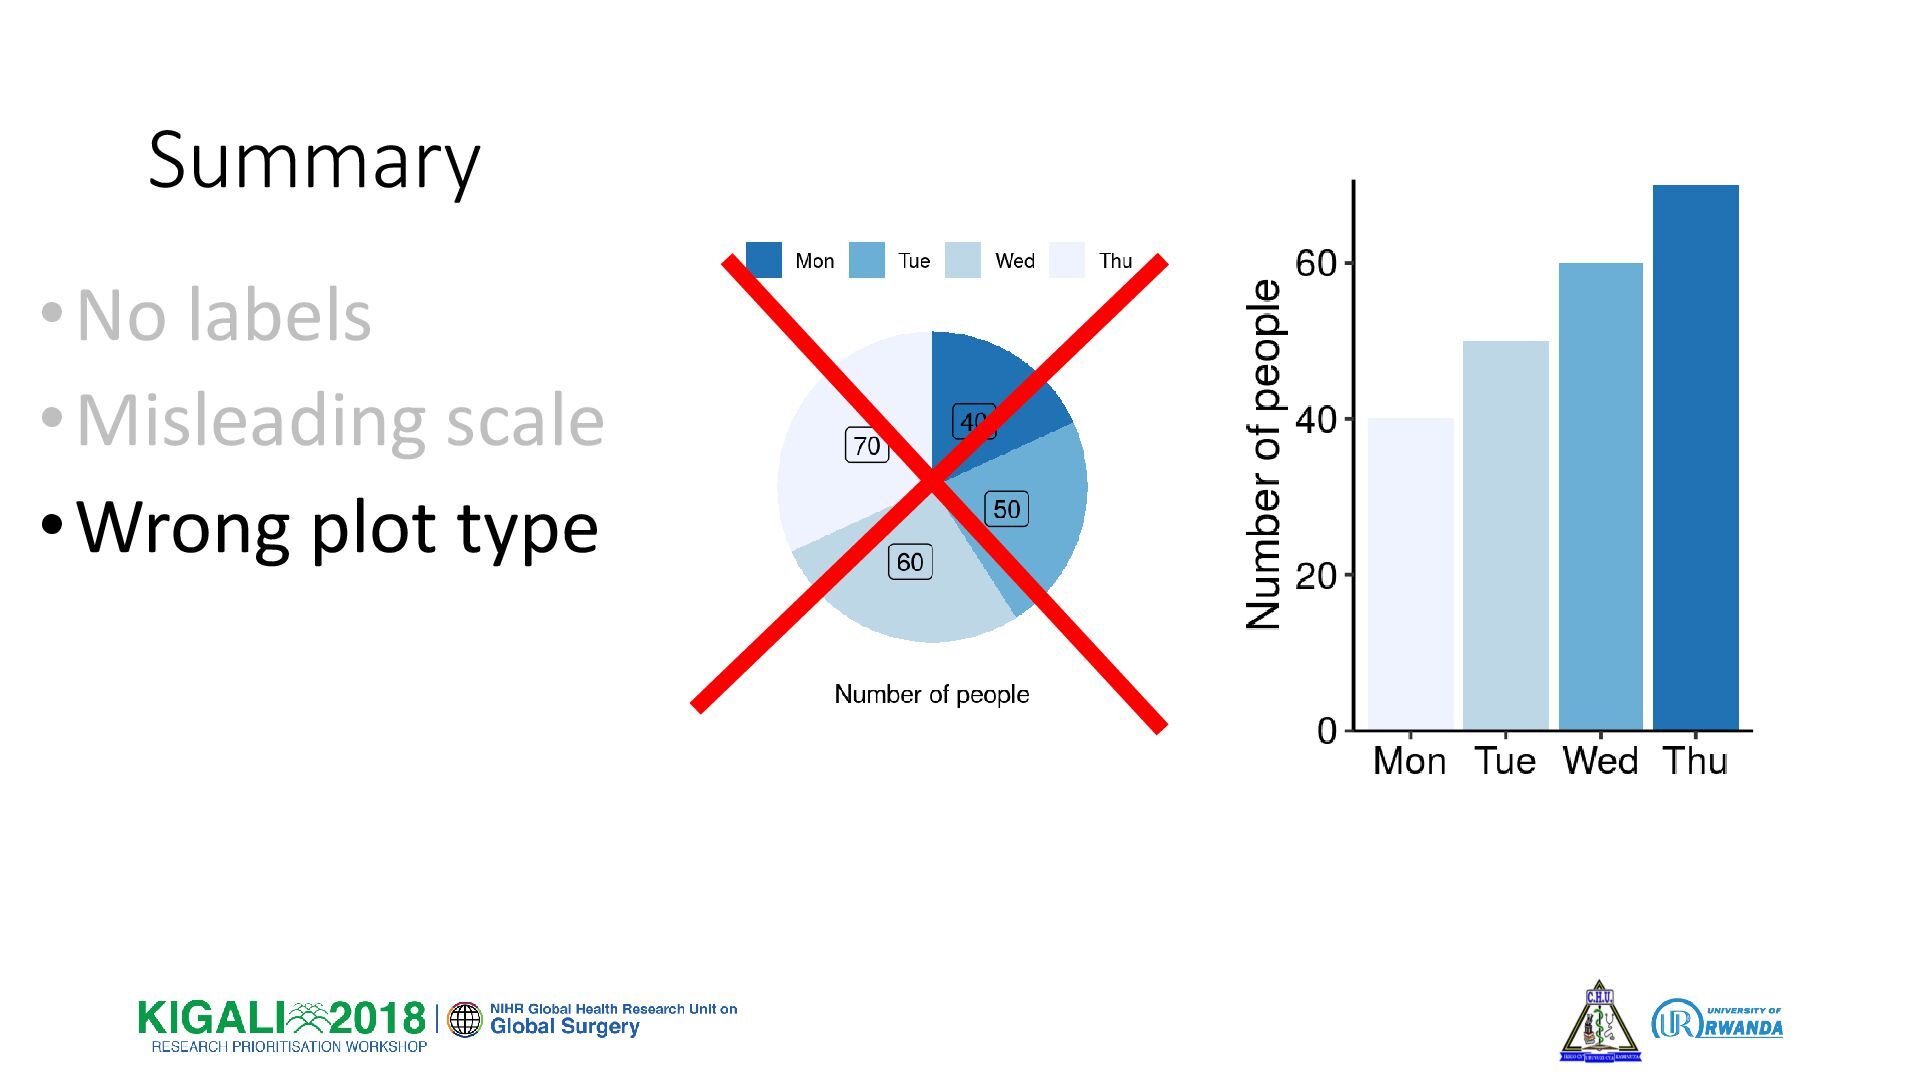
Pitfall 3: Wrong plot type
Pitfall 3: Wrong plot type
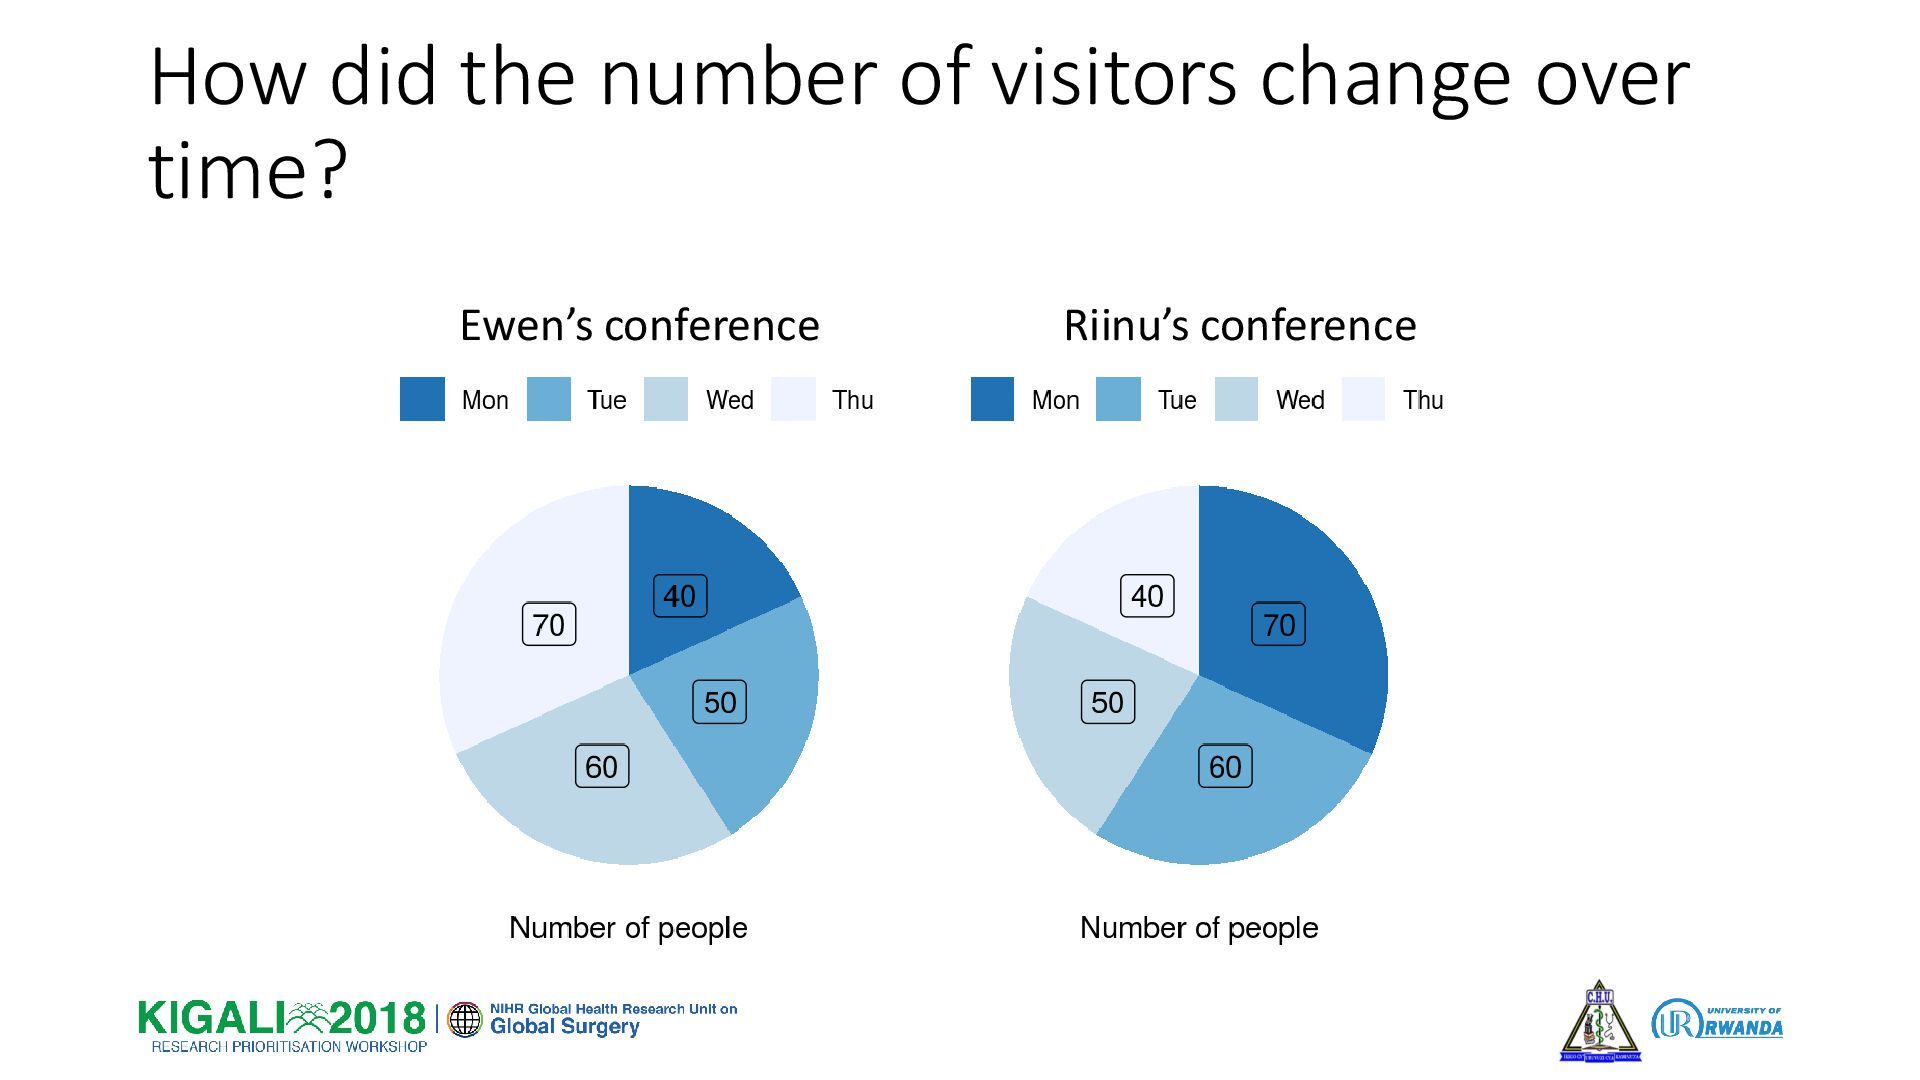
How did the number of visitors change over time? Ewen’s
conference Riinu’s conference
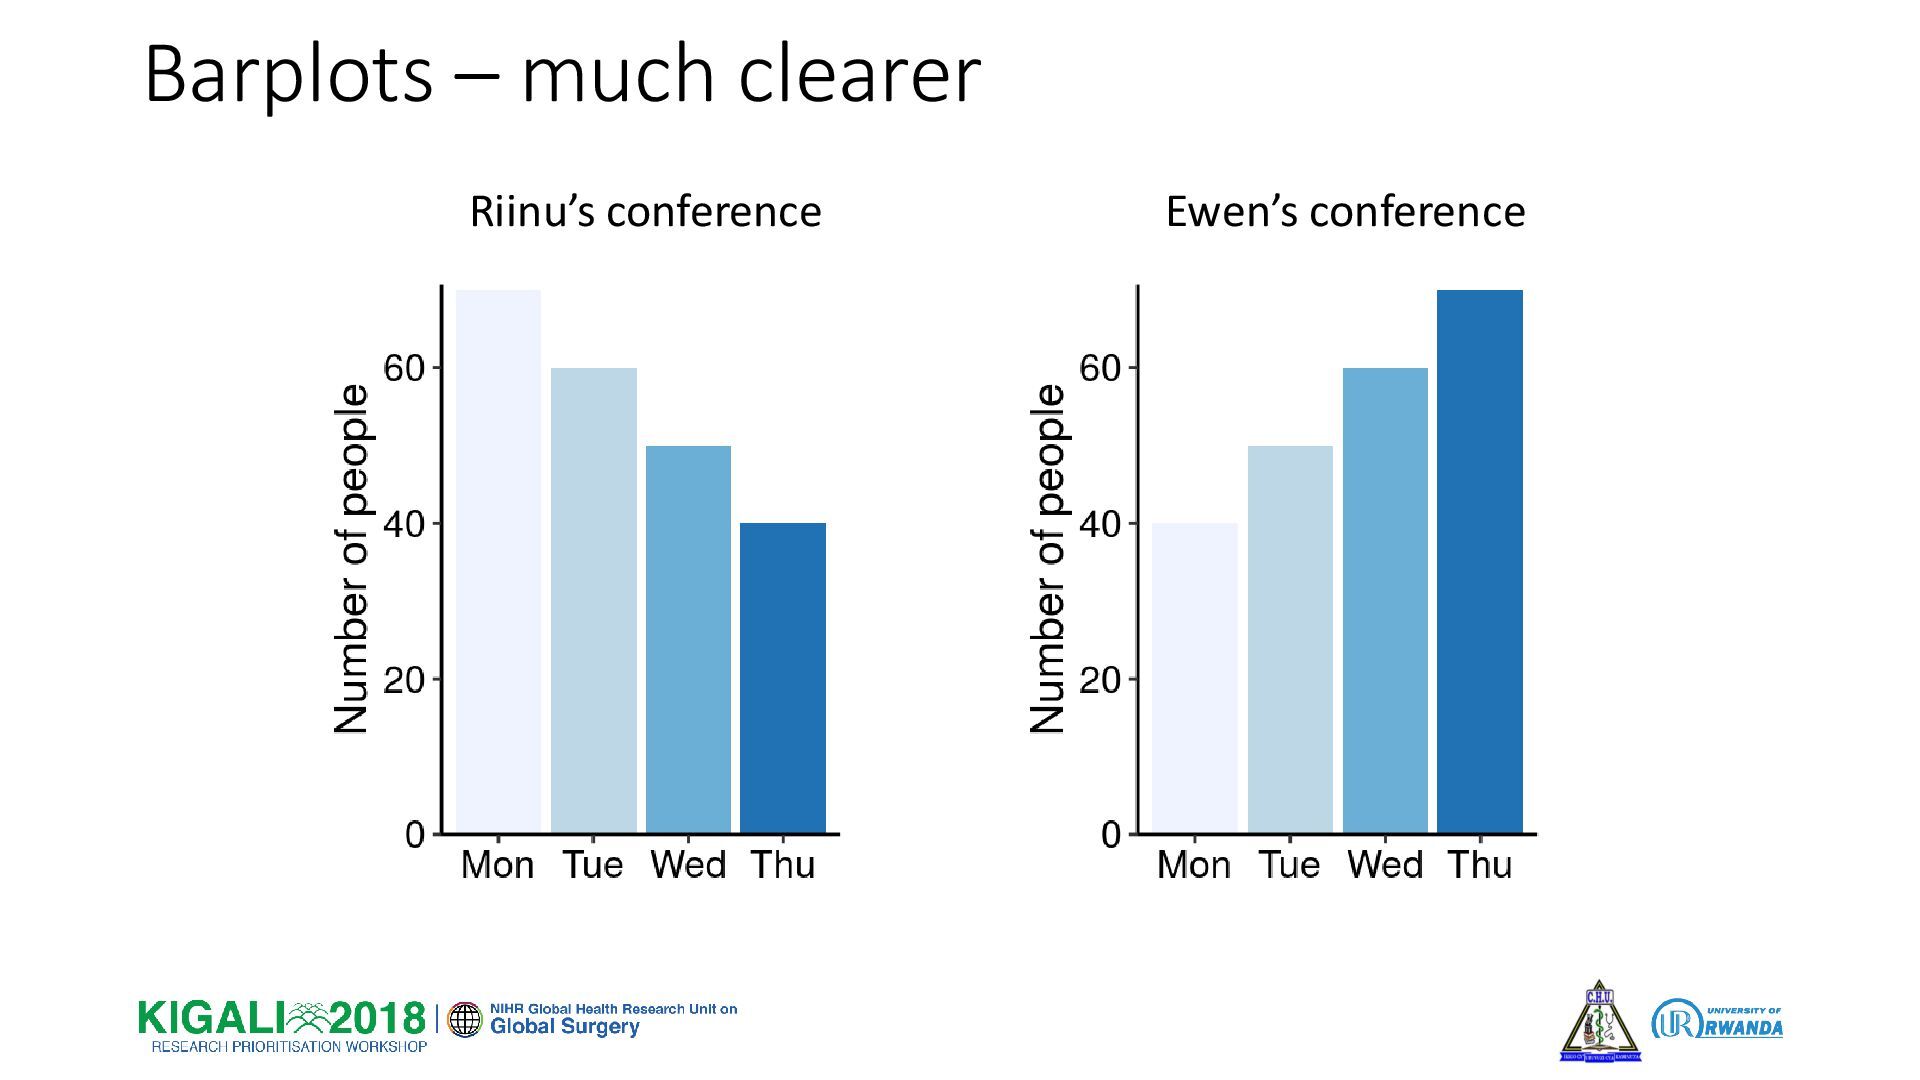
Barplots – much clearer Ewen’s conference Riinu’s conference
Pitfall 3: Wrong plot type
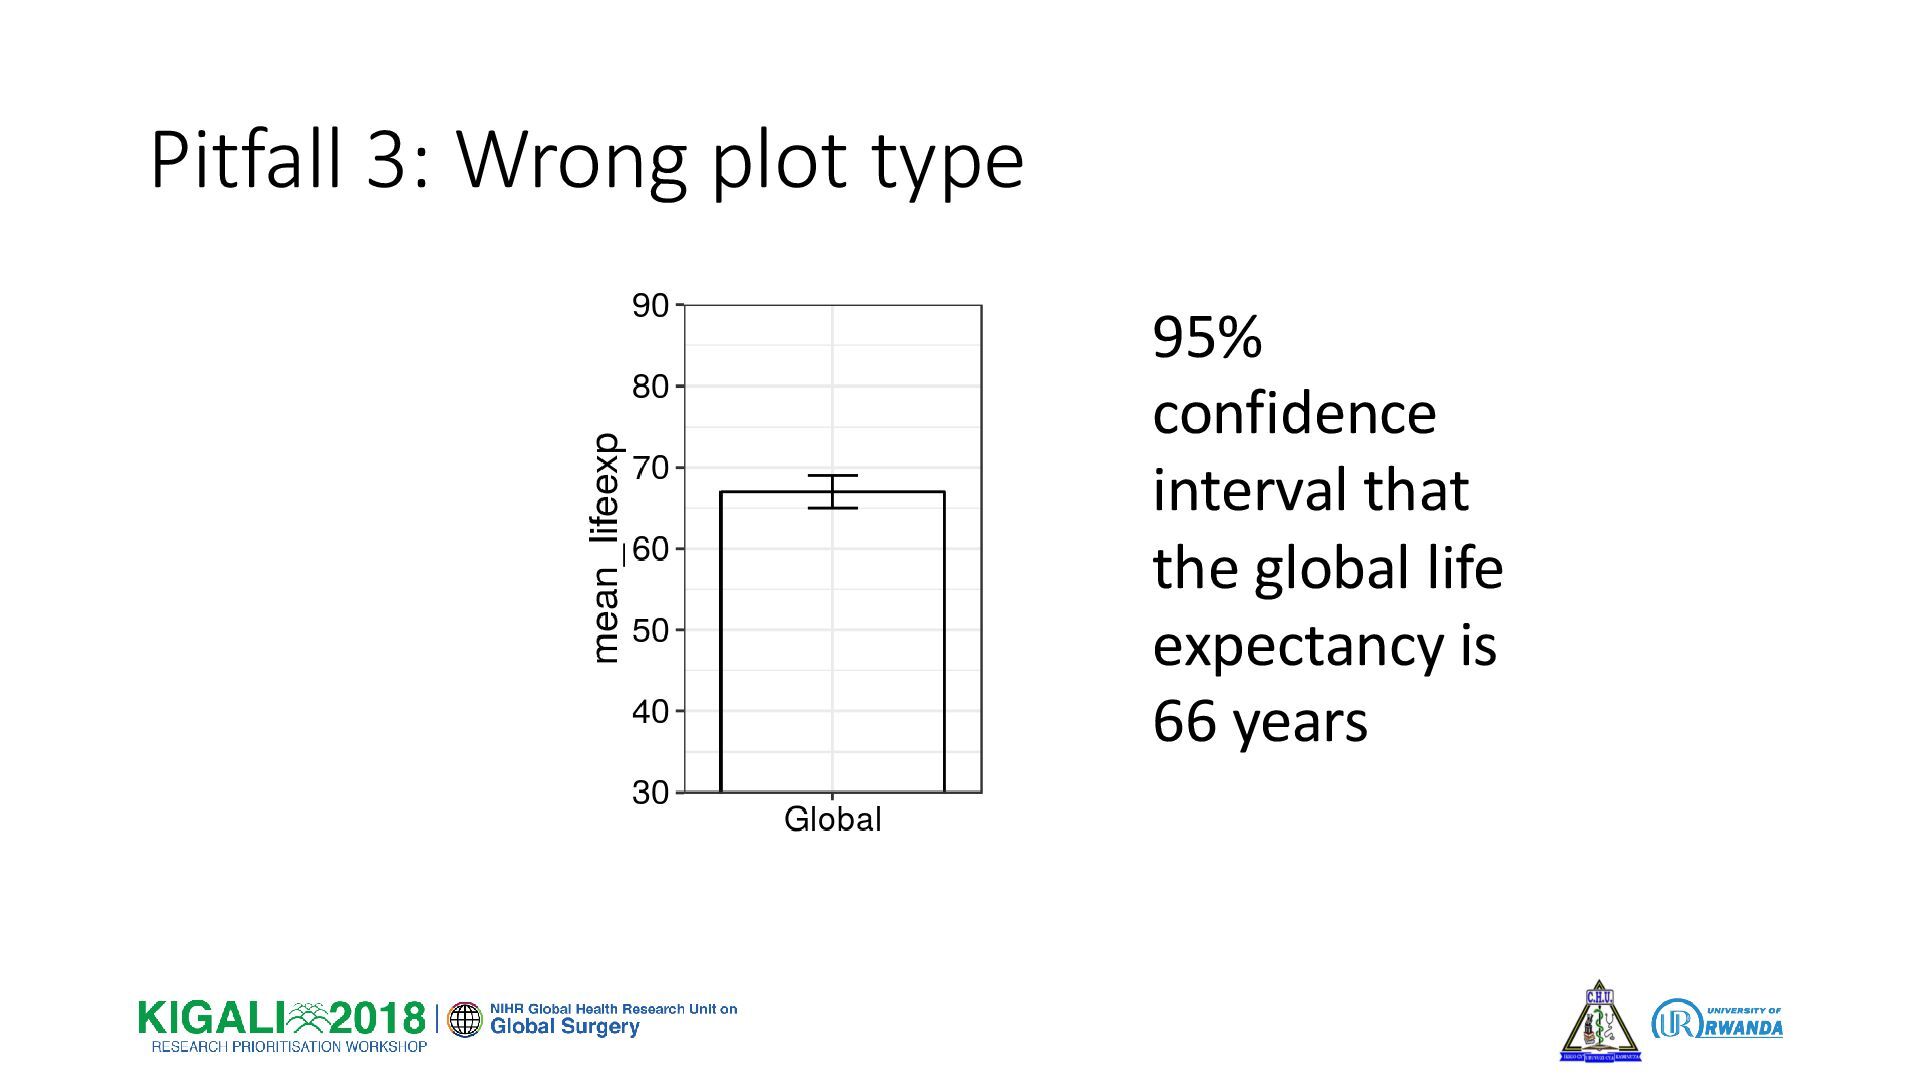
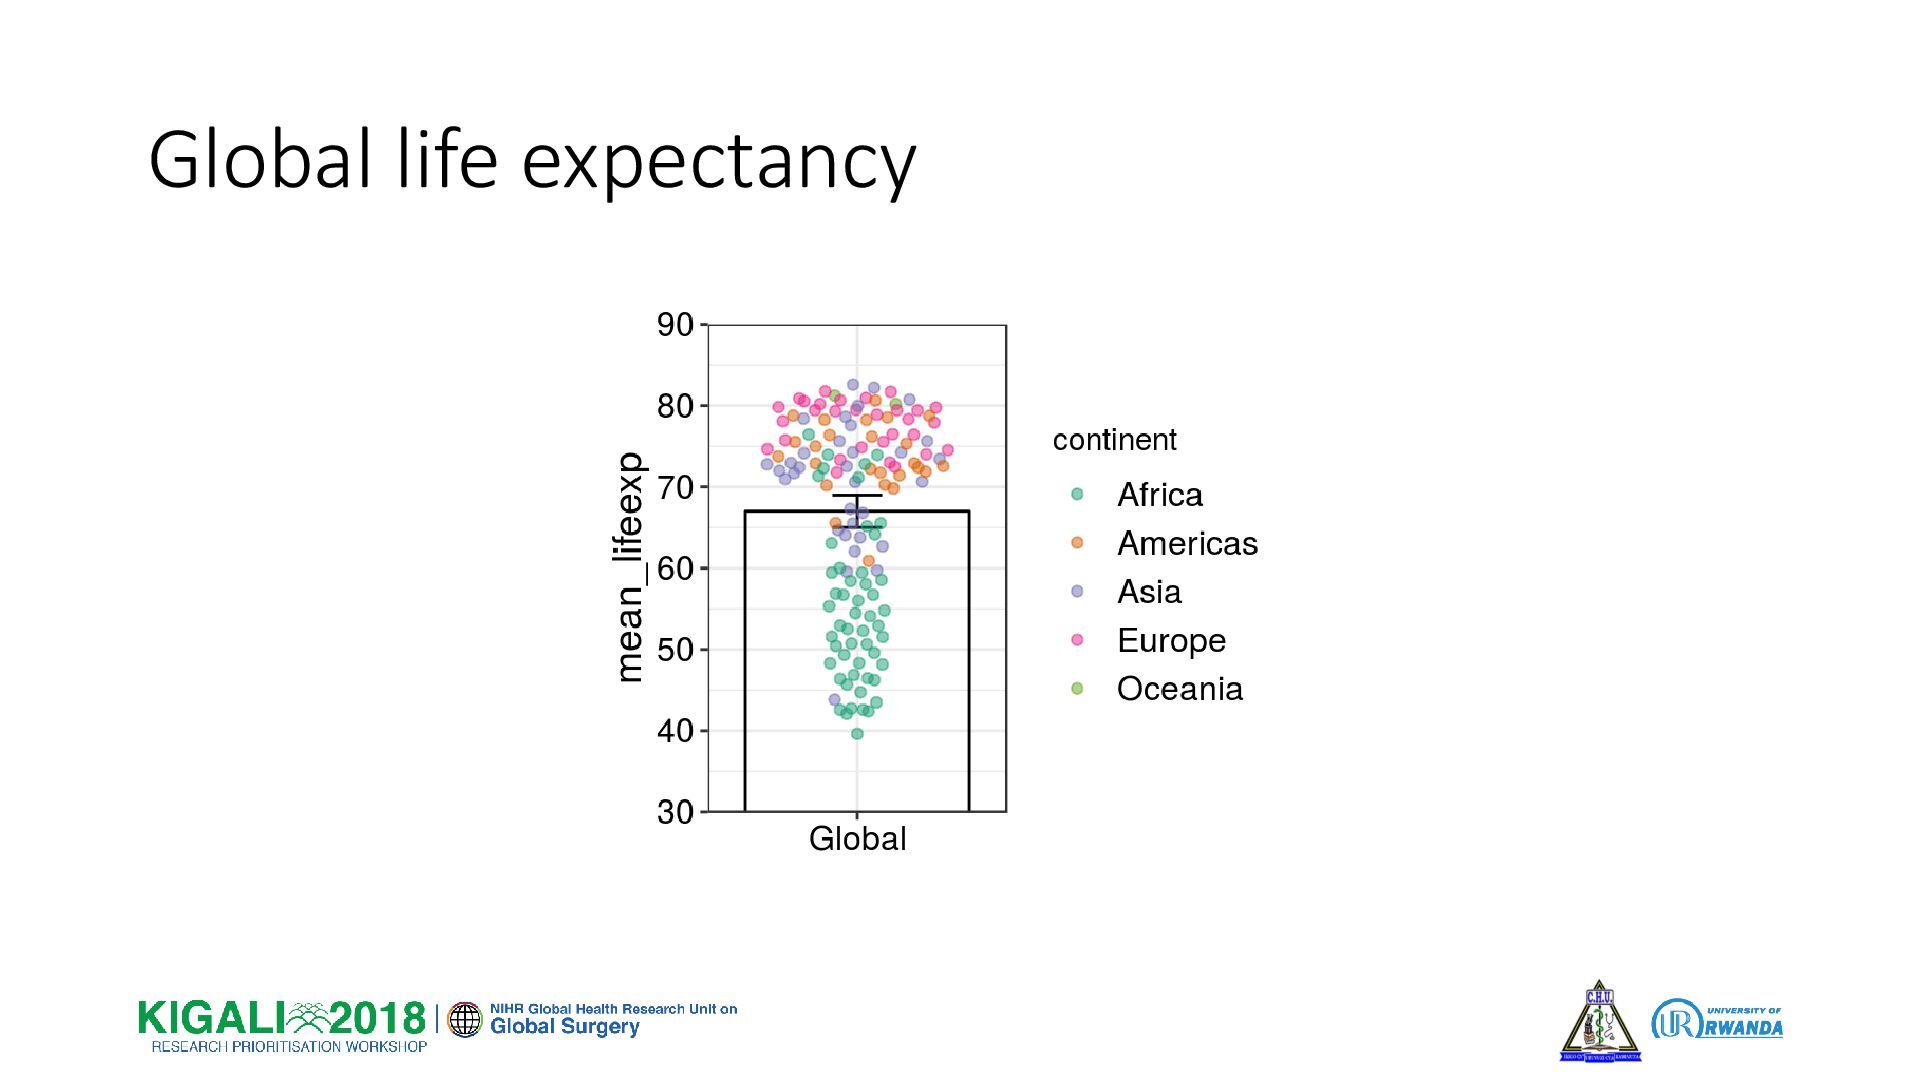
Pitfall 3: Wrong plot type 95% confidence interval that the
global life expectancy is 66 years
Global life expectancy
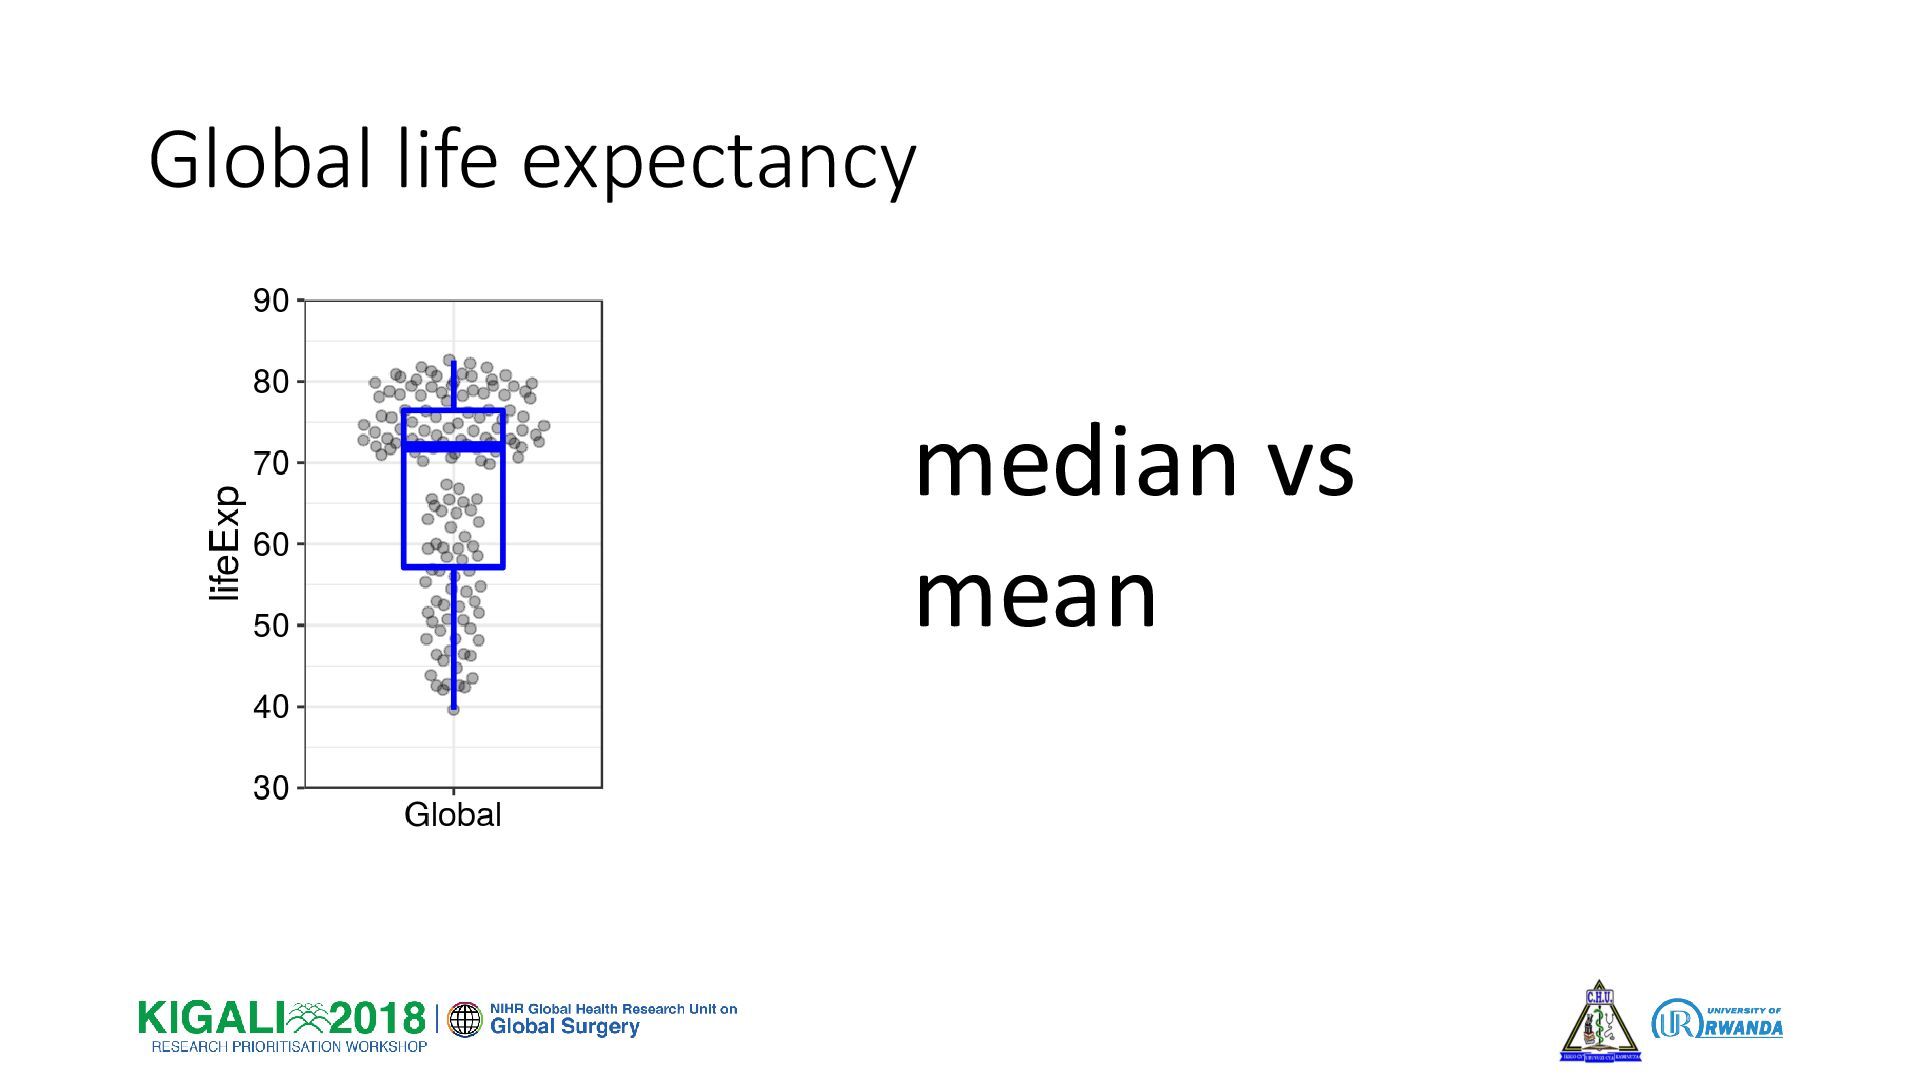
Global life expectancy median vs mean
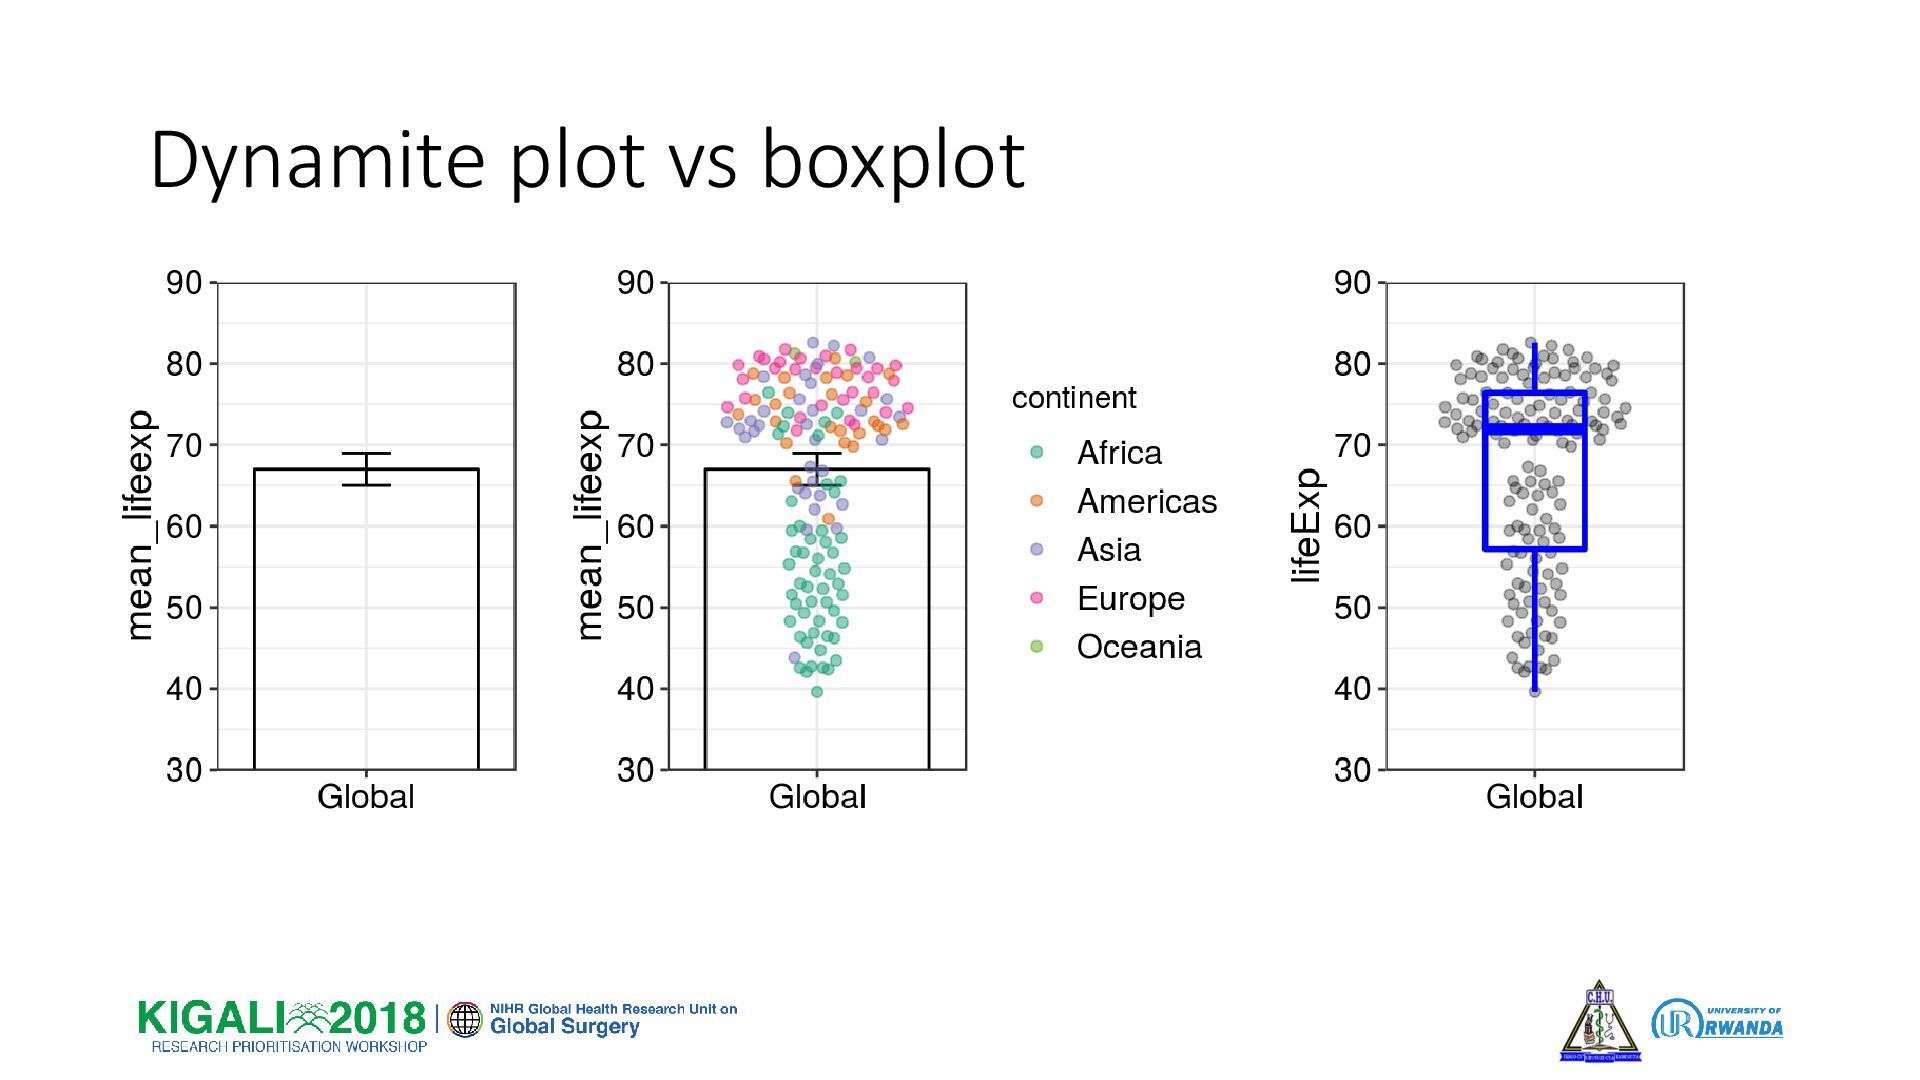
Dynamite plot vs boxplot
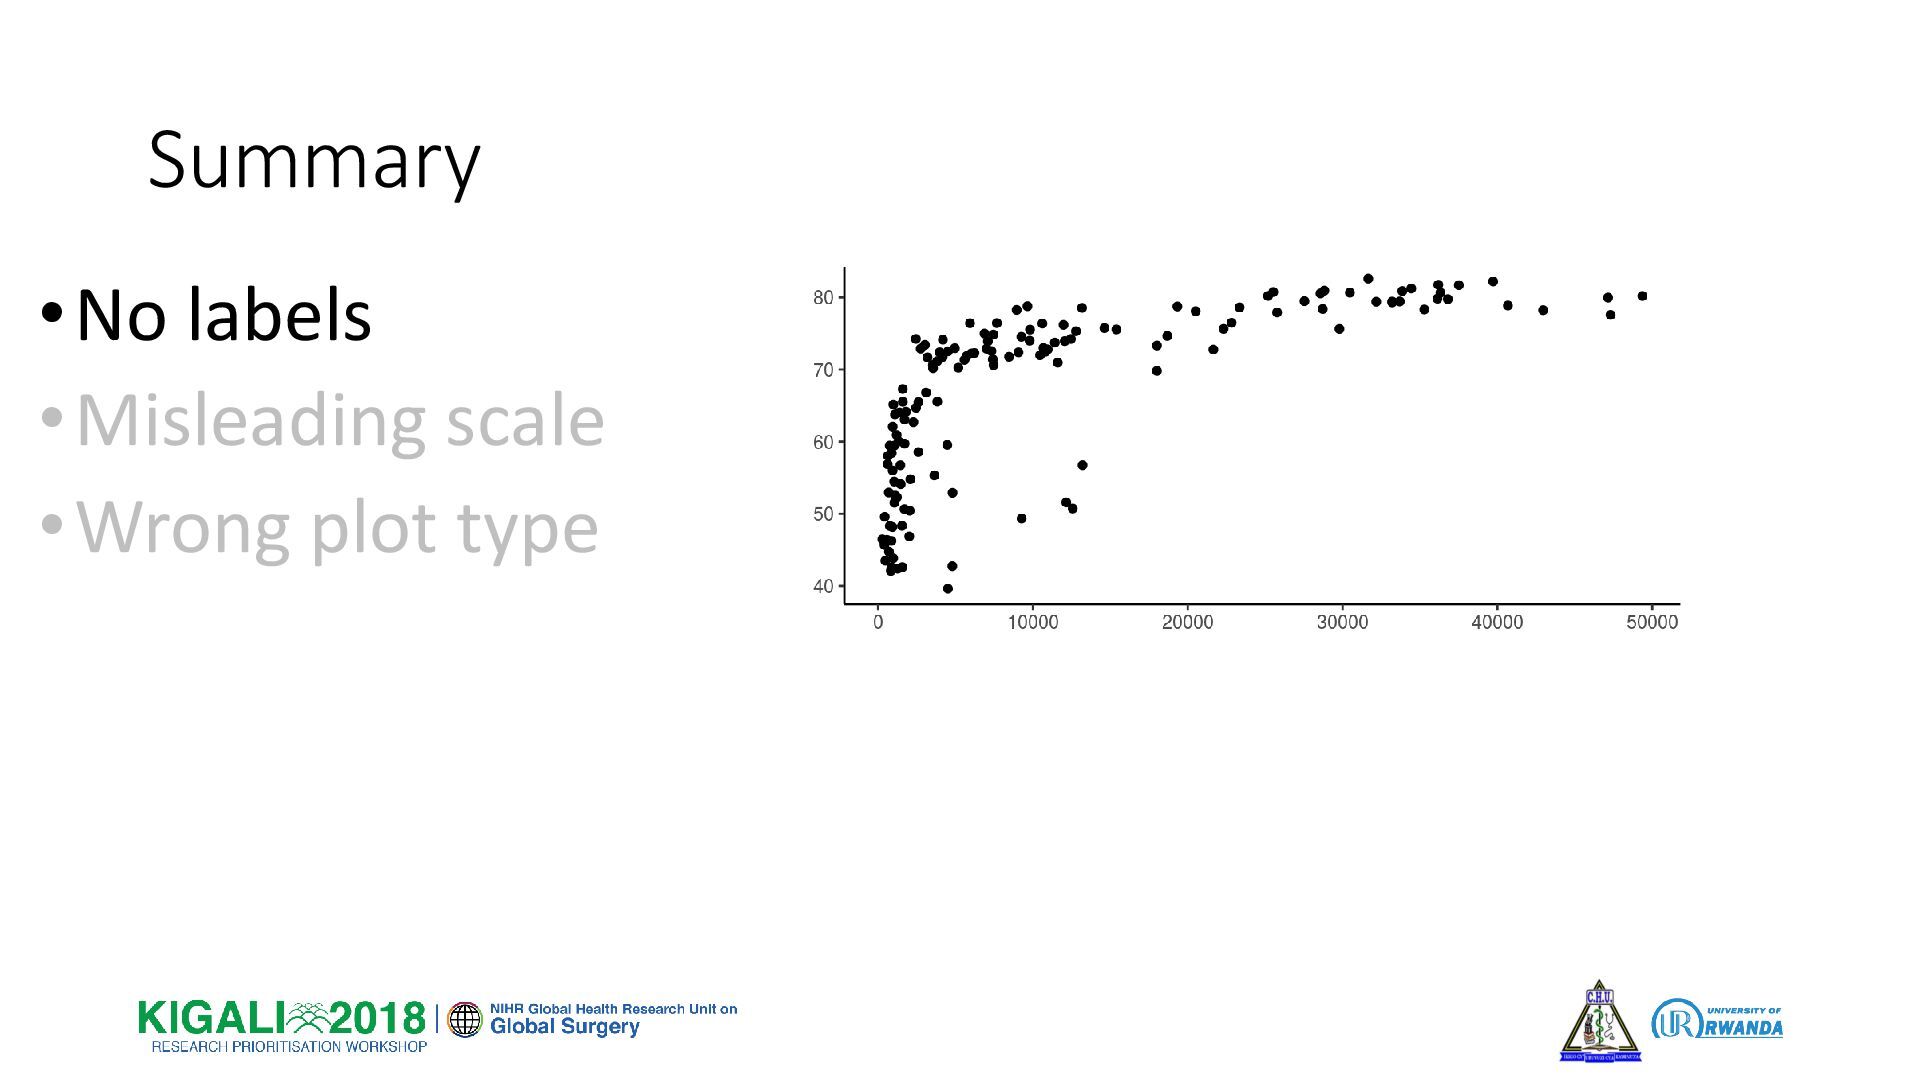
Summary •No labels •Misleading scale •Wrong plot type
Summary •No labels •Misleading scale •Wrong plot type
Summary •No labels •Misleading scale •Wrong plot type