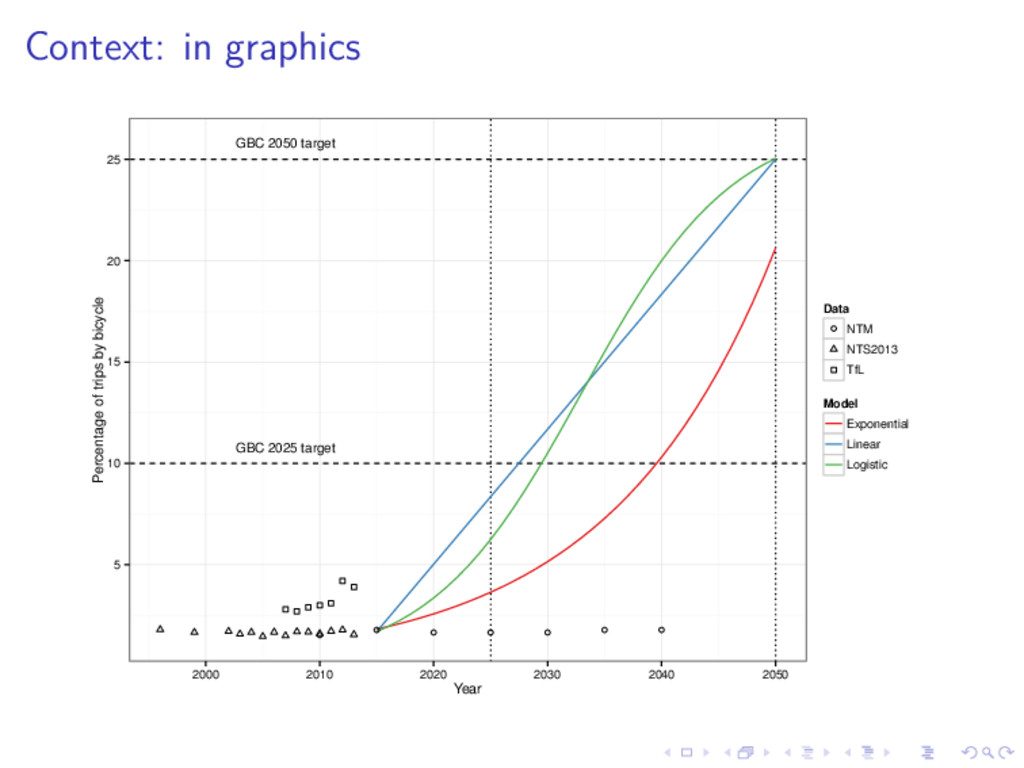
for cycling Since then there has been little commitment to cycling from main political parties of DfT Parliamentary Question tabled by CTC revealed complete lack of ambition for cycling the the National Transport Model DfT is currently updating its handling of cycling, but it will likely fall short of the vision needed to transform cycling in UK This research provides detail in space, time and demographics of how the shift to cycling could look in the coming years
(distance, mode, spatial and temporal variables) Avoids distinction between ‘cyclists’ and ‘non-cyclists’ Scenarios are ‘top down’ overall but assignment ‘bottom up’ Focus on stages Outputs: increase in km cycled per person by place and time; concomitant decrease in driving
bicycle nationwide 2. Allocation of stages to individuals depending on distance, mode and socio-demographic variables 3. Disaggregate by Local Authority 4. Ouput results into format useable by health and transport economists to estimate monetary savings
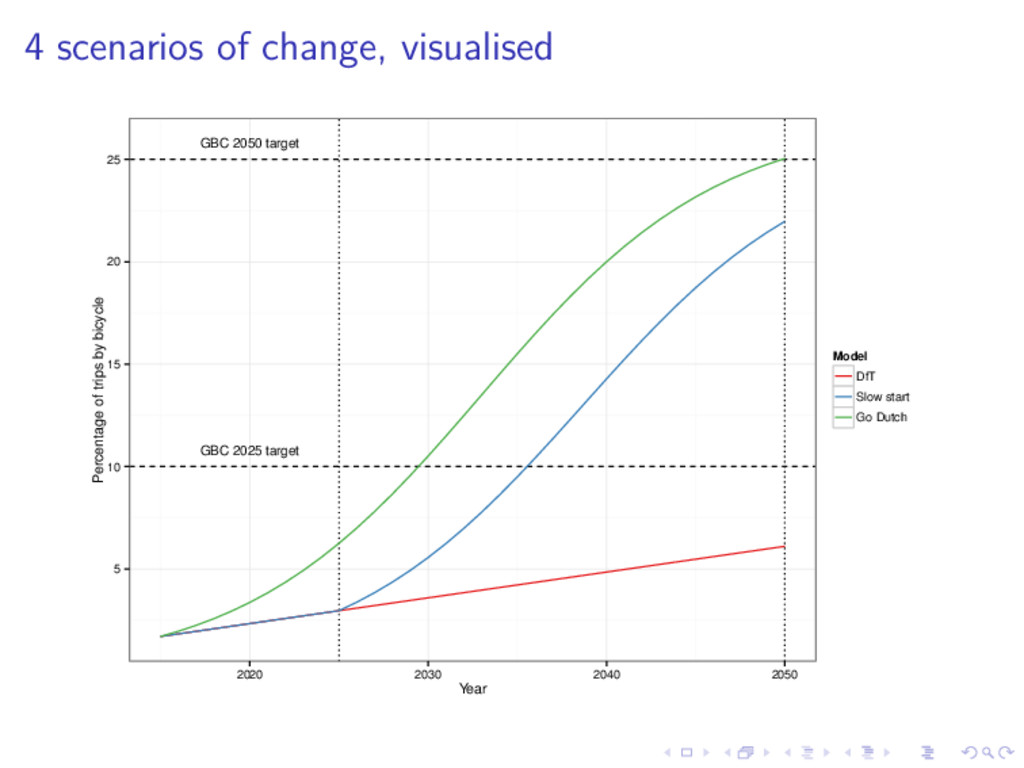
stages made by bicycle to 2026 Slow start: DfT until 2026 and acceleration to meet GBC by 2050 ‘Go Dutch’: cycling uptake in a car-dominated world ‘Ecotechnic’: demand restraint and active travel
Travel Survey (NTS) is measured in stages and trips. Data in the NTS is contains information on households, vehicles, individuals, trips and stages. The NTS is the basis of the future scenarios produced by the Department for Transport (DfT) and in this study. We therefore begin with current data from the NTS and move forward Sample of individuals taken from NTS forms basis of weekly activity patterns, to be translated into health impacts
elements of the NTS (7.8 vs 9.1 miles) A logical basis against which to model modal shift. DfT projects doubling in the number of stages by bicycle by 2025. Assume (for now) that stage distances and total number remain constant
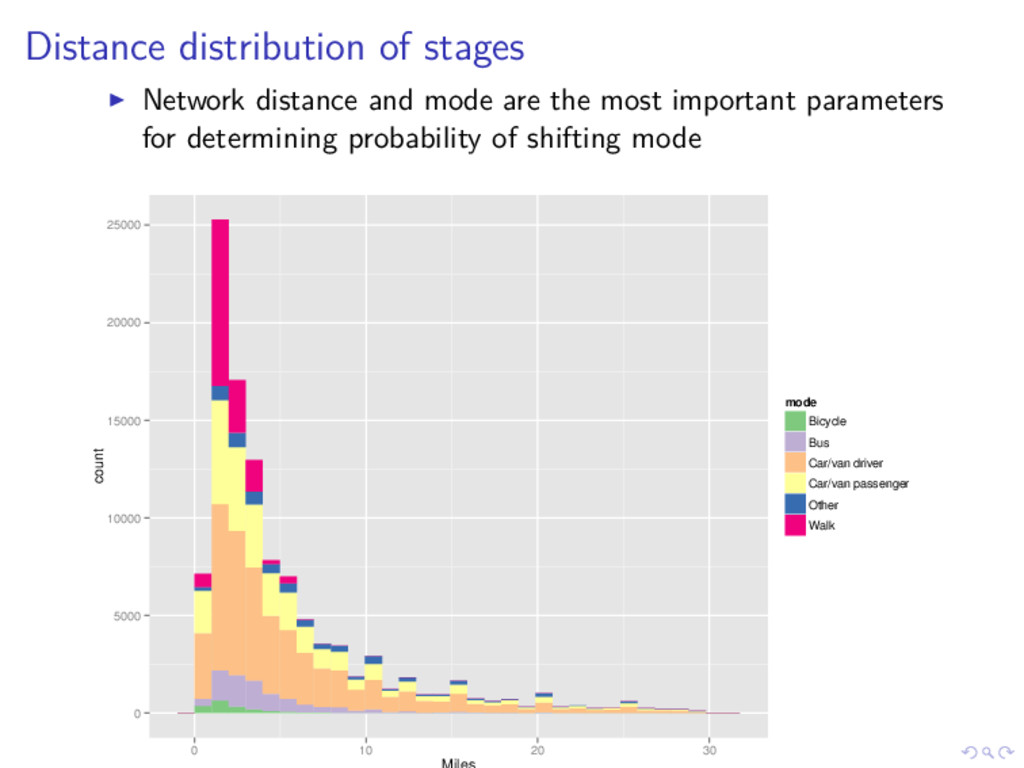
most important parameters for determining probability of shifting mode 0 5000 10000 15000 20000 25000 0 10 20 30 count mode Bicycle Bus Car/van driver Car/van passenger Other Walk
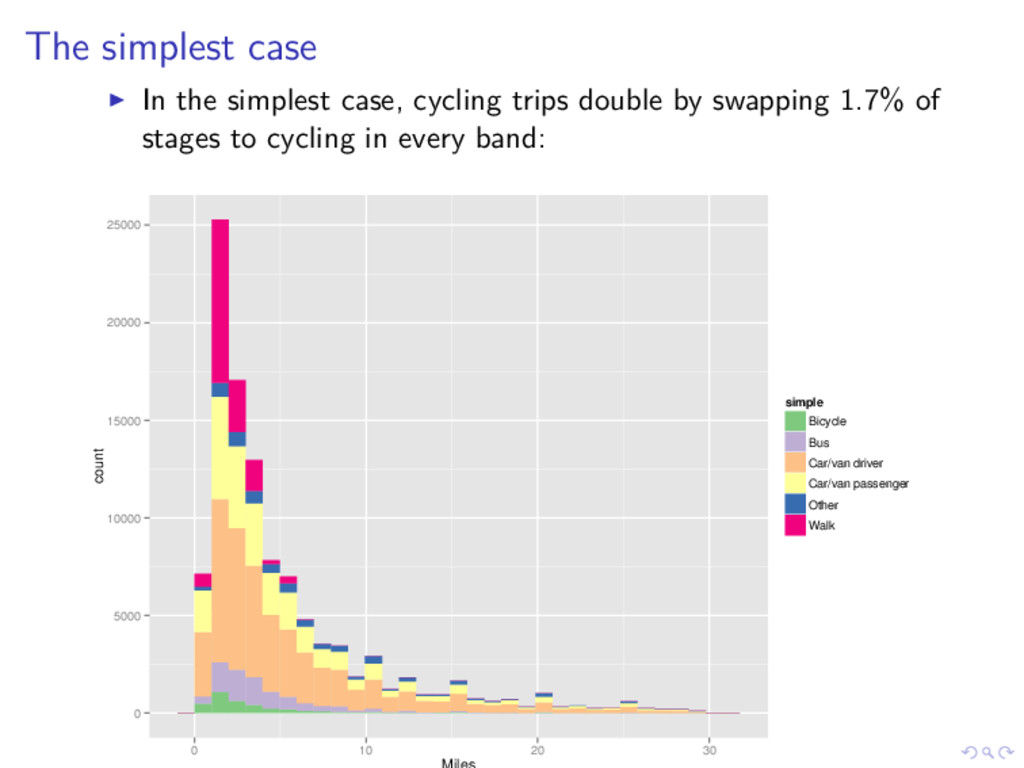
by swapping 1.7% of stages to cycling in every band: 0 5000 10000 15000 20000 25000 0 10 20 30 count simple Bicycle Bus Car/van driver Car/van passenger Other Walk
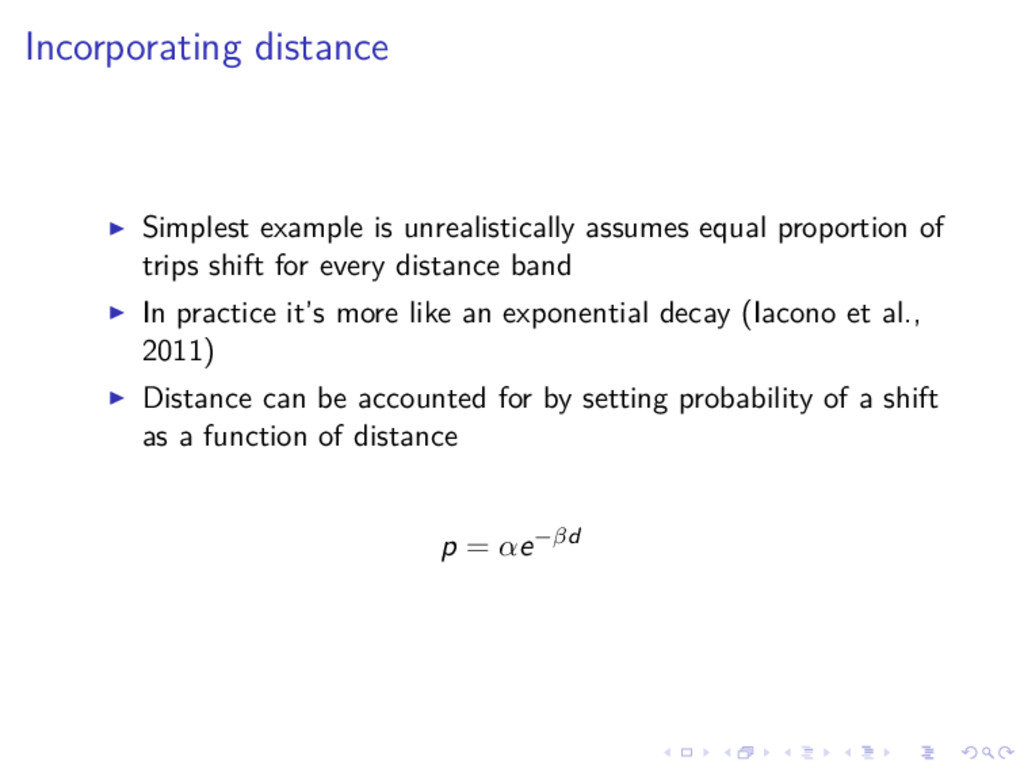
trips shift for every distance band In practice it’s more like an exponential decay (Iacono et al., 2011) Distance can be accounted for by setting probability of a shift as a function of distance p = αe−βd
used: α = 0.4, β = 0.2 for bicycle trips These parameters can and should be updated with better evidence Distance decay, β is dependent on trip purpose, kept constant for now
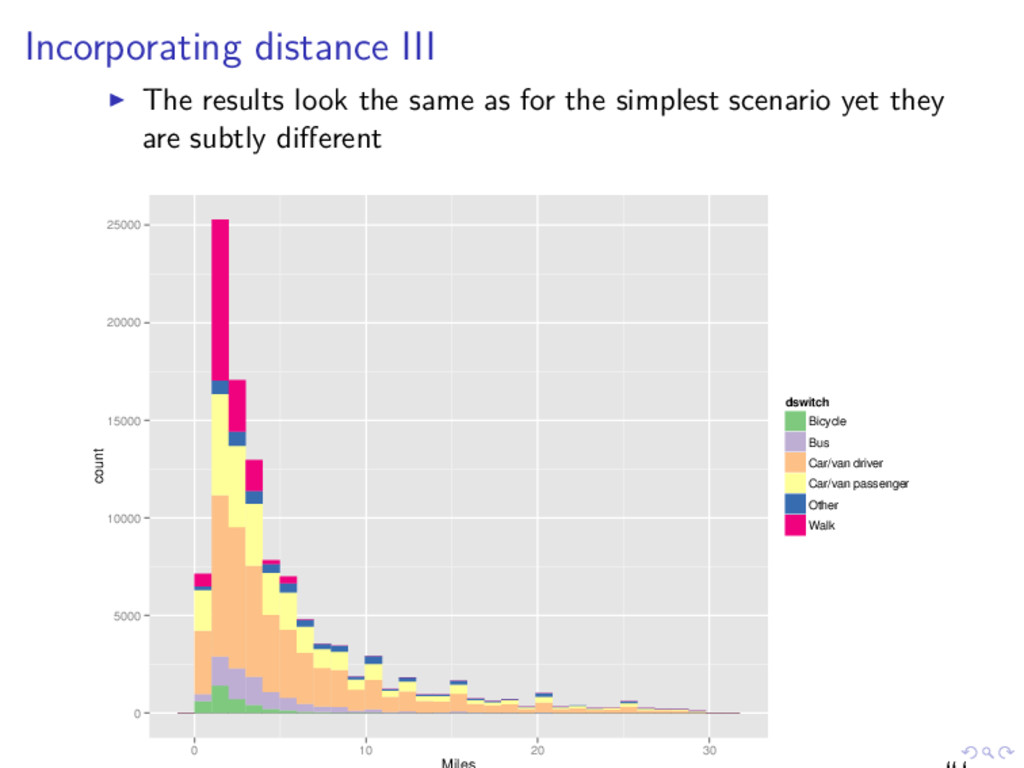
the simplest scenario yet they are subtly different 0 5000 10000 15000 20000 25000 0 10 20 30 count dswitch Bicycle Bus Car/van driver Car/van passenger Other Walk
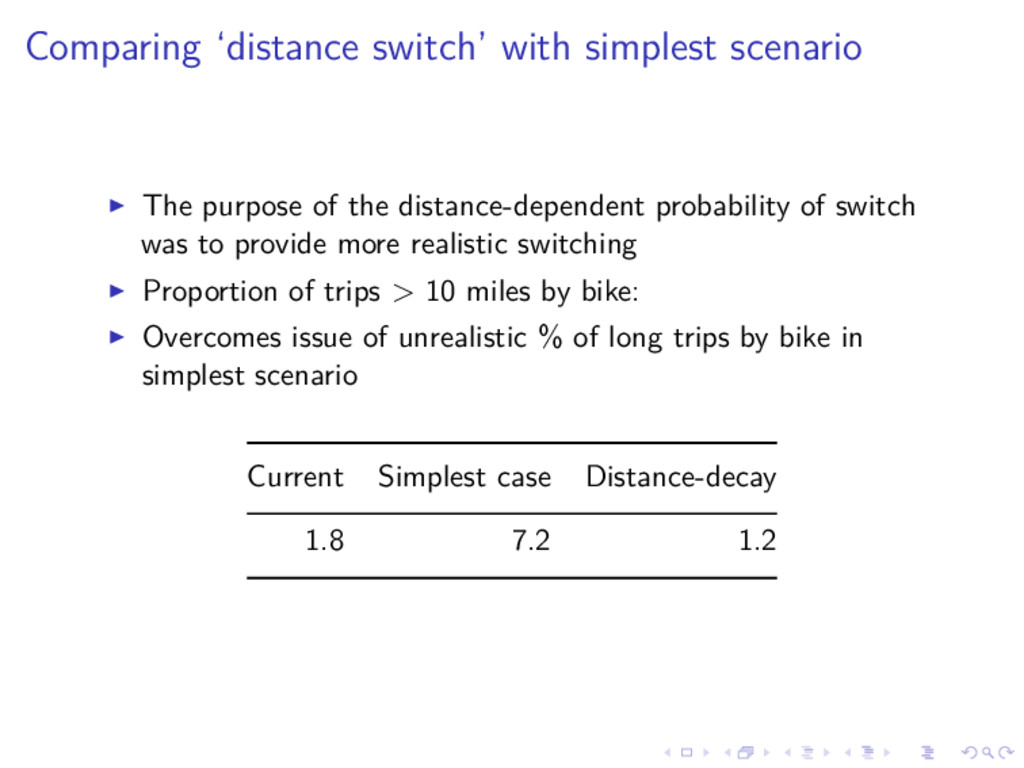
distance-dependent probability of switch was to provide more realistic switching Proportion of trips > 10 miles by bike: Overcomes issue of unrealistic % of long trips by bike in simplest scenario Current Simplest case Distance-decay 1.8 7.2 1.2
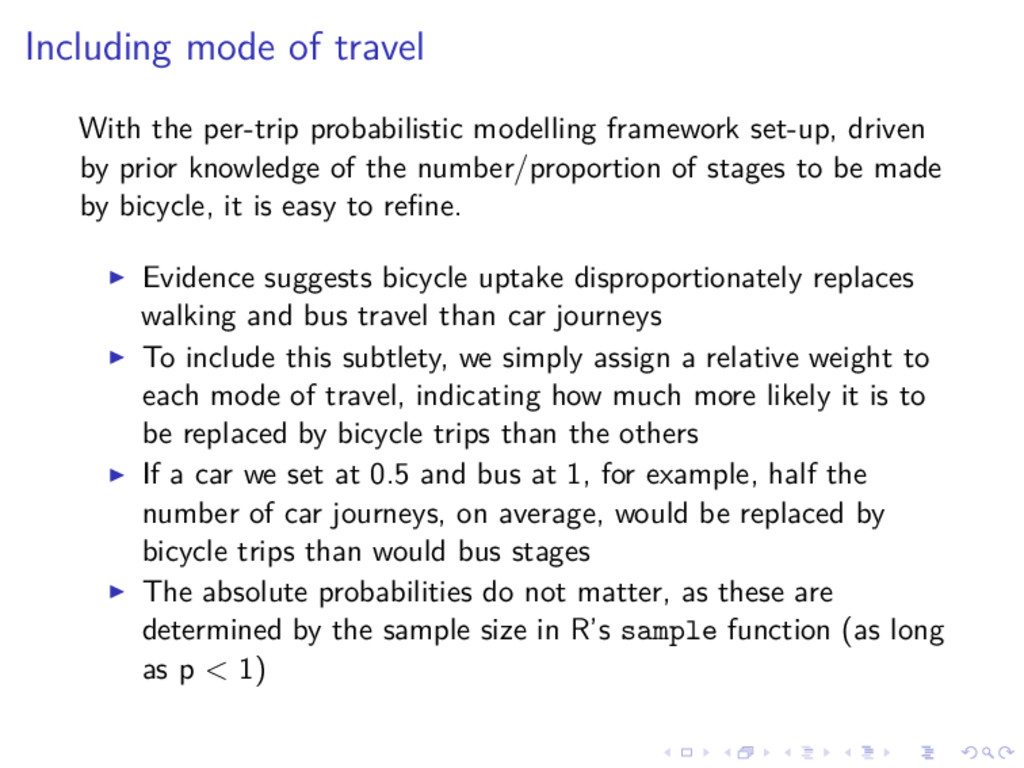
set-up, driven by prior knowledge of the number/proportion of stages to be made by bicycle, it is easy to refine. Evidence suggests bicycle uptake disproportionately replaces walking and bus travel than car journeys To include this subtlety, we simply assign a relative weight to each mode of travel, indicating how much more likely it is to be replaced by bicycle trips than the others If a car we set at 0.5 and bus at 1, for example, half the number of car journeys, on average, would be replaced by bicycle trips than would bus stages The absolute probabilities do not matter, as these are determined by the sample size in R’s sample function (as long as p < 1)
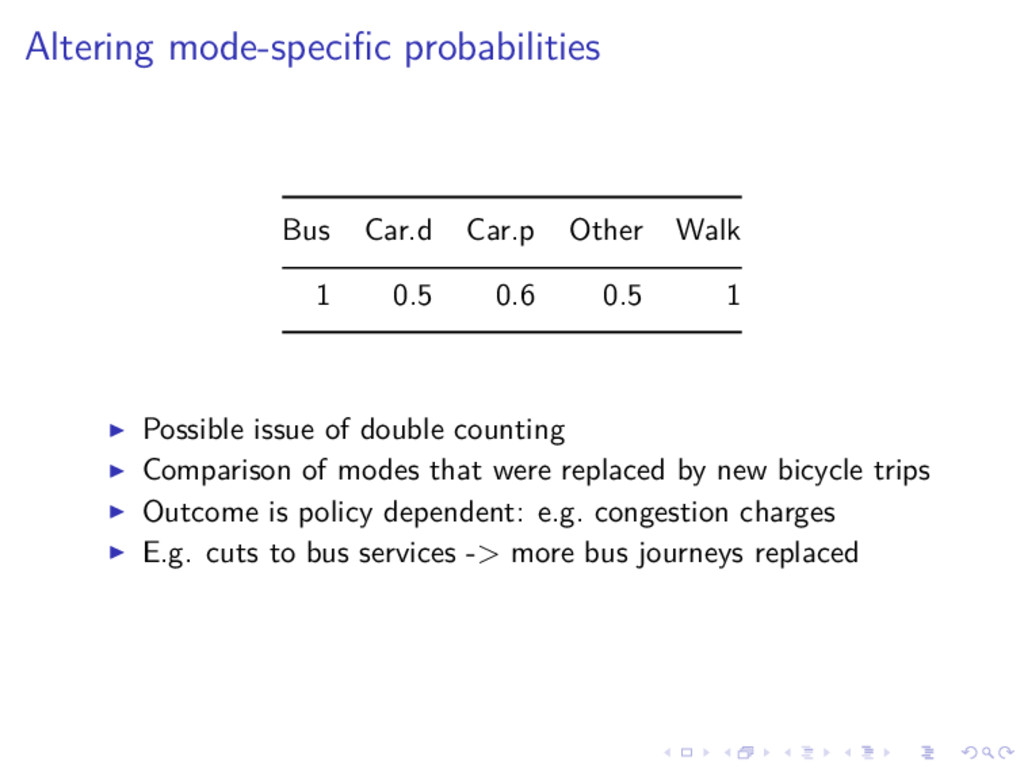
0.6 0.5 1 Possible issue of double counting Comparison of modes that were replaced by new bicycle trips Outcome is policy dependent: e.g. congestion charges E.g. cuts to bus services -> more bus journeys replaced
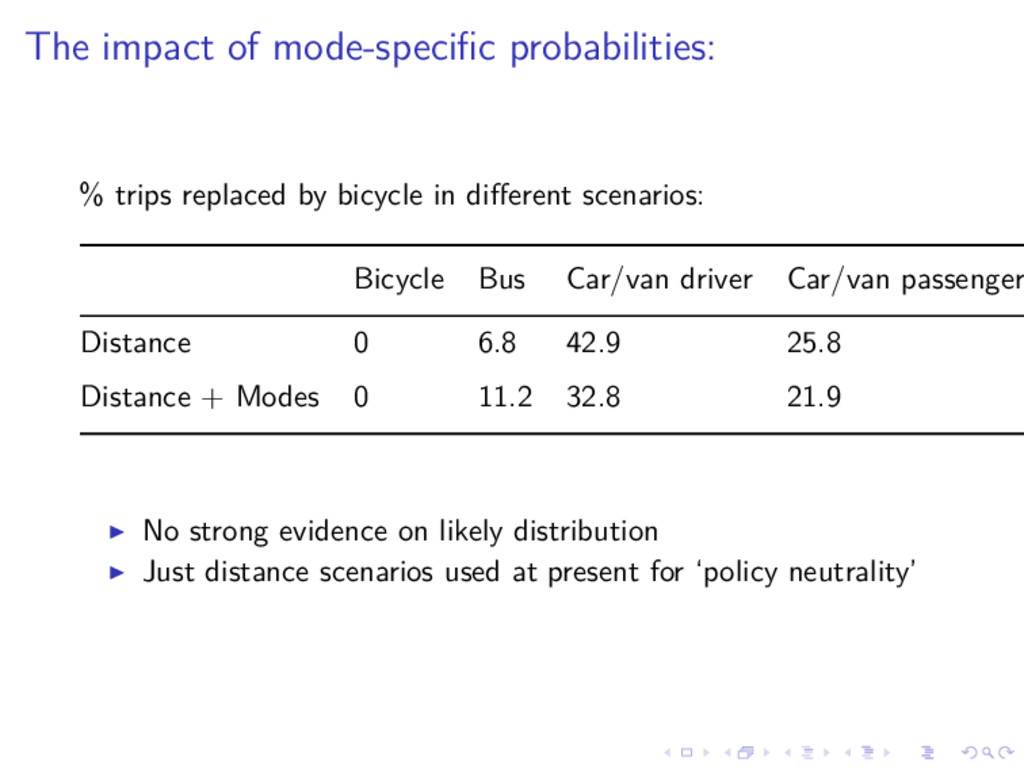
in different scenarios: Bicycle Bus Car/van driver Car/van passenger Distance 0 6.8 42.9 25.8 Distance + Modes 0 11.2 32.8 21.9 No strong evidence on likely distribution Just distance scenarios used at present for ‘policy neutrality’
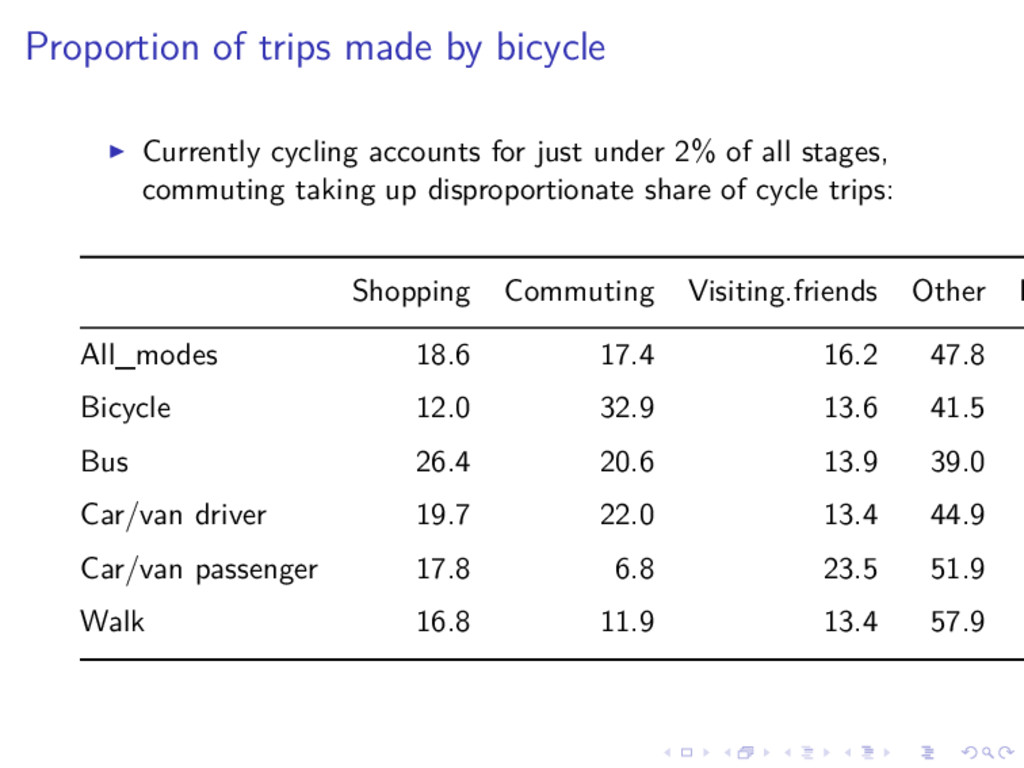
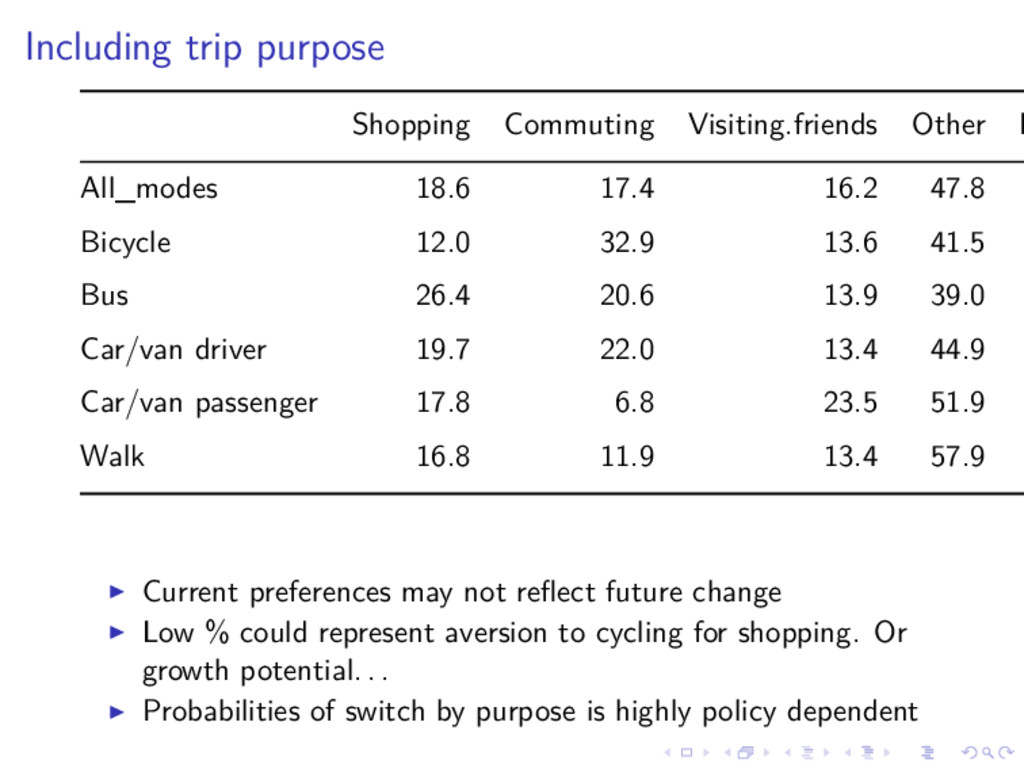
17.4 16.2 47.8 Bicycle 12.0 32.9 13.6 41.5 Bus 26.4 20.6 13.9 39.0 Car/van driver 19.7 22.0 13.4 44.9 Car/van passenger 17.8 6.8 23.5 51.9 Walk 16.8 11.9 13.4 57.9 Current preferences may not reflect future change Low % could represent aversion to cycling for shopping. Or growth potential. . . Probabilities of switch by purpose is highly policy dependent
settlements with poor cycle infrastructure Variability is a function of age: the young have been responsible for most growth in cycling in London and some elderly cannot cycle Large implications for health savings Strategy: modify probability of switching each stage to bicycle based on the age of the traveller
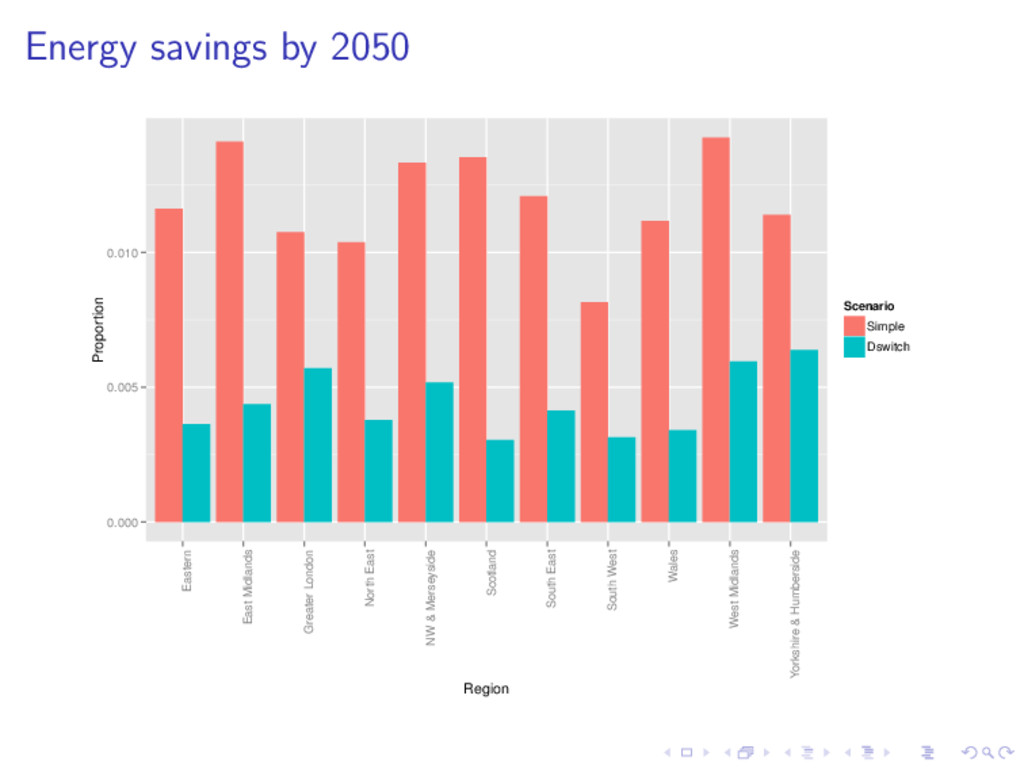
by region (variable j58g) The characteristics of current trips in each region will then filter-down into probability of modal shift This will provide insight into how high growth rates will have to be in London for nationwide targets to be met
Greater London North East NW & Merseyside Scotland South East South West Wales West Midlands Yorkshire & Humberside Region Proportion Scenario Simple Dswitch
-> stage level analysis Short-term GBC parliamentary debate, monetary valuation is needed Increased physical activity due to cycling will be an output Emissions savings: relatively straightforward Estimating congestion savings still a challenge Mid-term aim: use scenarios to update 2011 work: Energy implications of modal shift to cycling to 2050 in the UK