Upgrade to Pro — share decks privately, control downloads, hide ads and more …

Automated detection and characterisation of homogeneous, stable ground targets on DMC images: towards a UK Environmental Change Space Observatory

Robin Wilson
September 12, 2011

Automated detection and characterisation of homogeneous, stable ground targets on DMC images: towards a UK Environmental Change Space Observatory

This talk was given at the RSPSoc Conference 2011 in Bournemouth, UK, and focussed on work I have done to select and characterise possible ground calibration sites in DMC images.

Robin Wilson

September 12, 2011
Tweet

More Decks by Robin Wilson

Other Decks in Research

Transcript

  1. Automated detection and characterisation of homogeneous, stable ground targets on

    DMC images: towards a UK Environmental Change Space Observatory Robin Wilson, Ted Milton and Steve Mackin [email protected] School of Geography, University of Southampton
  2. Problem § Remote sensing can provide useful information on environmental change

    –  Use multiple images and compare over time § But for that information to be useful the data need to be corrected for changes in: –  Atmospheric conditions –  Solar/View angle –  Sensor view geometry 2
  3. Problem § Ground data is often not available § So we have

    to use empirical methods –  Empirical Line Method –  Refined Empirical Line Method § These require ground targets Choosing these targets is difficult 3
  4. Solution? An automated method for extracting suitable calibration sites from

    satellite imagery Can be used as part of the process for creating a UK Environmental Change Observatory (ECO) 4
  5. Data Sources - Sensors 5 Landsat: Images too small MODIS/MERIS:

    Resolution too low DMC: High resolution (22m); Huge images; Near-daily repeat period
  6. DMC Time Series § 6 images from March-June 2010 –  During

    vegetation green-up period –  Images provided courtesy of DMCii § All from SLIM-6-22 sensor on different DMC satellites § Subset centred on Andover, Hampshire –  Range of land covers (Water, Urban, Forest) § Used first and last images 6
  7. Site Selection Criteria § Sites must be: –  Spatially uniform – 

    Wide ranging in reflectance –  Stable over time –  Flat –  Large (at least 3 pixels) Criteria from Karpouzli and Malthus(2003) & Smith and Milton (1999) 8
  8. Criterion: Spatial Uniformity § Assessed using the Getis statistic § Shown to

    be more sensitive to small-scale local variation than other measures (Bannari et al., 2003) § Calculated for each pixel by looking at variation in a 3x3 window around the pixel 10
  9. Criterion: Wide reflectance range § Pixels which are close to endmembers

    are, by definition, near the edge of the pixel cloud – they are some of the brightest and darkest pixels in each band § Endmembers extracted using the SMACC algorithm (Gruninger, 2004) § Converted to ‘purity index’ by taking maximum endmember abundance for each pixel 13
  10. Criterion: Stable over time § Assessed using Multivariate Alteration Detection (MAD;

    Nielsen, 1998; 2005) § Can be statistically processed to produce a No Change Probability (NCP) image § Invariant to affine transformations – so can be used before atmospheric correction 16
  11. Fitness Image Calculation § Each criterion can be independently weighted § For

    example: –  Temporal stability: 40% –  Spatial uniformity: 40% –  Spectral purity: 20% § Resulting image stores the ‘quality’ or ‘fitness’ of each pixel 19
  12. Segmentation/Classification 1st rule of segmentation: All pixels must be in

    one, and only one, segment Segment and classify at the same time Only create segments for possible calibration targets 21
  13. Region Growing Segmentation 1.  Start with a seed –  The

    best pixel in the fitness image 2.  Add surrounding pixels to the region IF they are spectrally similar and greater than a minimum fitness level 3.  Repeat until the seed fitness is less than a threshold 22
  14. Vectorising & Filtering § Convert region pixels to ROIs § Assess group

    attributes: –  Flatness: Is StDev of elevation low? –  Size: Is region < 3 pixels? 23
  15. So what? § We all need to do calibration… § …but this

    specific procedure isn’t always suitable However it demonstrates a number of techniques: § ‘Fitness Image’ segmentation § Use of novel statistical methods for assessing site suitability 25
  16. Further Work Environmental Change Observatory §  Operational selection of calibration

    sites §  Detailed characterisation of these sites §  Automated ground measurement systems at these sites? Object-based Image Analysis §  Application of ‘fitness-image’ approach to other problems §  Extension of NCP +MAD+Getis approach §  Creation of GUI OBIA application? 26
  17. References §  Bannari, A., Omari, K., Teillet, P. & Fedosejevs,

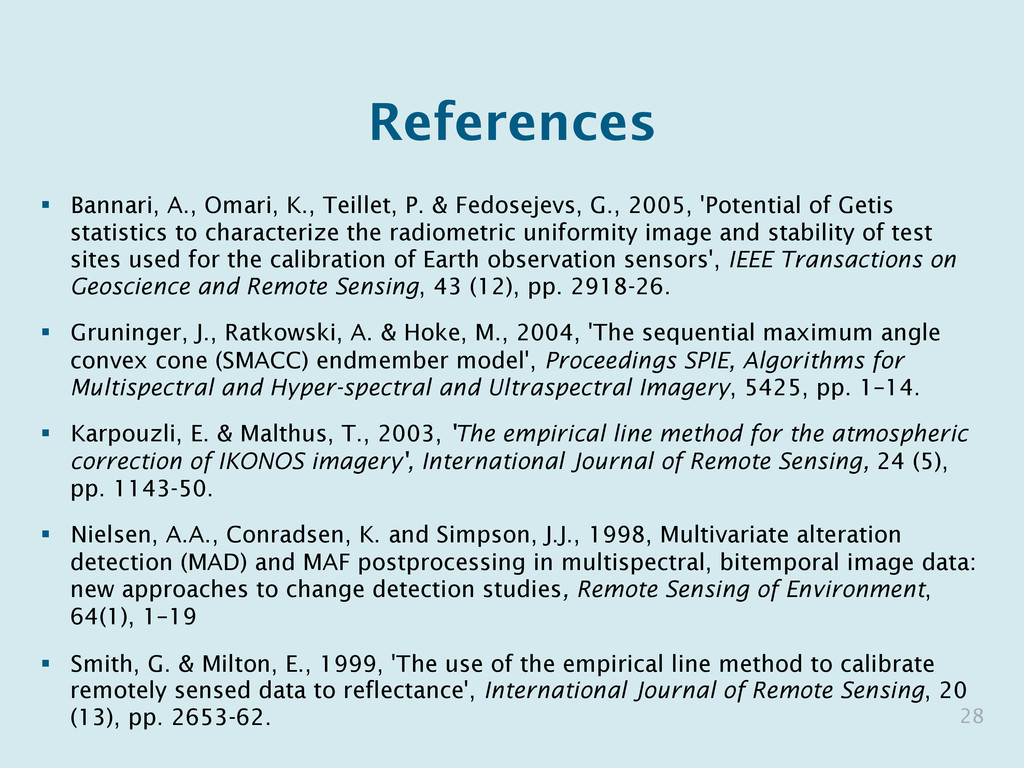
    G., 2005, 'Potential of Getis statistics to characterize the radiometric uniformity image and stability of test sites used for the calibration of Earth observation sensors', IEEE Transactions on Geoscience and Remote Sensing, 43 (12), pp. 2918-26. §  Gruninger, J., Ratkowski, A. & Hoke, M., 2004, 'The sequential maximum angle convex cone (SMACC) endmember model', Proceedings SPIE, Algorithms for Multispectral and Hyper-spectral and Ultraspectral Imagery, 5425, pp. 1–14. §  Karpouzli, E. & Malthus, T., 2003, 'The empirical line method for the atmospheric correction of IKONOS imagery', International Journal of Remote Sensing, 24 (5), pp. 1143-50. §  Nielsen, A.A., Conradsen, K. and Simpson, J.J., 1998, Multivariate alteration detection (MAD) and MAF postprocessing in multispectral, bitemporal image data: new approaches to change detection studies, Remote Sensing of Environment, 64(1), 1–19 §  Smith, G. & Milton, E., 1999, 'The use of the empirical line method to calibrate remotely sensed data to reflectance', International Journal of Remote Sensing, 20 (13), pp. 2653-62. 28