Upgrade to Pro — share decks privately, control downloads, hide ads and more …

Metrics-Driven Development: See the forest for the trees

Metrics-Driven Development: See the forest for the trees

UPDATED SLIDES: October 2015 - GitHub Universe

Talk originally given at Open Data Science in Boston, May 2015 and EuroPython in July 2015.

Full blog post: http://rogue.ly/metrics

Lynn Root

May 30, 2015
Tweet

More Decks by Lynn Root

Other Decks in Technology

Transcript

  1. $ whoami • Backend Engineer @ Spotify, based in San

    Fransisco • Board Member of Python Software Foundation • Founder of PyLadies of San Francisco, one of the lead organizers of PyLadies globally
  2. • About Spotify • Our agile approach to & implementation

    of metrics • Stepping back for the bigger picture See the forest for the trees.
  3. About Spotify. • Available in 58 countries • Over 20

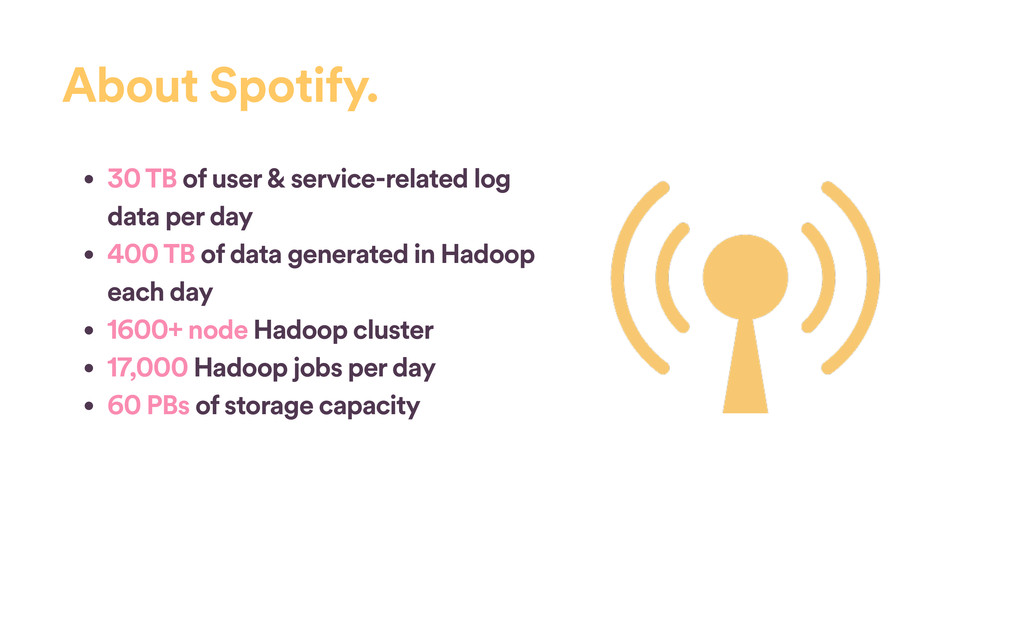
    million paying subscribers • Over 75 million monthly active users • Over 30 million songs; 20,000 added each day • Paid over $3 billion to rights holders to date • Main engineering offices located in Stockholm & New York 

  4. About Spotify. • 30 TB of user & service-related log

    data per day • 400 TB of data generated in Hadoop each day • 1600+ node Hadoop cluster • 17,000 Hadoop jobs per day • 60 PBs of storage capacity
  5. Feedback Expectations Customers Service/Product • What do we deliver? •

    For whom do we produce it? Who defines our work? Finding our Target Condition
  6. Feedback Expectations Customers Service/Product • What do we deliver? •

    For whom do we produce it? Who defines our work? • What do they expect of us? Finding our Target Condition
  7. Feedback Expectations Customers Service/Product • What do we deliver? •

    For whom do we produce it? Who defines our work? • What do they expect of us? • Did we meet those expectations? Finding our Target Condition
  8. Metrics we wanted to see ‣ Signup/auth flow abandonment ‣

    Facebook-connected users – percentage of total users, trend over time ‣ Percent of users that sign up through Facebook per hour/day/ week ‣ Facebook-related errors
  9. Metrics we wanted to see ‣ Daily Active Users by

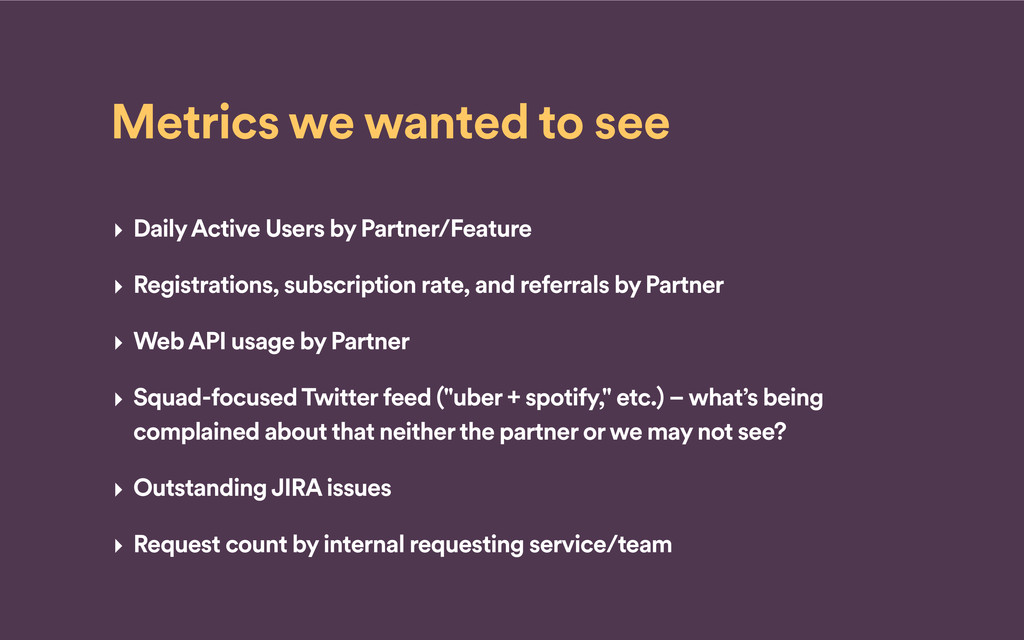
    Partner/Feature ‣ Registrations, subscription rate, and referrals by Partner ‣ Web API usage by Partner ‣ Squad-focused Twitter feed ("uber + spotify," etc.) – what’s being complained about that neither the partner or we may not see? ‣ Outstanding JIRA issues ‣ Request count by internal requesting service/team
  10. New Processes ‣ Evaluate metrics during retrospectives. ‣ Set metric

    goals to new integration projects. ‣ Soliciting feedback from external partners.
  11. Creating a new metric ‣ How do metrics map to

    business goals? ‣ How do you prioritize different goals you want to drive? ‣ How can we create dashboards that are actually actionable?
  12. Representing metrics ‣ How do we correctly measure what we

    care about? ‣ What’s best: a gauge, counter, meter, histogram, or a timer? ‣ What’s a better representation for a metric, the mean, 95% 99%?
  13. Consuming metrics ‣ How often do you check in on

    metrics? ‣ How do you make dashboards more visible? ‣ Considerations for the setup?
  14. Iterating over current metrics ‣ Why did we not reach

    our goal? ‣ What action are we going to take? ‣ What about unknowns?