Upgrade to Pro — share decks privately, control downloads, hide ads and more …

Tracing, Fast & Slow: Digging into and improving your web service's performance

Lynn Root
October 31, 2018

Tracing, Fast & Slow: Digging into and improving your web service's performance

* PyLadies in St Petersburg, Nov 2018
* EuroPython 2017
* PyCon 2017

Lynn Root

October 31, 2018
Tweet

More Decks by Lynn Root

Other Decks in Programming

Transcript

  1. Lynn Root | SRE | @roguelynn Tracing: Fast & Slow

    Digging into and improving your web service’s performance
  2. agenda • Overview and problem space • Approaches to tracing

    • Tracing at scale • Diagnosing performance issues —
  3. agenda • Overview and problem space • Approaches to tracing

    • Tracing at scale • Diagnosing performance issues • Tracing services & systems —
  4. machine-centric • Focus on a single machine • No view

    into a service’s dependencies —
  5. why trace? • Performance analysis • Anomaly detection • Profiling

    • Resource attribution • Workload modeling —
  6. def request_id(f): @wraps(f) def decorated(*args, **kwargs): req_id = request.headers.get( "X-Request-Id",

    uuid.uuid4()) return f(req_id, *args, **kwargs) return decorated @app.route("/") @request_id def list_services(req_id): # log w/ ID for wherever you want to trace # app logic
  7. upstream appserver { 10.0.0.0:80; } server { listen 80; #

    Return to client add_header X-Request-ID $request_id; location / { proxy_pass http://appserver; # Pass to app server proxy_set_header X-Request-ID $request_id; } }
  8. log_format trace '$remote_addr … $request_id'; server { listen 80; add_header

    X-Request-ID $request_id; location / { proxy_pass http://app_server; proxy_set_header X-Request-ID $request_id; # Log $request_id access_log /var/log/nginx/access_trace.log trace; } }
  9. four things to think about • What relationships to track

    • How to track them • Which sampling approach to take —
  10. four things to think about • What relationships to track

    • How to track them • Which sampling approach to take • How to visualize —
  11. gantt chart — GET /home GET /feed GET /profile GET

    /messages GET /friends Trace ID: de4db33f
  12. — request flow graph A call B call C call

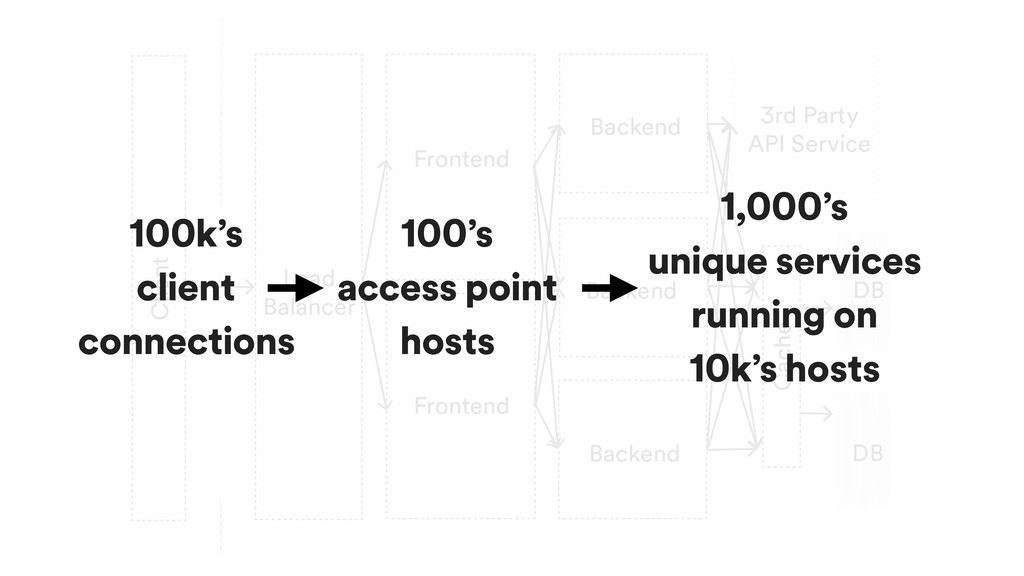
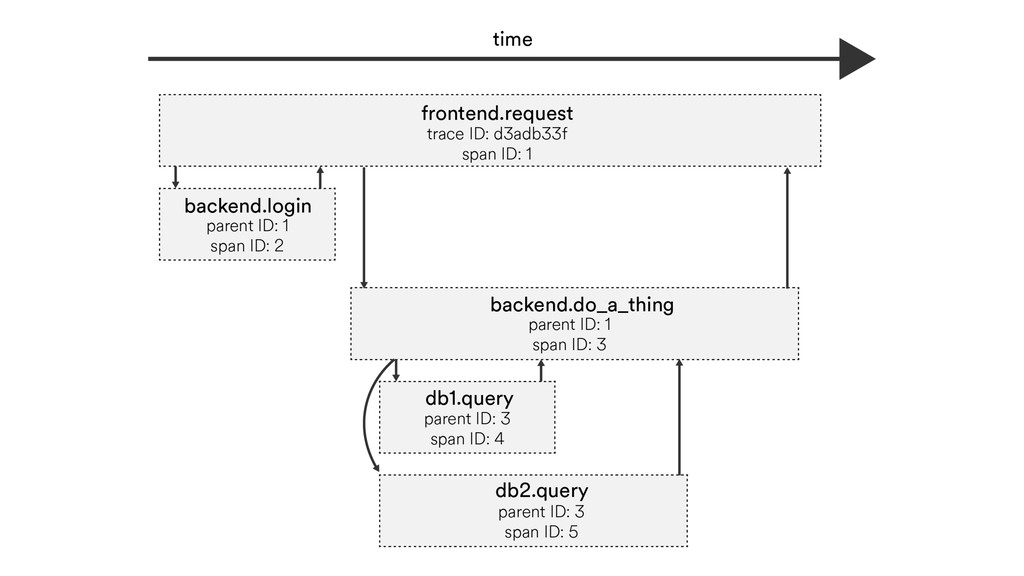
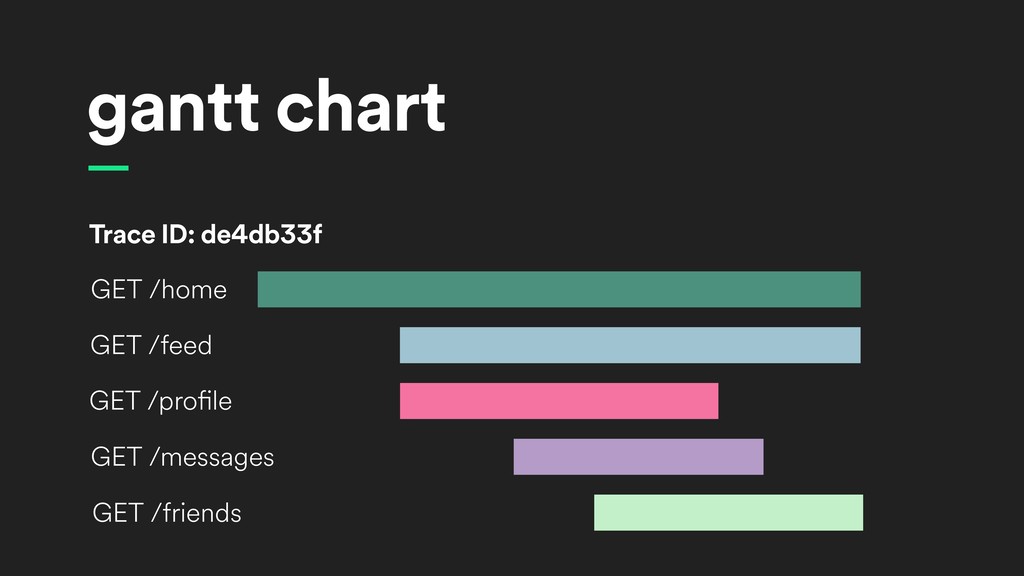
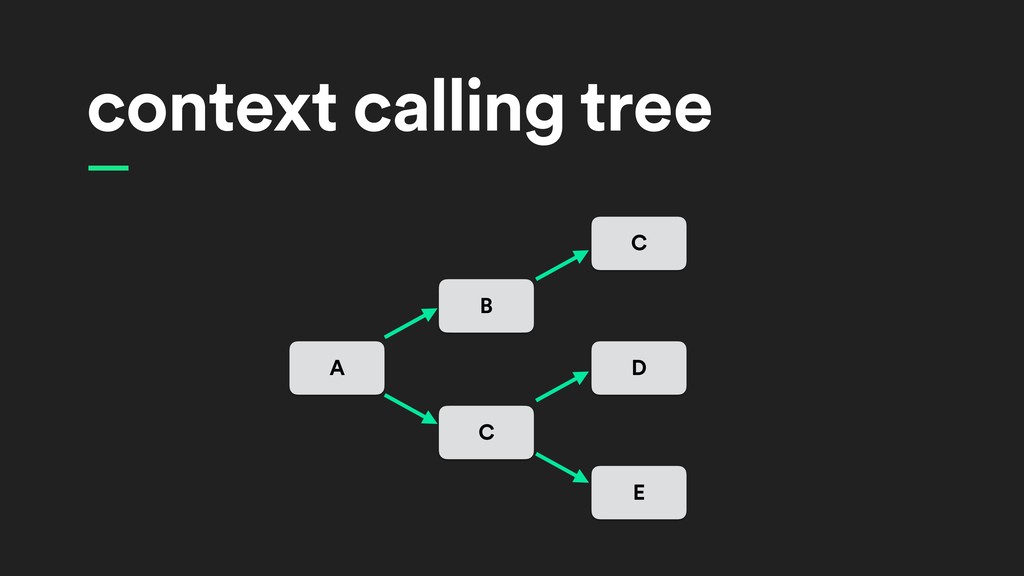
    C call D call E call E reply D reply B reply C reply C reply A reply 2200µs 1500µs 500µs 300µs 400µs 600µs 800µs 500µs 500µs 700µs 500µs 400µs 600µs 100µs
  13. keep in mind • What do I want to know?

    • How much can I instrument? —
  14. keep in mind • What do I want to know?

    • How much can I instrument? • How much do I want to know? —
  15. questions to ask • Batch requests? • Any parallelization opportunities?

    • Useful to add/fix caching? • Frontend resource loading? —
  16. questions to ask • Batch requests? • Any parallelization opportunities?

    • Useful to add/fix caching? • Frontend resource loading? • Chunked or JIT responses? —
  17. Zipkin (Twitter) • Out-of-band reporting to remote collector • Report

    via HTTP, Kafka, and Scribe • Python libs only support propagation via HTTP —
  18. Zipkin (Twitter) • Out-of-band reporting to remote collector • Report

    via HTTP, Kafka, and Scribe • Python libs only support propagation via HTTP • Limited web UI —
  19. def http_transport(span_data): requests.post( "http://zipkinserver:9411/api/v1/spans", data=span_data, headers={"Content-type": "application/x-thrift"}) @app.route("/") def index():

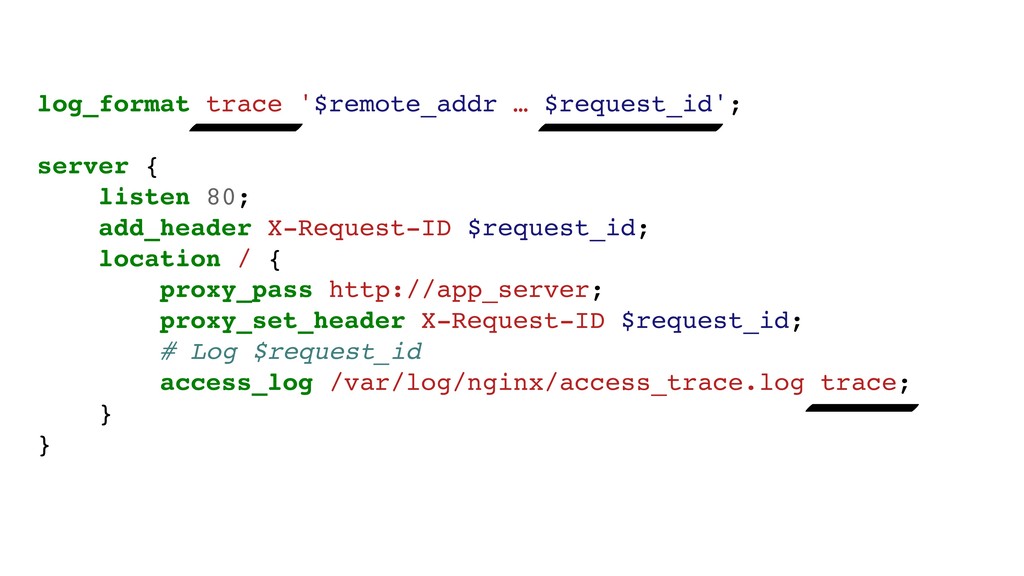
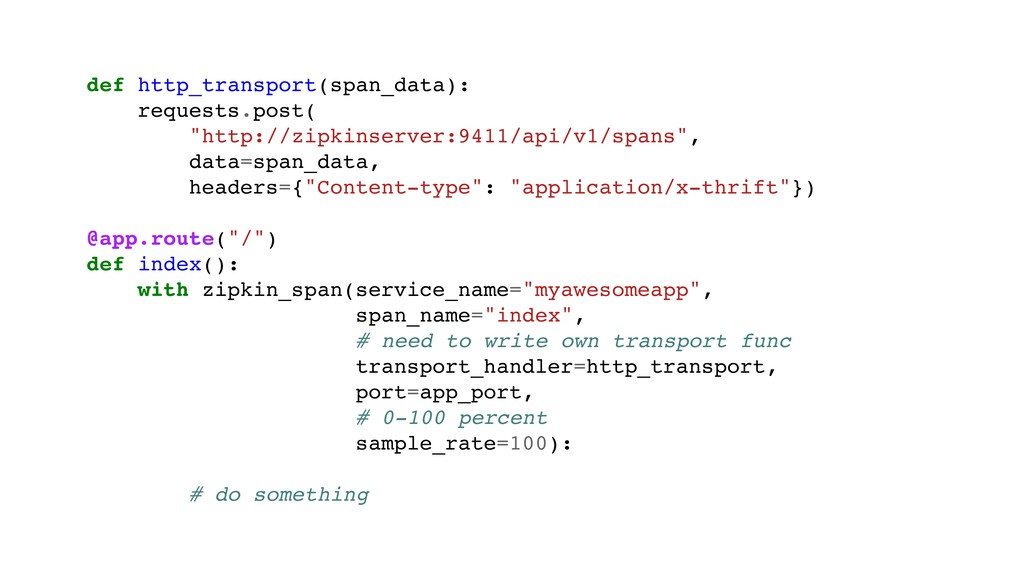
    with zipkin_span(service_name="myawesomeapp", span_name="index", # need to write own transport func transport_handler=http_transport, port=app_port, # 0-100 percent sample_rate=100): # do something
  20. Jaeger (Uber) • Local daemon to collect & report •

    Storage support for only Cassandra —
  21. Jaeger (Uber) • Local daemon to collect & report •

    Storage support for only Cassandra • Lacking in documentation —
  22. Jaeger (Uber) • Local daemon to collect & report •

    Storage support for only Cassandra • Lacking in documentation • Cringe-worthy client library —
  23. import opentracing as ot config = Config(…) tracer = config.initialize_tracer()

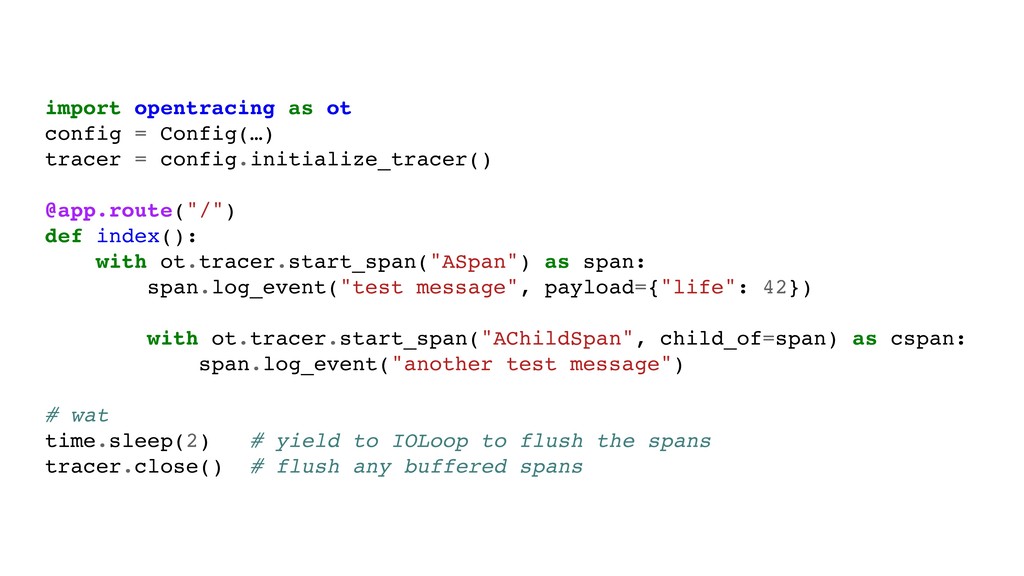
    @app.route("/") def index(): with ot.tracer.start_span("ASpan") as span: span.log_event("test message", payload={"life": 42}) with ot.tracer.start_span("AChildSpan", child_of=span) as cspan: span.log_event("another test message") # wat time.sleep(2) # yield to IOLoop to flush the spans tracer.close() # flush any buffered spans
  24. Stackdriver Trace (Google) • OpenCensus Python library with gRPC support

    • Forward traces from Zipkin • Storage limitation of 30 days —
  25. Stackdriver Trace (Google) • OpenCensus Python library with gRPC support

    • Forward traces from Zipkin • Storage limitation of 30 days • Recreate graphs per time period —
  26. X-Ray (AWS) • Supports OpenCensus, not OpenTracing • SDK has

    Python support • Lots of flexibility with configuring sampling —
  27. X-Ray (AWS) • Supports OpenCensus, not OpenTracing • SDK has

    Python support • Lots of flexibility with configuring sampling • Send metrics from outside AWS environment —
  28. X-Ray (AWS) • Supports OpenCensus, not OpenTracing • SDK has

    Python support • Lots of flexibility with configuring sampling • Send metrics from outside AWS environment • Flow graphs with latency, response %, sample % —
  29. tl;dr — • You need this • Docs are lacking

    • Language support is improving
  30. tl;dr — • You need this • Docs are lacking

    • Language support is improving • One size fits all approaches
  31. tl;dr — • You need this • Docs are lacking

    • Language support is improving • One size fits all approaches • But there are open specs!