Upgrade to Pro
— share decks privately, control downloads, hide ads and more …
Speaker Deck
Sign up for free
Menu
Search
Features
All features
Private URLs
Password Protection
Custom URLS
Scheduled publishing
Remove Branding
Restrict embedding
Deck Collections
Notes
Features
All features
Private URLs
Password Protection
Custom URLS
Scheduled publishing
Remove Branding
Restrict embedding
Deck Collections
Notes
Explore
Featured decks
Featured speakers
Programming
Technology
Storyboards
Explore
Featured decks
Featured speakers
Programming
Technology
Storyboards
Pricing
Search
Sign in
Sign up for free
Data wrangling & manipulation in R - Day 3 slides
Search
Sponsored
·
SiteGround - Reliable hosting with speed, security, and support you can count on.
→
Ruan van Mazijk
July 03, 2019
Programming
40
0
Share
Embed
Copy iframe code
Copy JS code
Copy link
Start on current slide
Data wrangling & manipulation in R - Day 3 slides
Ruan van Mazijk
July 03, 2019
More Decks by Ruan van Mazijk
See All by Ruan van Mazijk
Data wrangling & manipulation in R - Day 2 slides
rvanmazijk
0
75
Data wrangling & manipulation in R - Day 1 slides
rvanmazijk
0
35
Biodiversity, evolution & taxonomy - Teaching Biodiversity Short Course for FET Life Sciences Teachers
rvanmazijk
0
130
An introduction to R Markdown
rvanmazijk
0
150
Does genome size affect plant water-use? - Ecophysiology & phenology in Cape Schoenoid sedges
rvanmazijk
1
51
Environmental turnover predicts plant species richness & turnover - Comparing the Greater Cape Floristic Region & the Southwest Australia Floristic Region
rvanmazijk
0
31
Other Decks in Programming
See All in Programming
[JA] Domain Modeling with Vanilla Rails: 「操作」から再考するRailsの設計論
yasaichi
4
1.8k
Goコンパイラを作ってGoをもっと理解する / Build a Go compiler to better understand Go
ikura_hamu
0
120
Distance field of Julia set
kinakomoti321
0
150
Spec-driven Development with AI
simas
PRO
0
2.2k
ActionController meets Protocol Buffers
sorah
1
780
Modernizing iOS Apps
seyfoyun
0
150
AIが生成したコードは読むべきか?抽象化設計とコードの品質保証 / abstraction-design-and-quality
minodriven
16
8.6k
Performance Optimization With LLMs
xleitix
0
240
小さなアプリを作って公開するまで
onozaty
0
120
あなたの await、OS まで届いてる? strace で覗く JavaScript の非同期
hasutosasaki
1
2.1k
Zero-Tap Sign-In対応、結局何をすればいいの?
mitohato14
0
1.5k
Optunaを作ったときにやりたかったこと、その後 (2026/10/16, Optuna Meetup #3)
iwiwi
4
1.5k
Featured
See All Featured
First, design no harm
axbom
PRO
2
1.4k
HDC tutorial
michielstock
2
1k
From π to Pie charts
rasagy
1
440
How to make the Groovebox
asonas
2
2.5k
Cheating the UX When There Is Nothing More to Optimize - PixelPioneers
stephaniewalter
287
14k
The SEO Collaboration Effect
kristinabergwall1
1
620
The innovator’s Mindset - Leading Through an Era of Exponential Change - McGill University 2025
jdejongh
PRO
1
390
エンジニアに許された特別な時間の終わり
watany
109
250k
10 Git Anti Patterns You Should be Aware of
lemiorhan
PRO
659
62k
XXLCSS - How to scale CSS and keep your sanity
sugarenia
250
1.3M
Noah Learner - AI + Me: how we built a GSC Bulk Export data pipeline
techseoconnect
PRO
0
480
Git: the NoSQL Database
bkeepers
PRO
433
67k
Transcript
data_wrangling() && ("manipulation" %in% R) %>% %>% %>% > day[3]
Ruan van Mazijk
tinyurl.com/r-with-ruan Notes & slides will go up here: (But I
encourage you to make your own notes!)
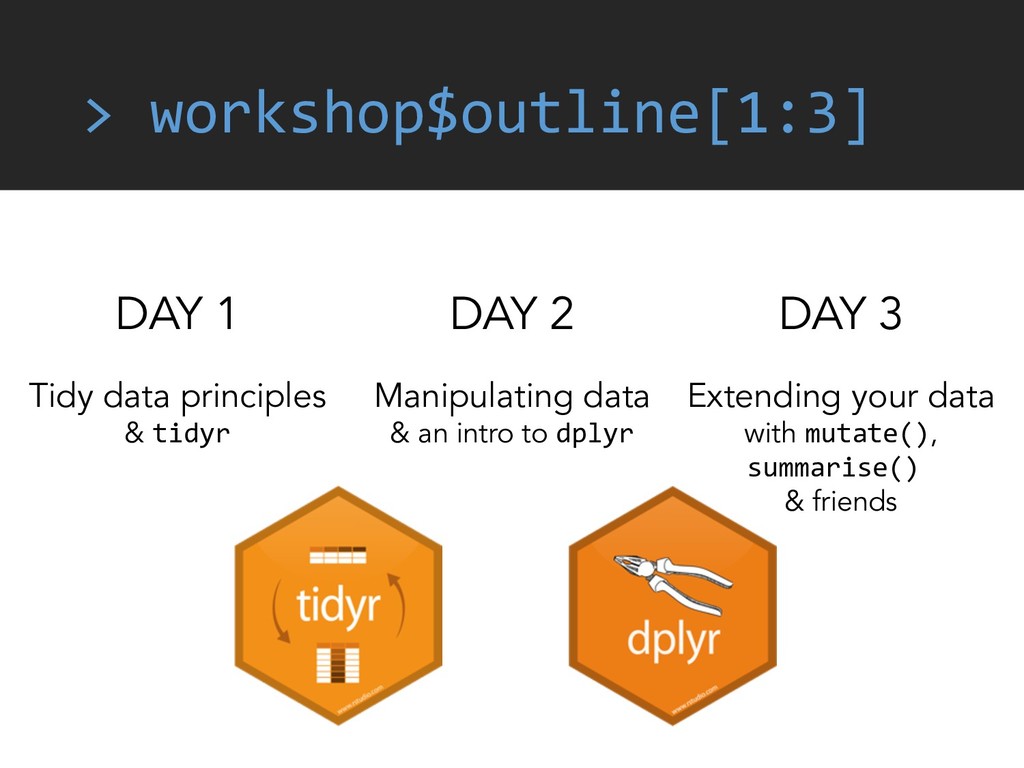
> workshop$outline[1:3] DAY 1 Tidy data principles & tidyr DAY
2 Manipulating data & an intro to dplyr DAY 3 Extending your data with mutate(), summarise() & friends
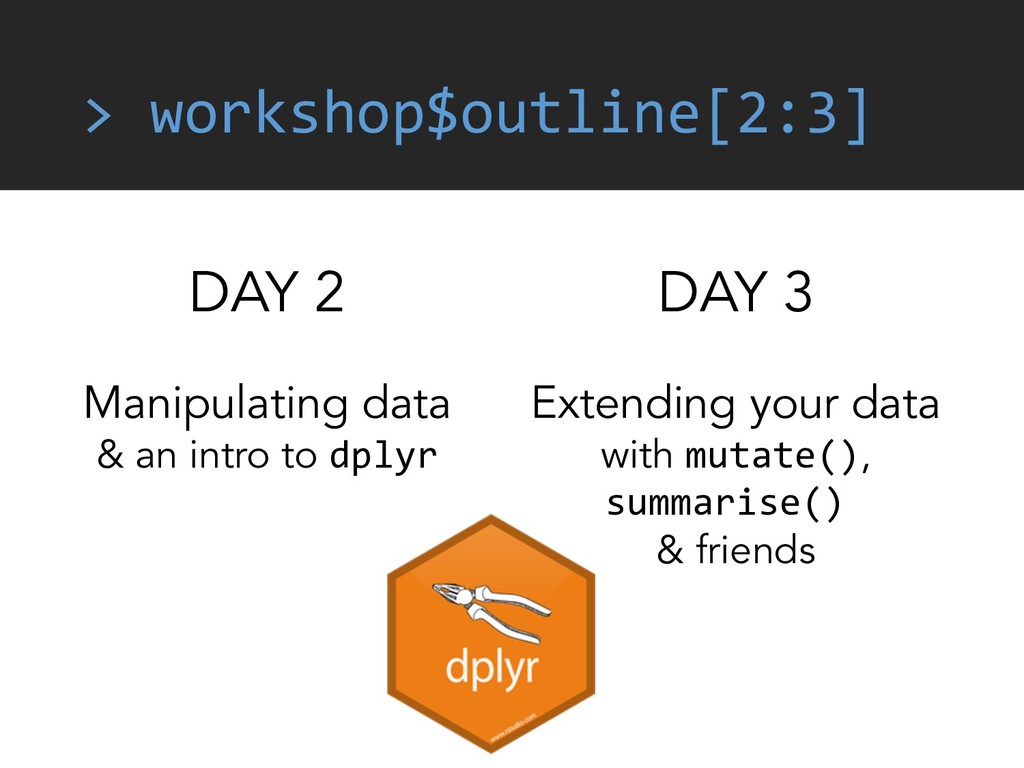
> workshop$outline[2:3] DAY 2 Manipulating data & an intro to
dplyr DAY 3 Extending your data with mutate(), summarise() & friends
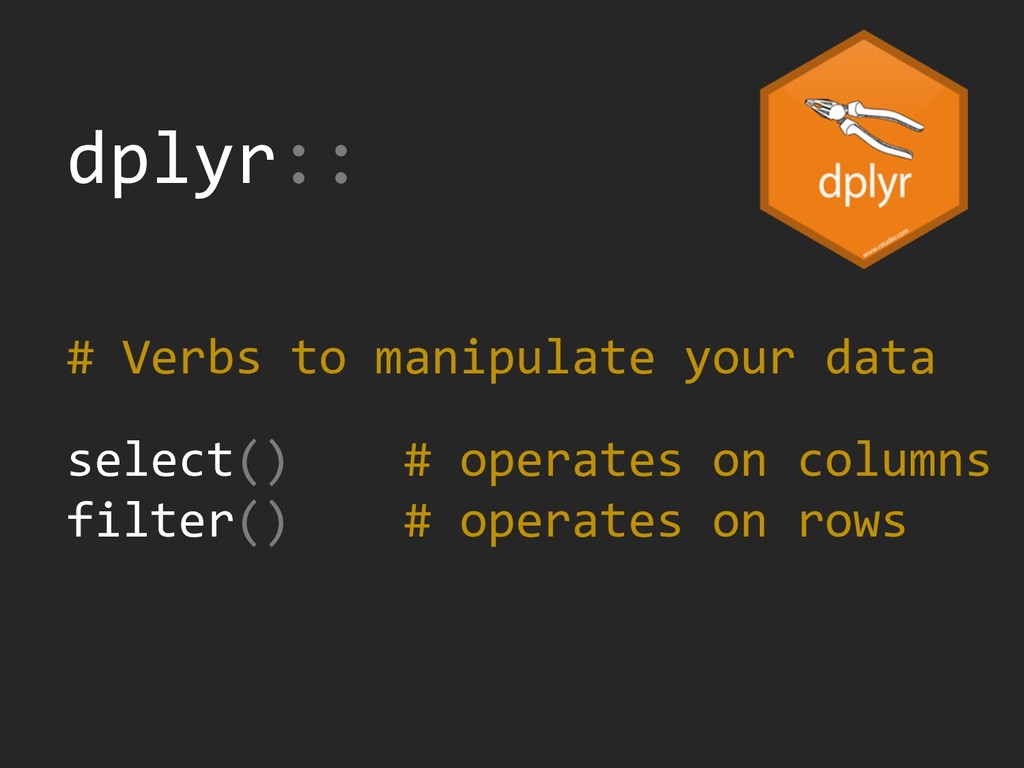
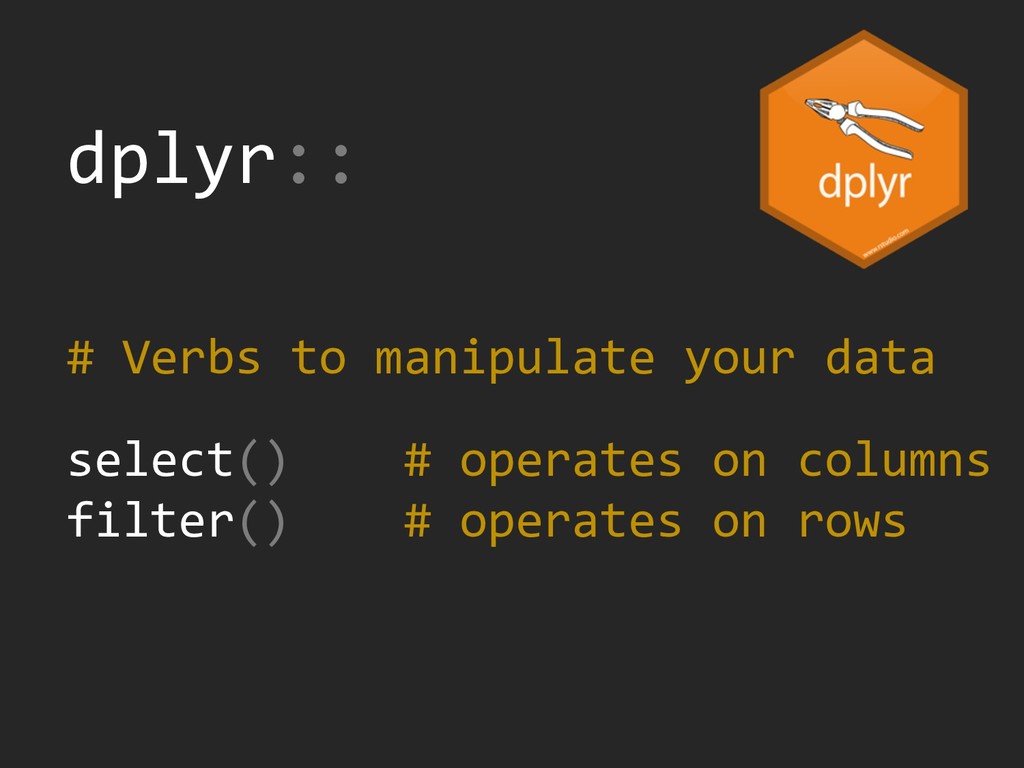
dplyr:: # Verbs to manipulate your data select() # operates
on columns filter() # operates on rows
data %>%
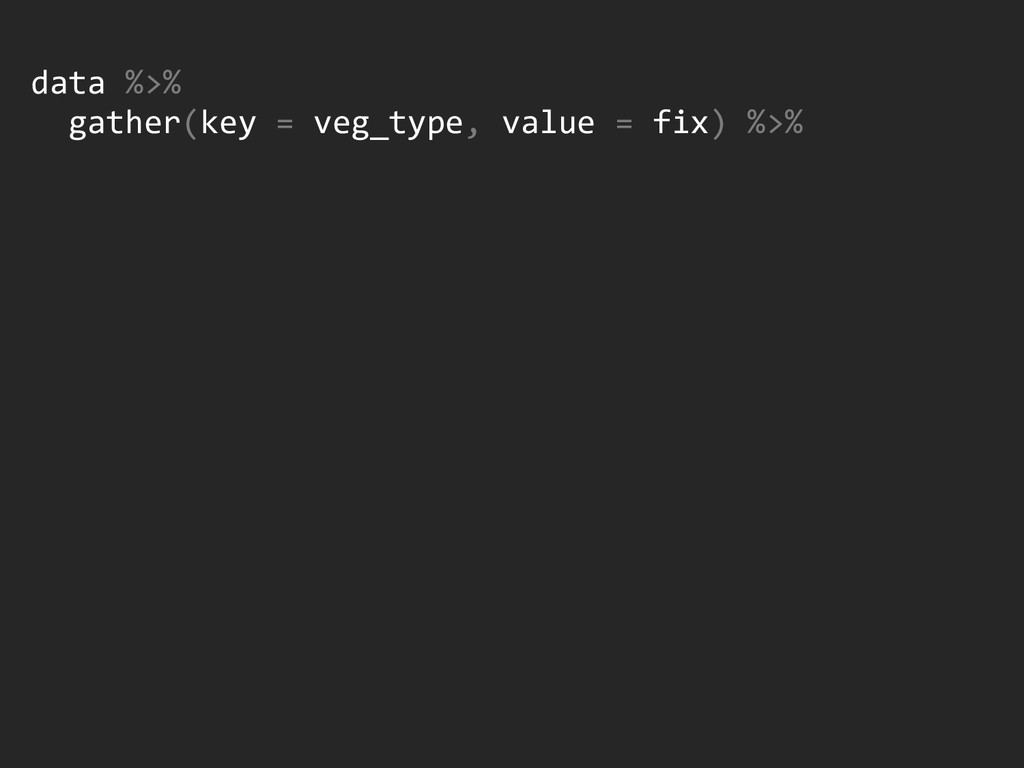
data %>% gather(key = veg_type, value = fix) %>%
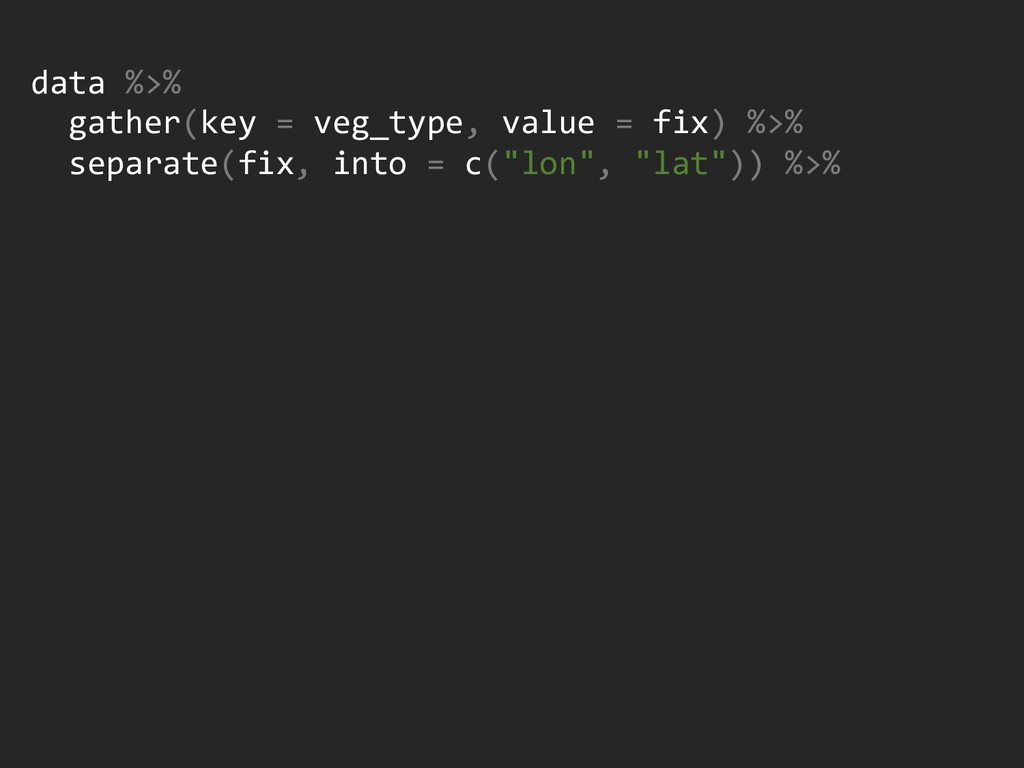
data %>% gather(key = veg_type, value = fix) %>% separate(fix,
into = c("lon", "lat")) %>%
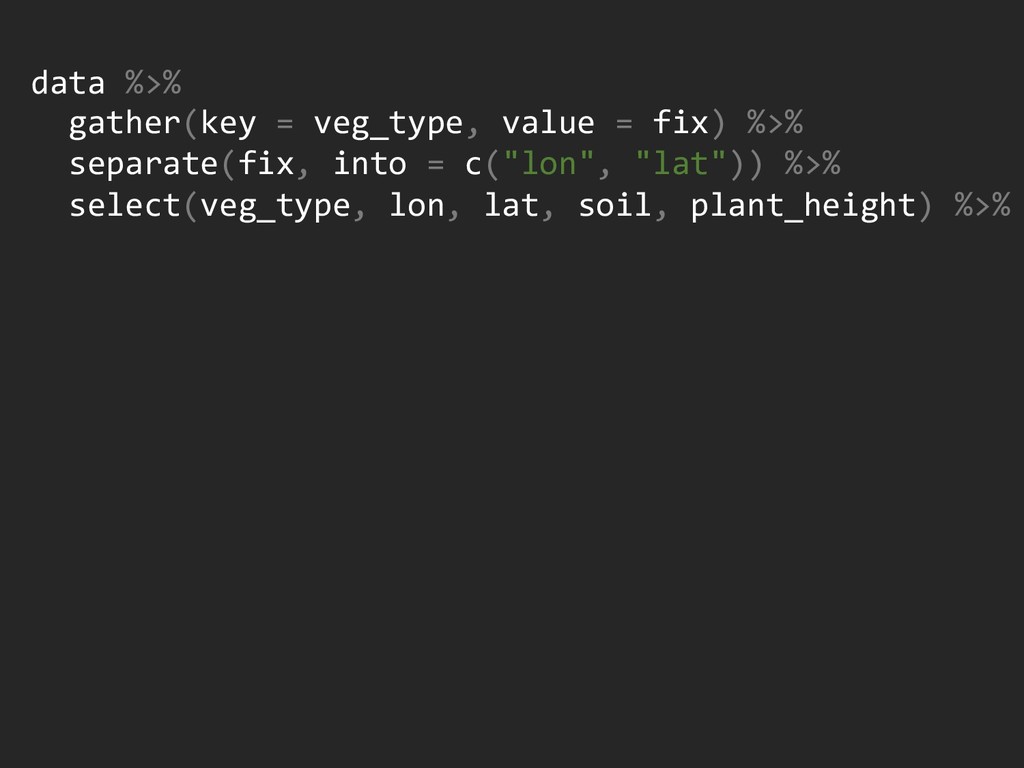
data %>% gather(key = veg_type, value = fix) %>% separate(fix,
into = c("lon", "lat")) %>% select(veg_type, lon, lat, soil, plant_height) %>%
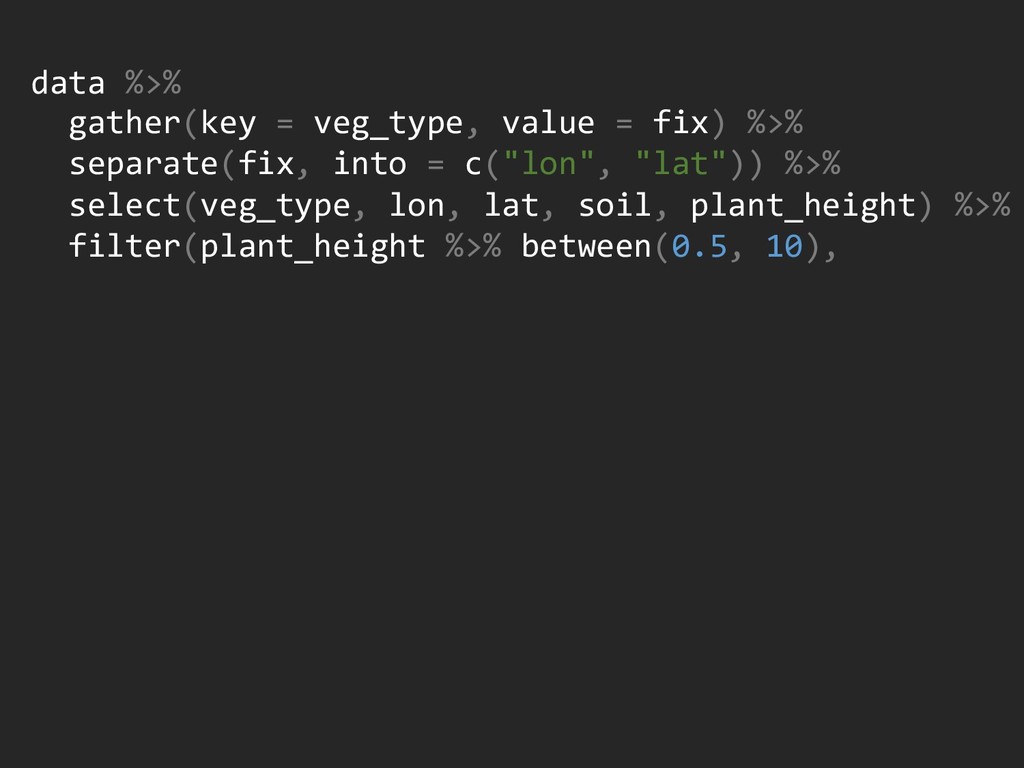
data %>% gather(key = veg_type, value = fix) %>% separate(fix,
into = c("lon", "lat")) %>% select(veg_type, lon, lat, soil, plant_height) %>% filter(plant_height %>% between(0.5, 10),
data %>% gather(key = veg_type, value = fix) %>% separate(fix,
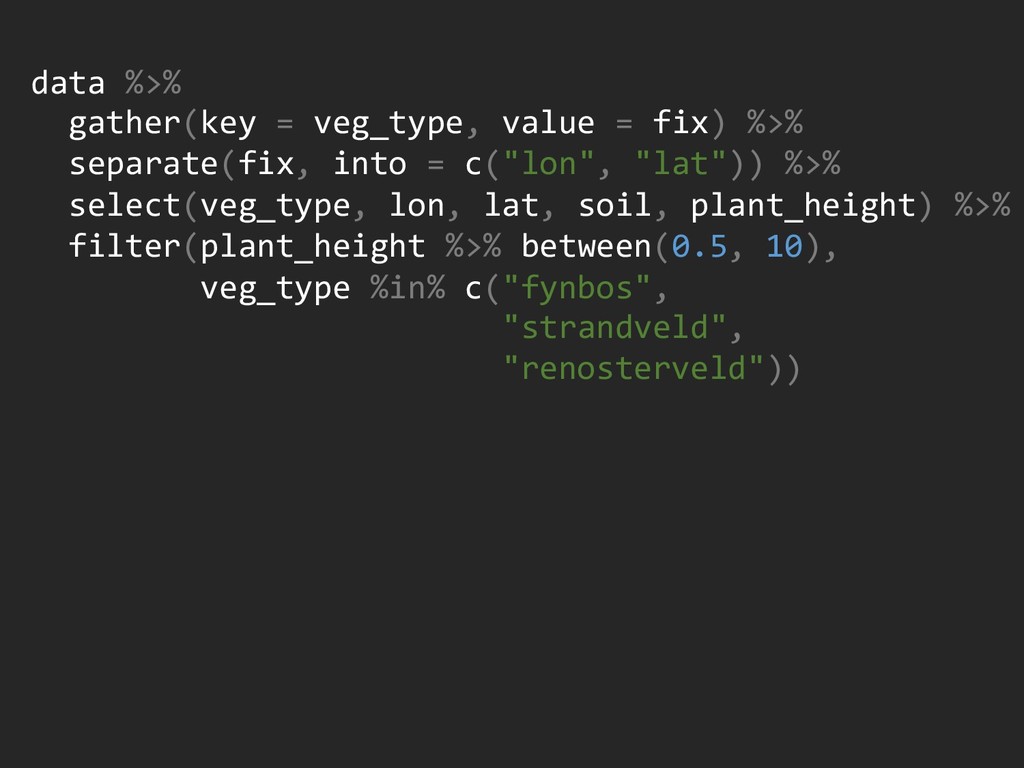
into = c("lon", "lat")) %>% select(veg_type, lon, lat, soil, plant_height) %>% filter(plant_height %>% between(0.5, 10), veg_type %in% c("fynbos", "strandveld", "renosterveld"))
data %>% gather(key = veg_type, value = fix) %>% separate(fix,
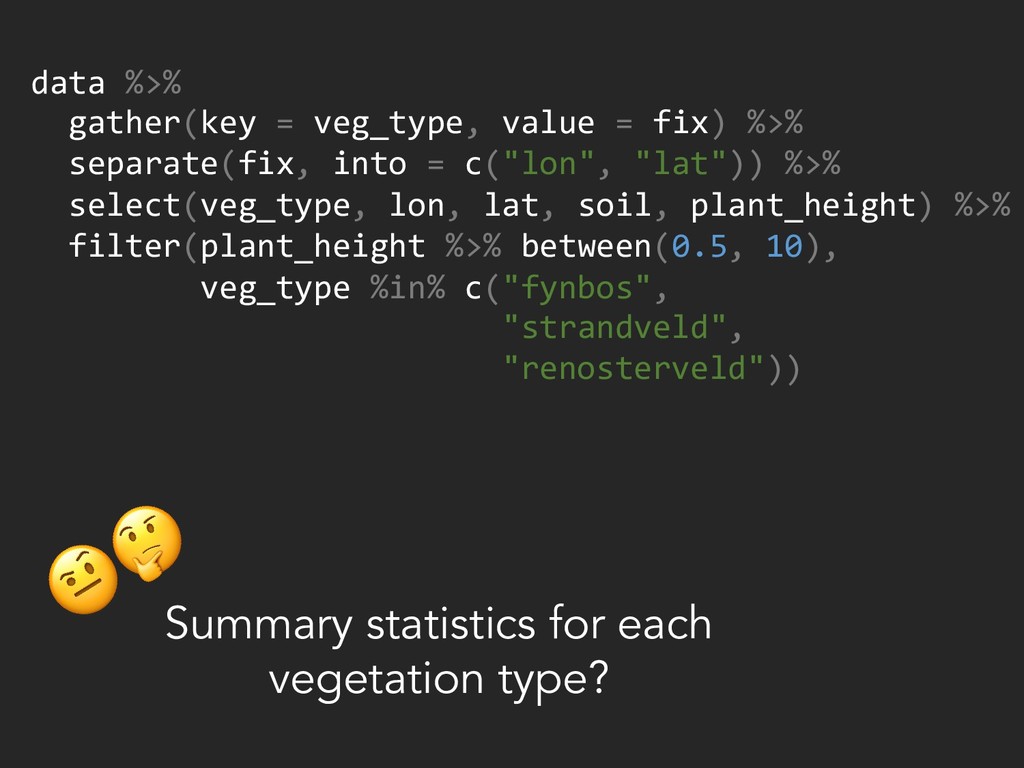
into = c("lon", "lat")) %>% select(veg_type, lon, lat, soil, plant_height) %>% filter(plant_height %>% between(0.5, 10), veg_type %in% c("fynbos", "strandveld", "renosterveld")) Summary statistics for each vegetation type?
data %>% gather(key = veg_type, value = fix) %>% separate(fix,
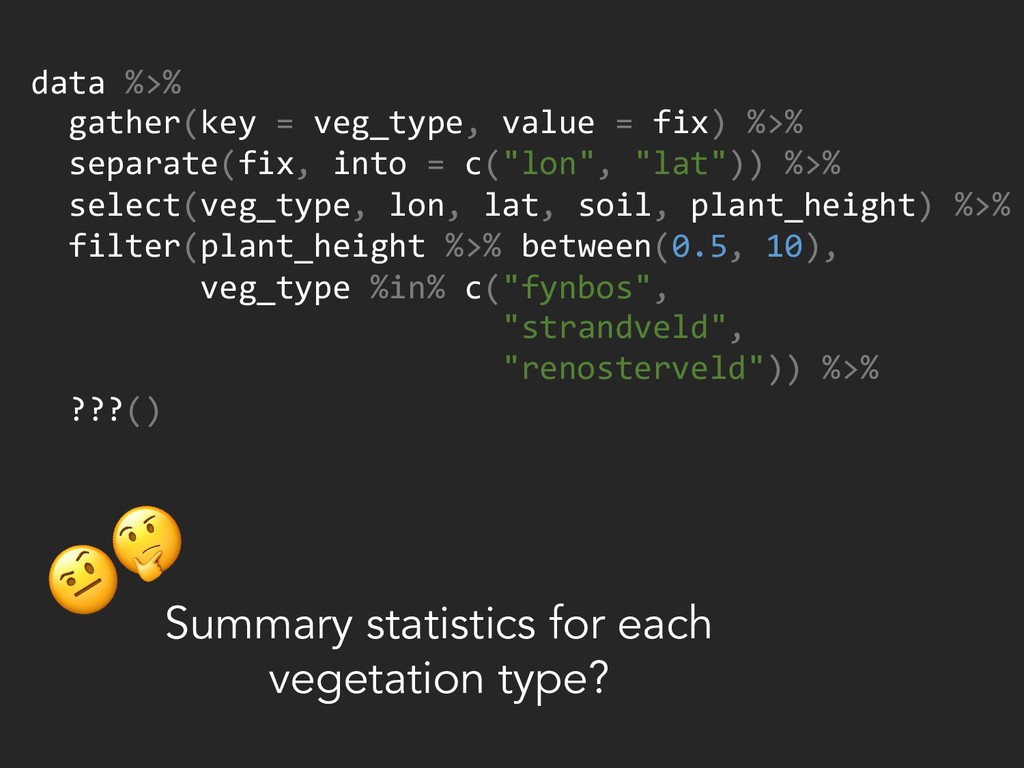
into = c("lon", "lat")) %>% select(veg_type, lon, lat, soil, plant_height) %>% filter(plant_height %>% between(0.5, 10), veg_type %in% c("fynbos", "strandveld", "renosterveld")) %>% ???() Summary statistics for each vegetation type?
dplyr:: # Verbs to manipulate your data select() # operates
on columns filter() # operates on rows
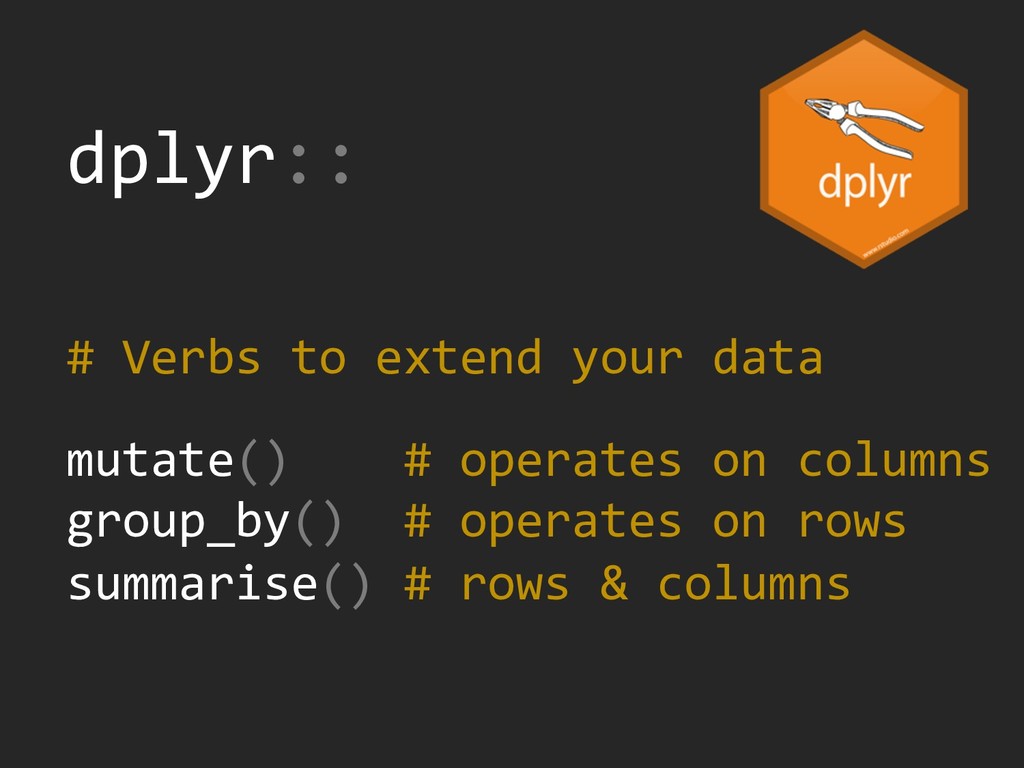
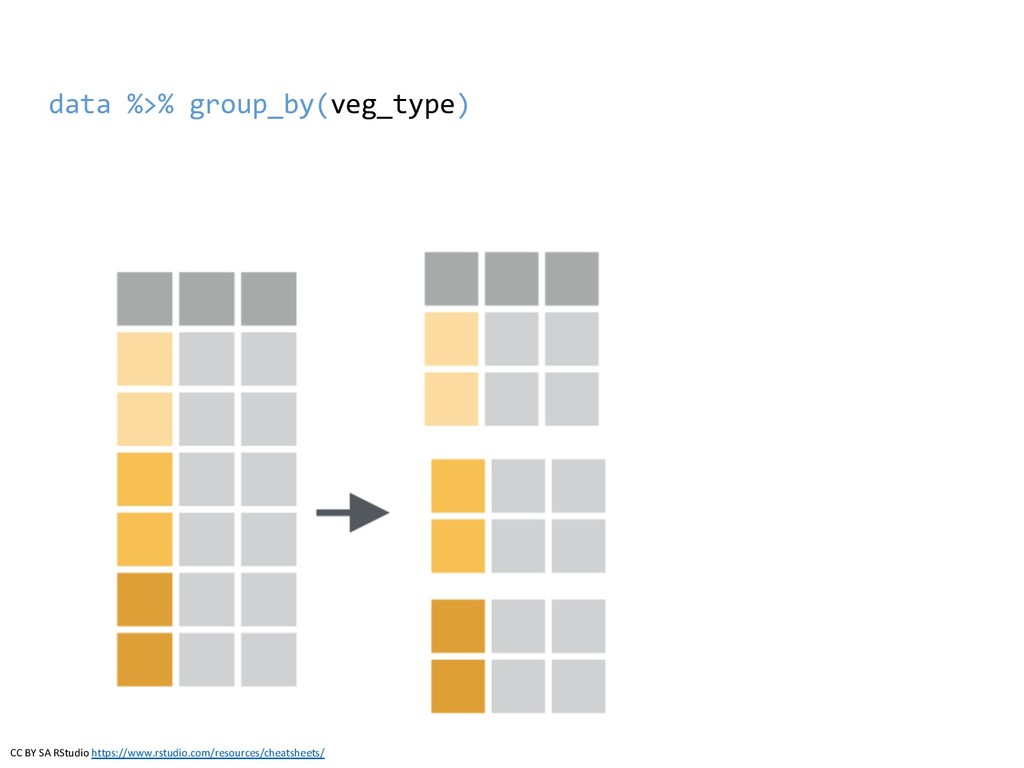
dplyr:: # Verbs to extend your data mutate() # operates
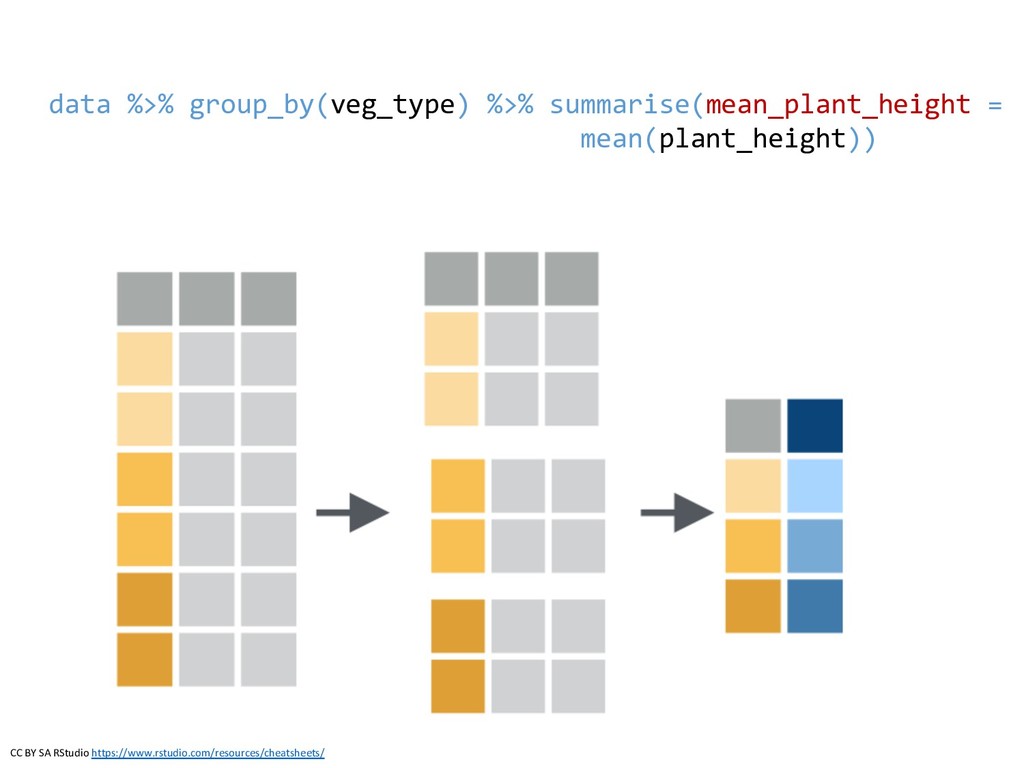
on columns group_by() # operates on rows summarise() # rows & columns
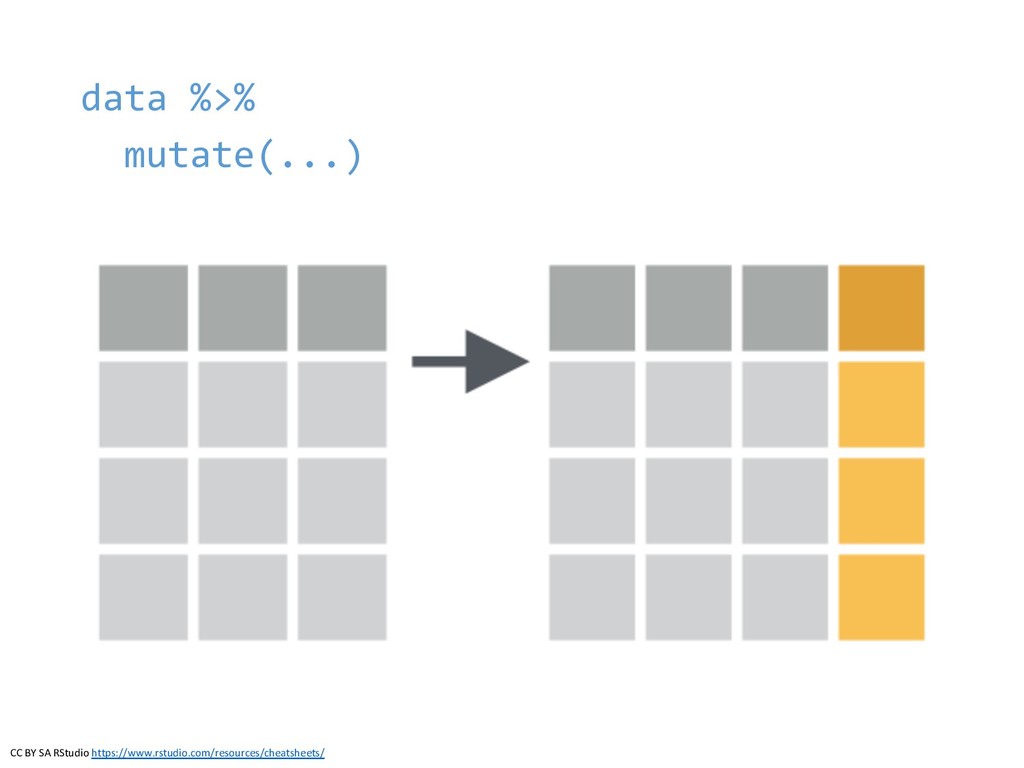
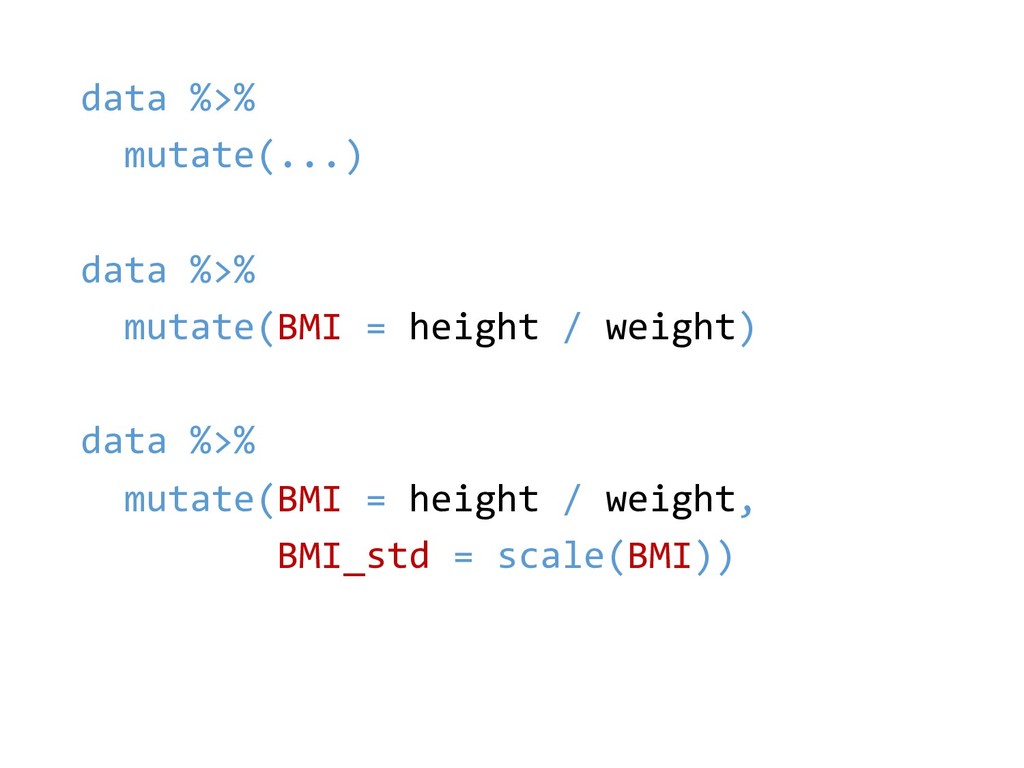
data %>% mutate(...) CC BY SA RStudio https://www.rstudio.com/resources/cheatsheets/
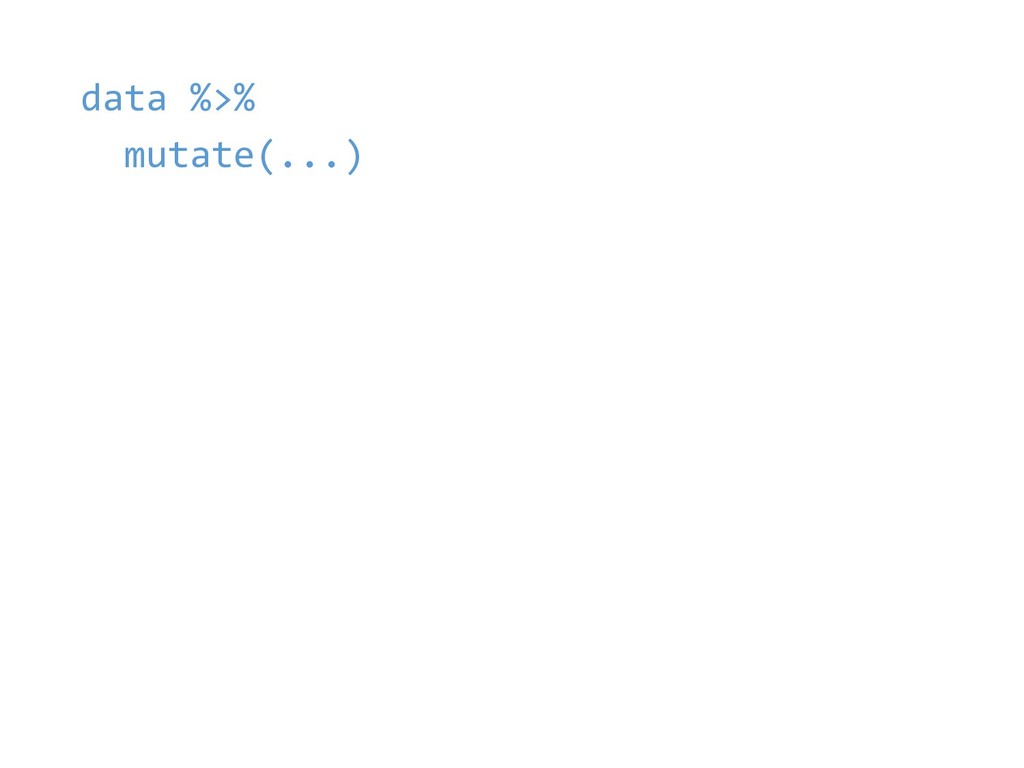
data %>% mutate(...)
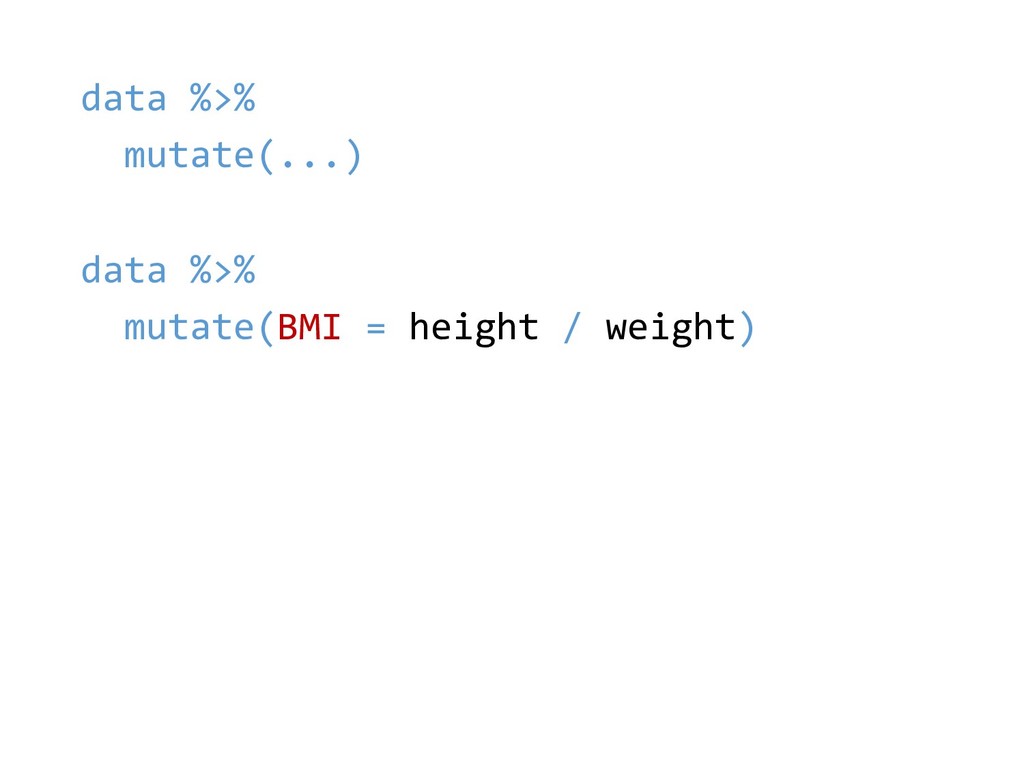
data %>% mutate(...) data %>% mutate(BMI = height / weight)
data %>% mutate(...) data %>% mutate(BMI = height / weight)
data %>% mutate(BMI = height / weight, BMI_std = scale(BMI))
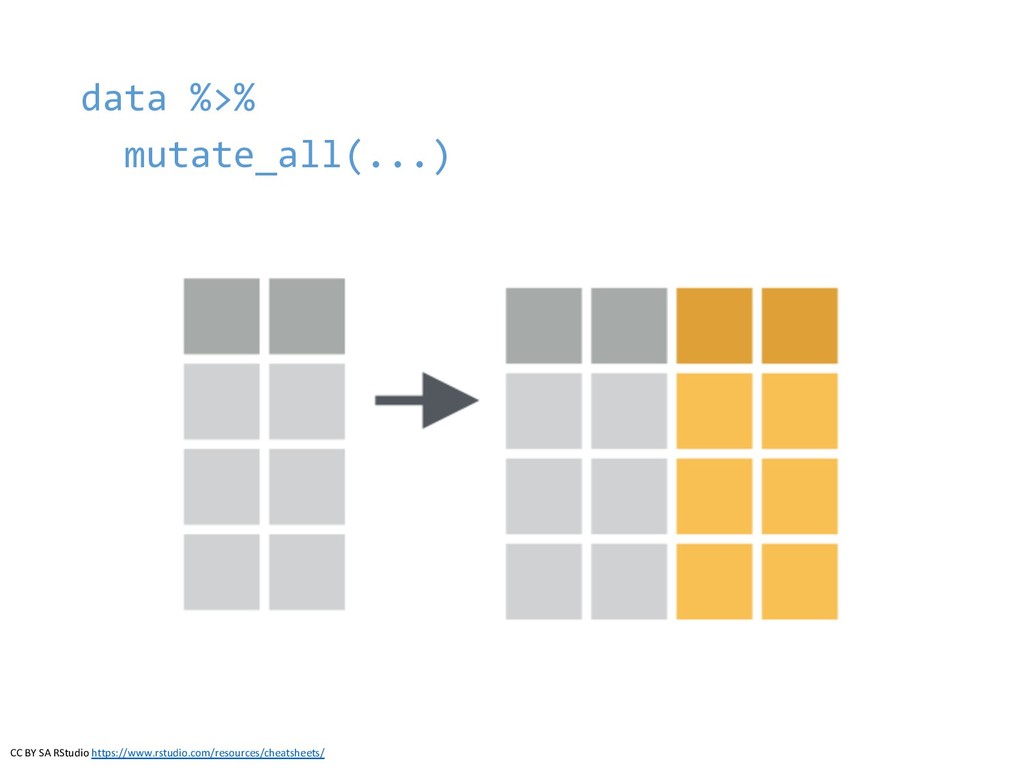
data %>% mutate_all(...) CC BY SA RStudio https://www.rstudio.com/resources/cheatsheets/
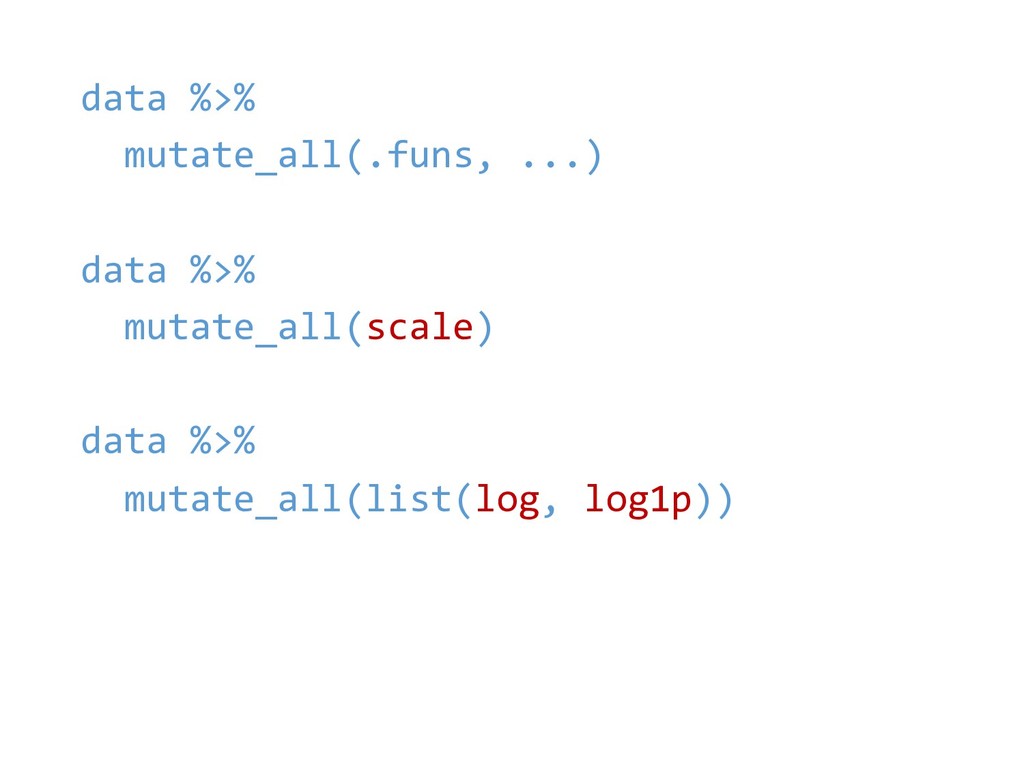
data %>% mutate_all(.funs, ...) data %>% mutate_all(scale) data %>% mutate_all(list(log,
log1p))
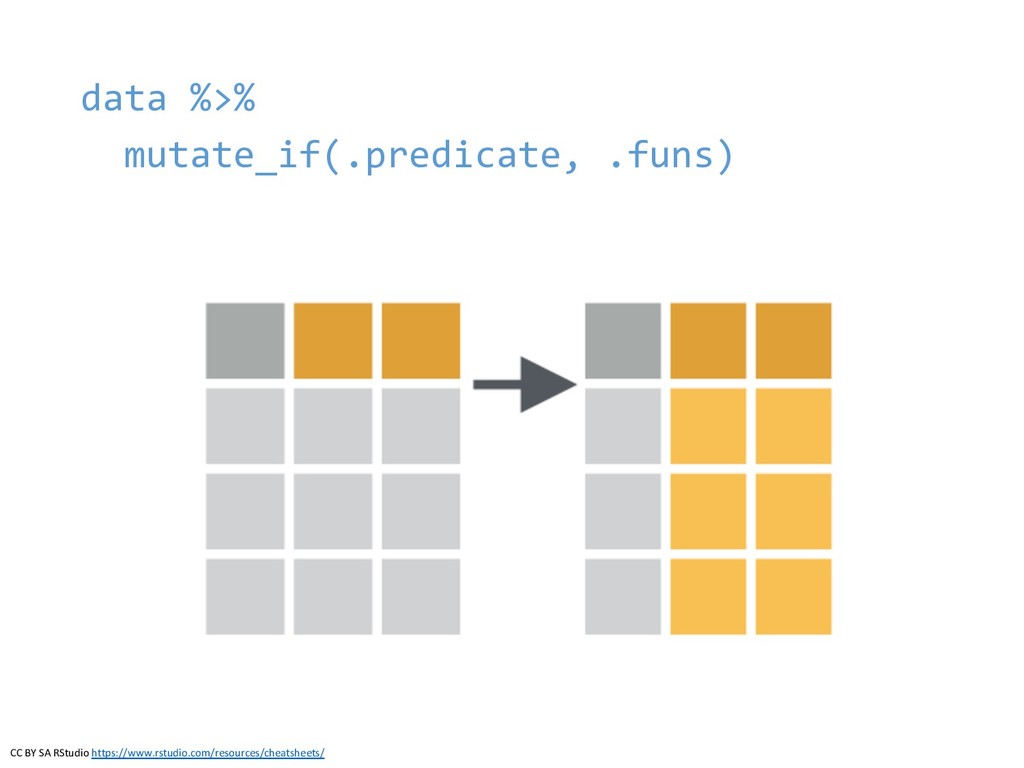
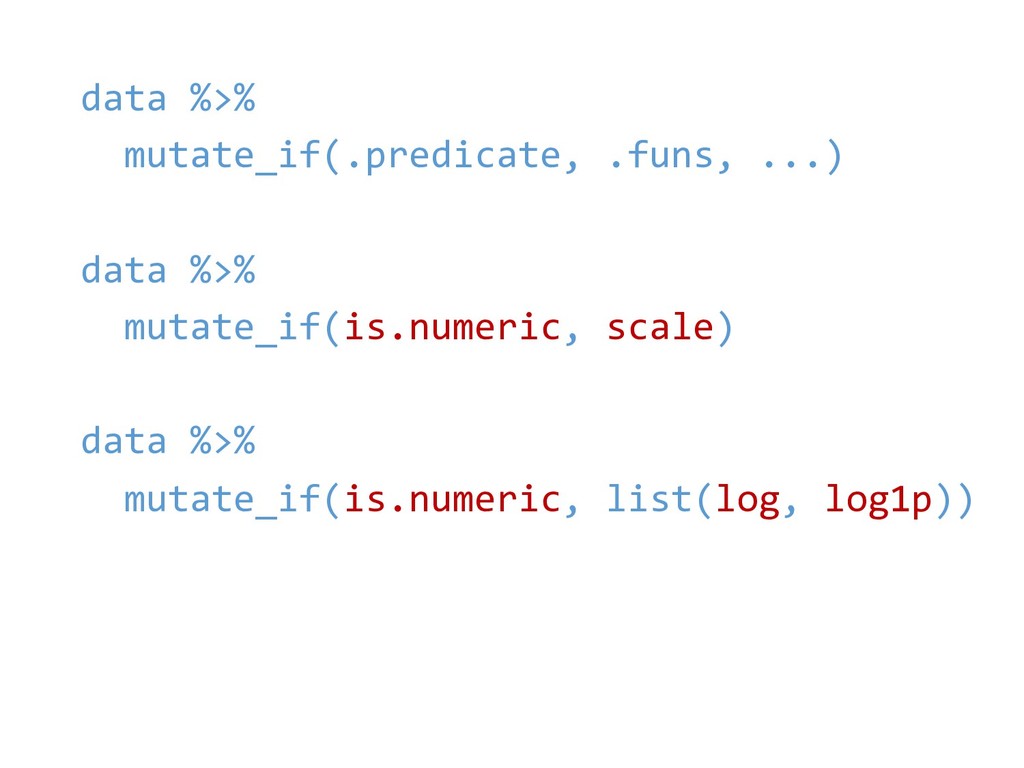
data %>% mutate_if(.predicate, .funs) CC BY SA RStudio https://www.rstudio.com/resources/cheatsheets/
data %>% mutate_if(.predicate, .funs, ...) data %>% mutate_if(is.numeric, scale) data
%>% mutate_if(is.numeric, list(log, log1p))
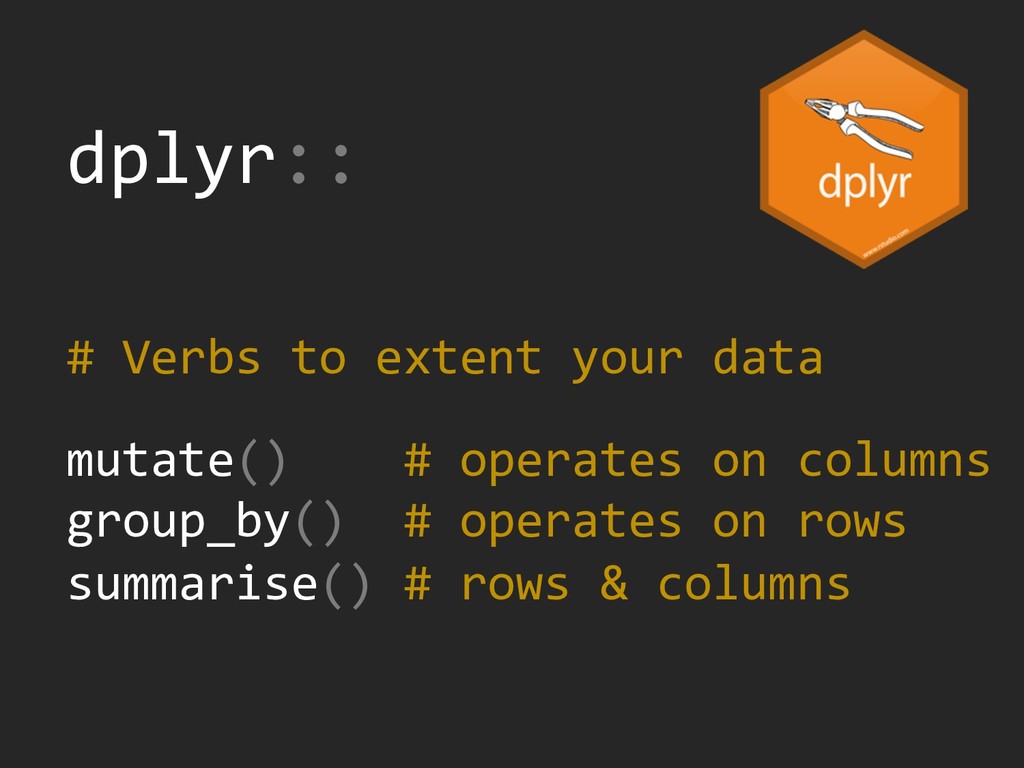
dplyr:: # Verbs to extent your data mutate() # operates
on columns group_by() # operates on rows summarise() # rows & columns
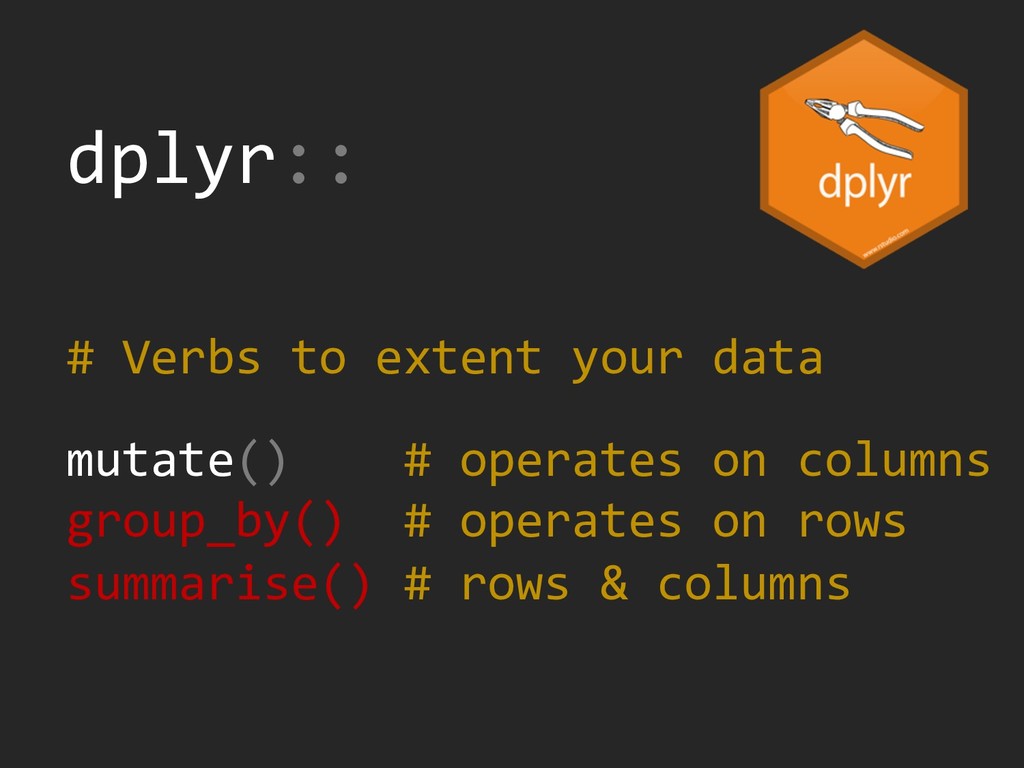
dplyr:: # Verbs to extent your data mutate() # operates
on columns group_by() # operates on rows summarise() # rows & columns
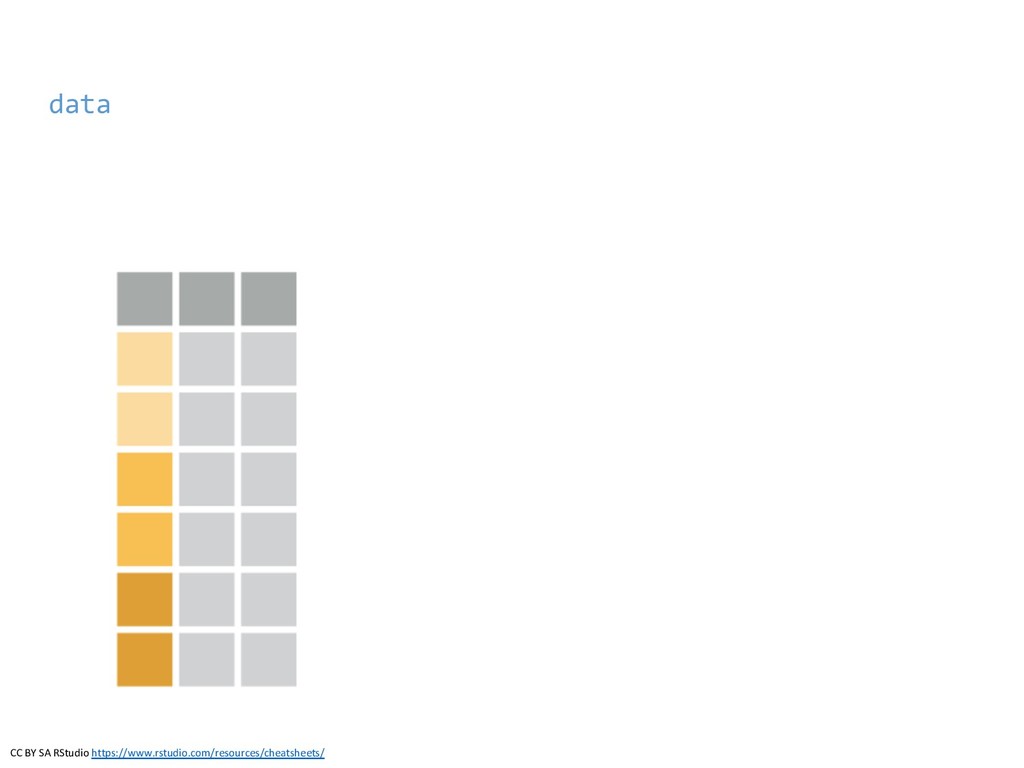
CC BY SA RStudio https://www.rstudio.com/resources/cheatsheets/ data
CC BY SA RStudio https://www.rstudio.com/resources/cheatsheets/ data %>% group_by(veg_type)
CC BY SA RStudio https://www.rstudio.com/resources/cheatsheets/ data %>% group_by(veg_type) %>% summarise(mean_plant_height
= mean(plant_height))
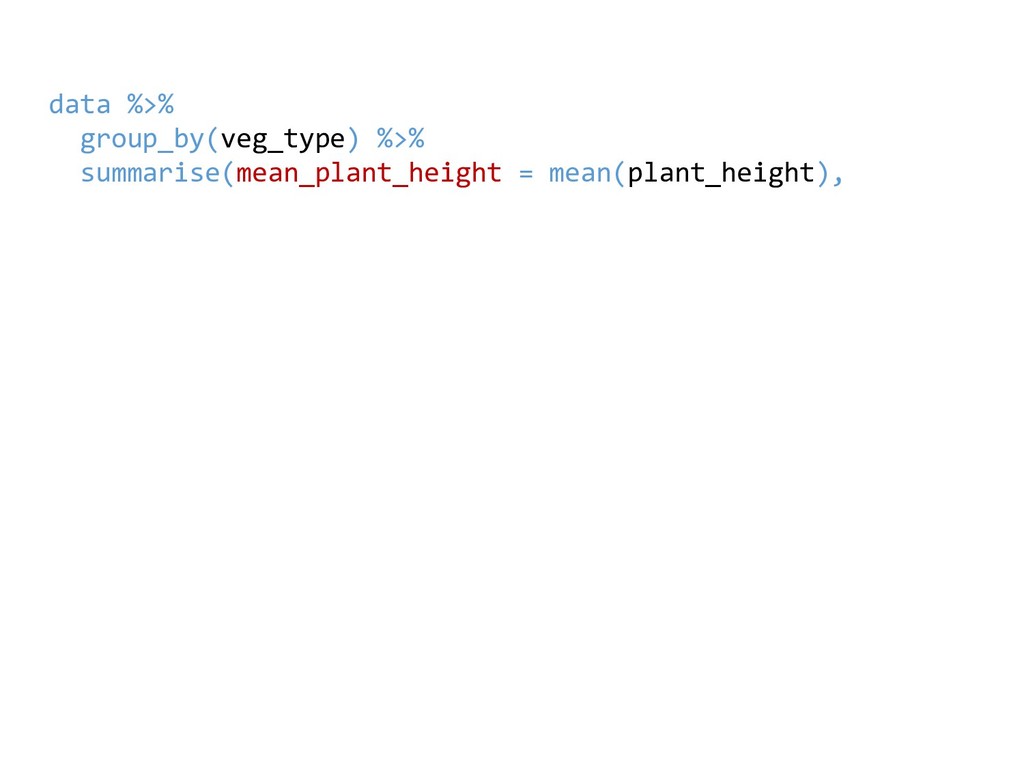
data %>% group_by(veg_type) %>% summarise(mean_plant_height = mean(plant_height),
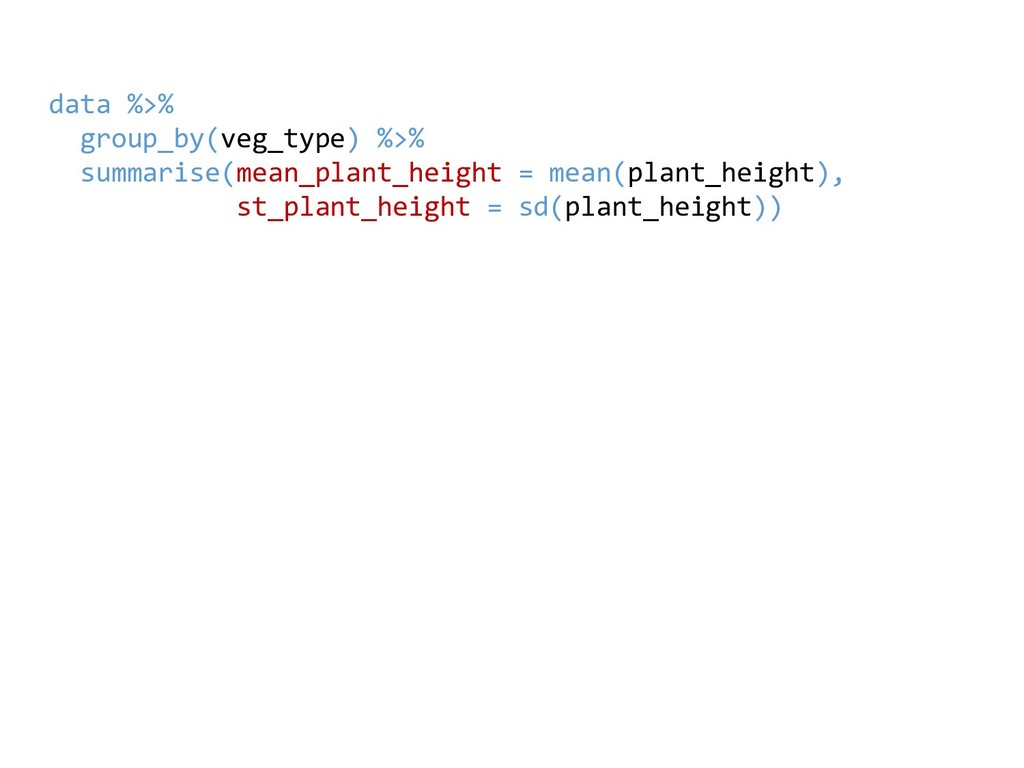
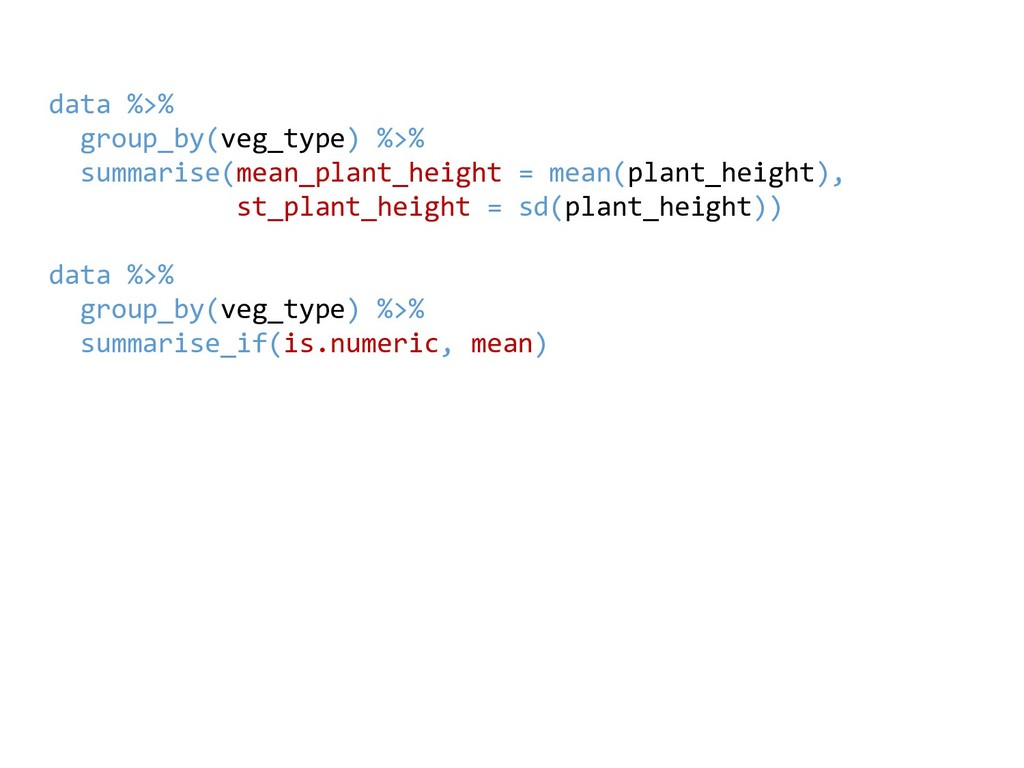
data %>% group_by(veg_type) %>% summarise(mean_plant_height = mean(plant_height), st_plant_height = sd(plant_height))
data %>% group_by(veg_type) %>% summarise(mean_plant_height = mean(plant_height), st_plant_height = sd(plant_height))
data %>% group_by(veg_type) %>% summarise_if(is.numeric, mean)
data %>% group_by(veg_type) %>% summarise(mean_plant_height = mean(plant_height), st_plant_height = sd(plant_height))
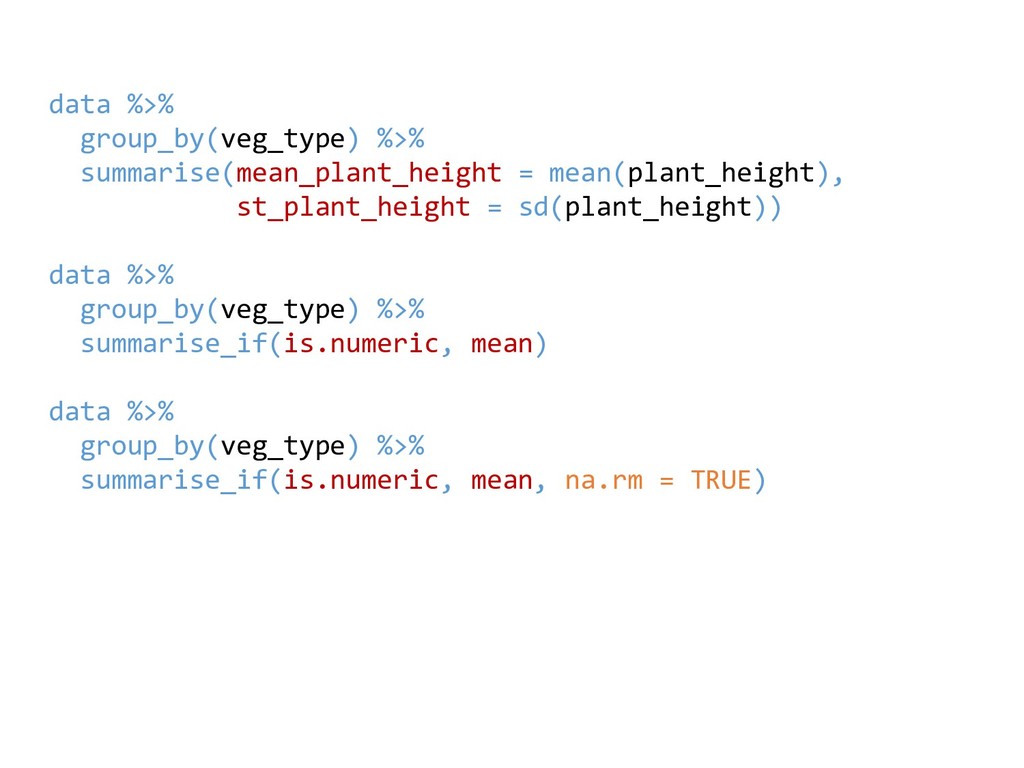
data %>% group_by(veg_type) %>% summarise_if(is.numeric, mean) data %>% group_by(veg_type) %>% summarise_if(is.numeric, mean, na.rm = TRUE)
data %>% group_by(veg_type) %>% summarise(mean_plant_height = mean(plant_height), st_plant_height = sd(plant_height))
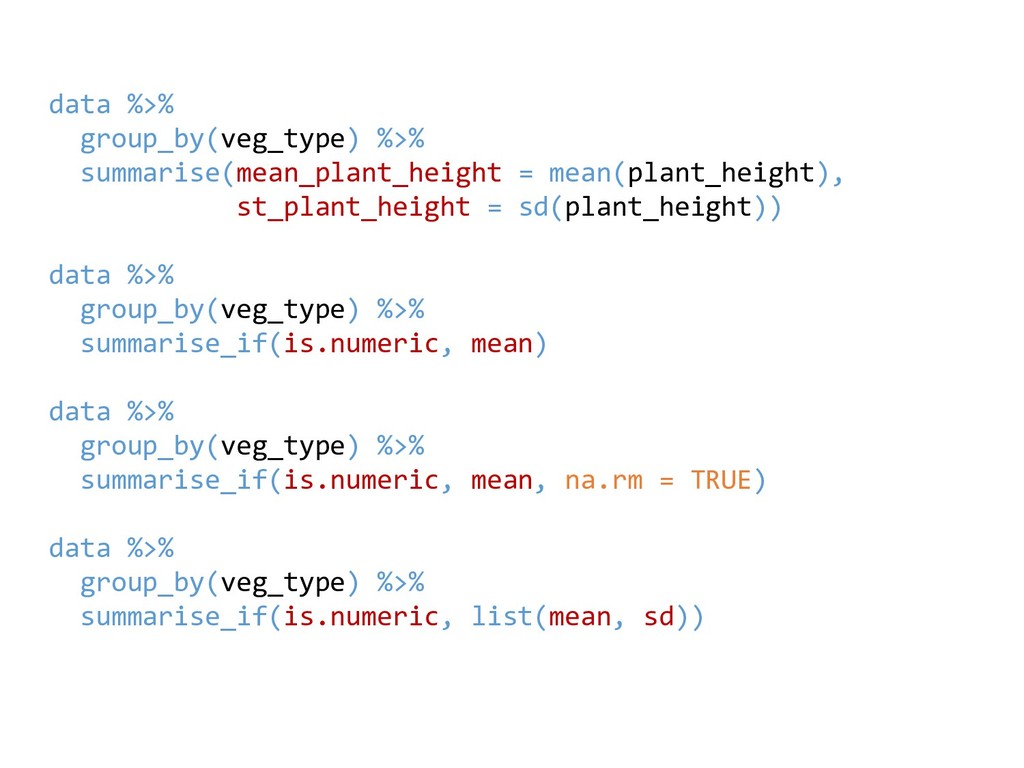
data %>% group_by(veg_type) %>% summarise_if(is.numeric, mean) data %>% group_by(veg_type) %>% summarise_if(is.numeric, mean, na.rm = TRUE) data %>% group_by(veg_type) %>% summarise_if(is.numeric, list(mean, sd))
> demo()

 SiteGround - Reliable hosting with speed, security, and support you can count on.


 rvanmazijk
 yasaichi
 ikura_hamu
 kinakomoti321
 simas
 sorah
 seyfoyun
 minodriven
 xleitix
 onozaty
 hasutosasaki
 mitohato14
 iwiwi
 axbom
 michielstock
 rasagy
 asonas
 stephaniewalter
 kristinabergwall1
 jdejongh
 watany
 lemiorhan
 sugarenia
 techseoconnect
 bkeepers