Upgrade to Pro — share decks privately, control downloads, hide ads and more …

Geographic Analysis in Context: A Visual Search Task Comparing Zooming Metaphors

Geographic Analysis in Context: A Visual Search Task Comparing Zooming Metaphors

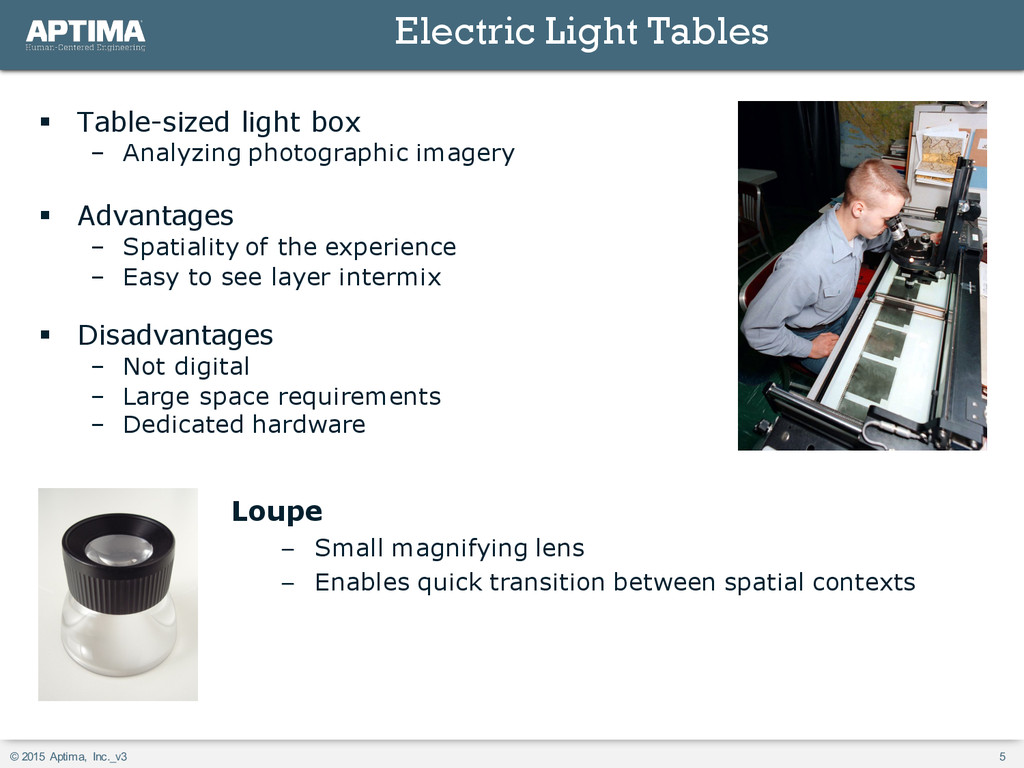
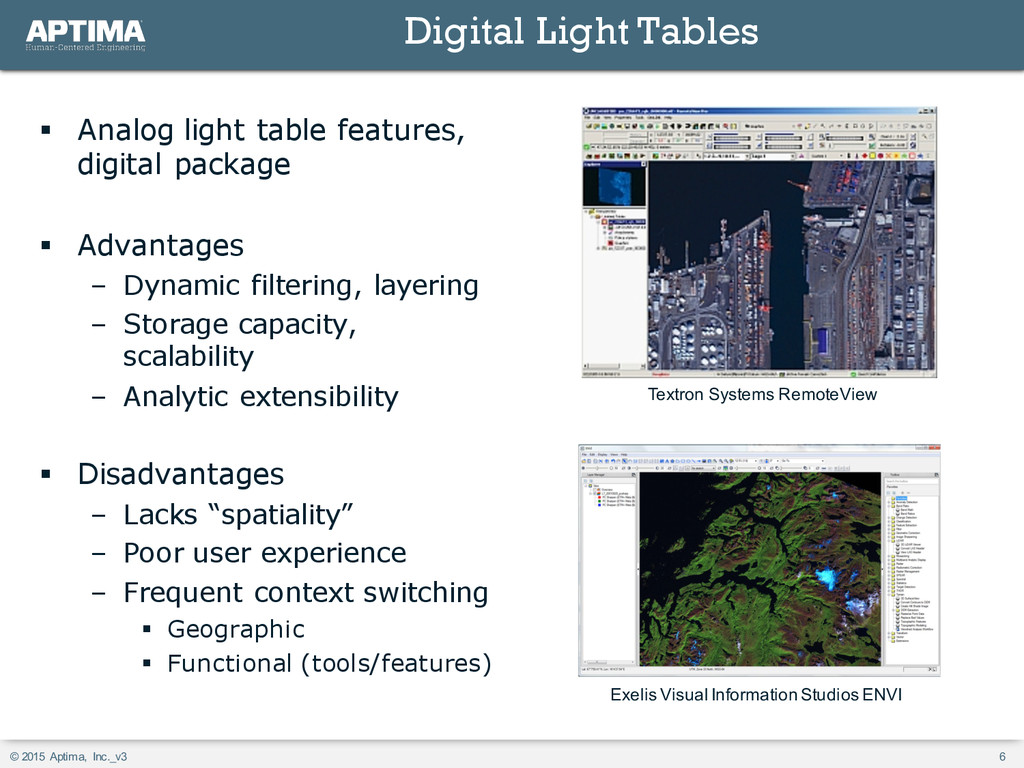
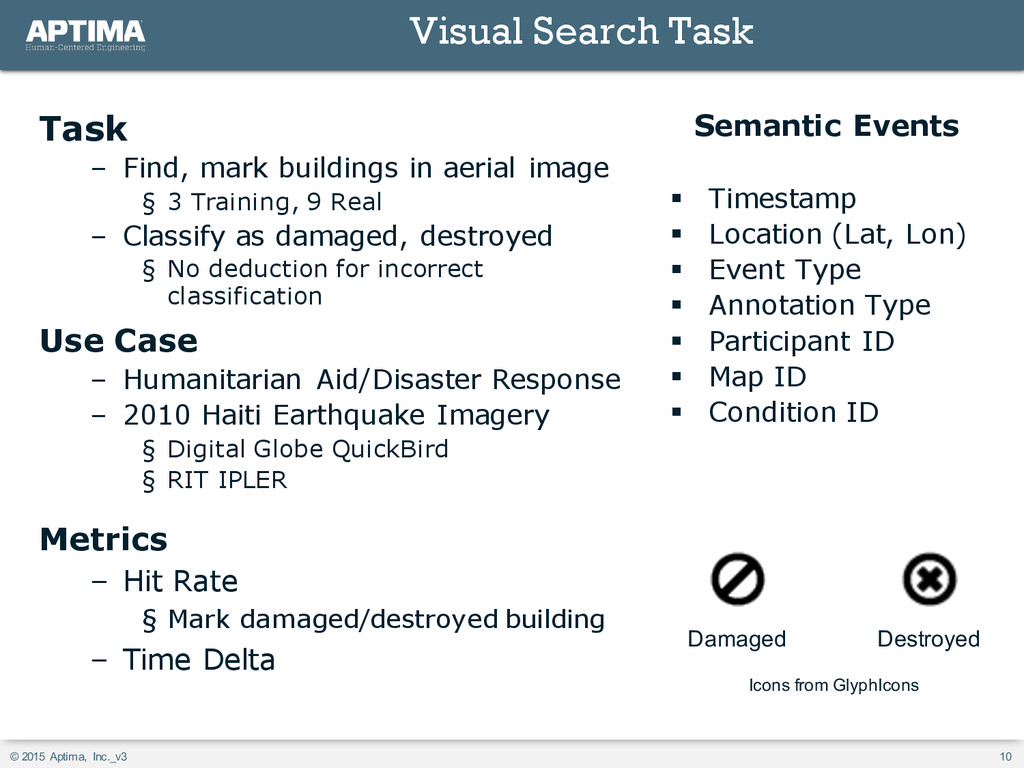
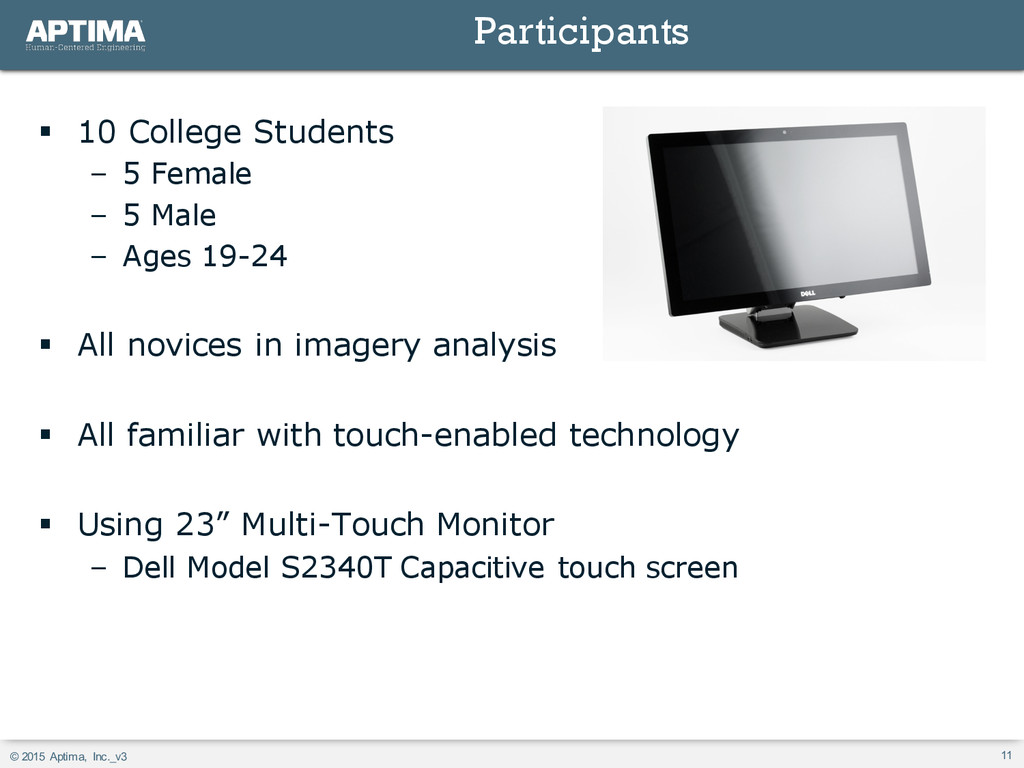
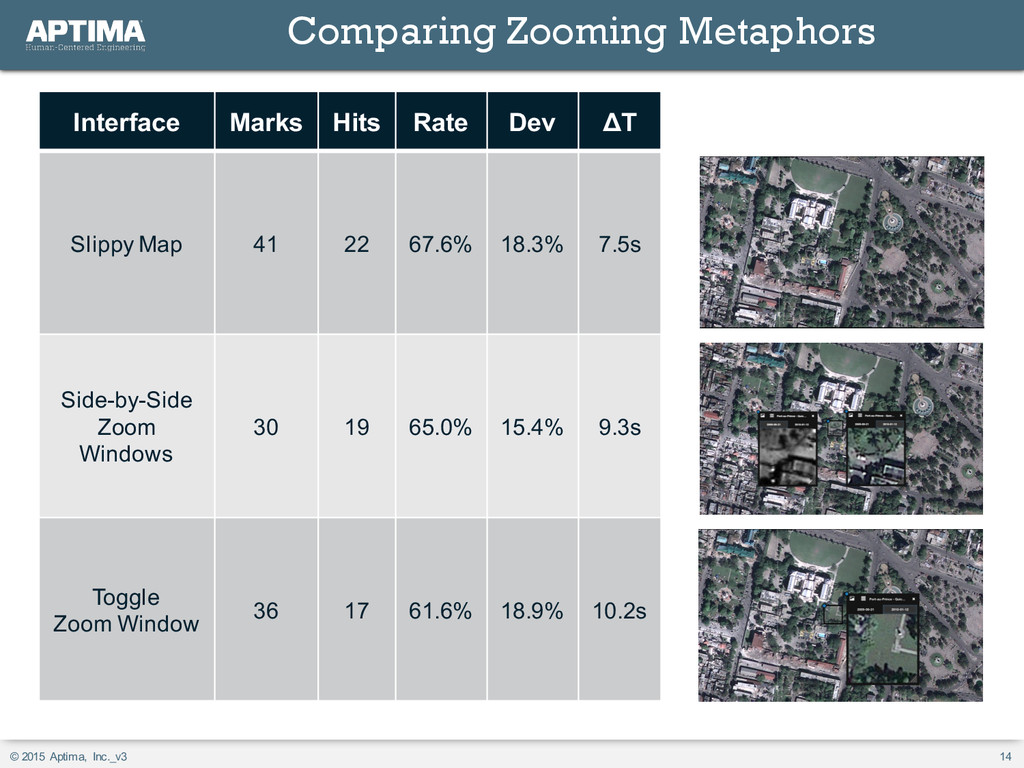
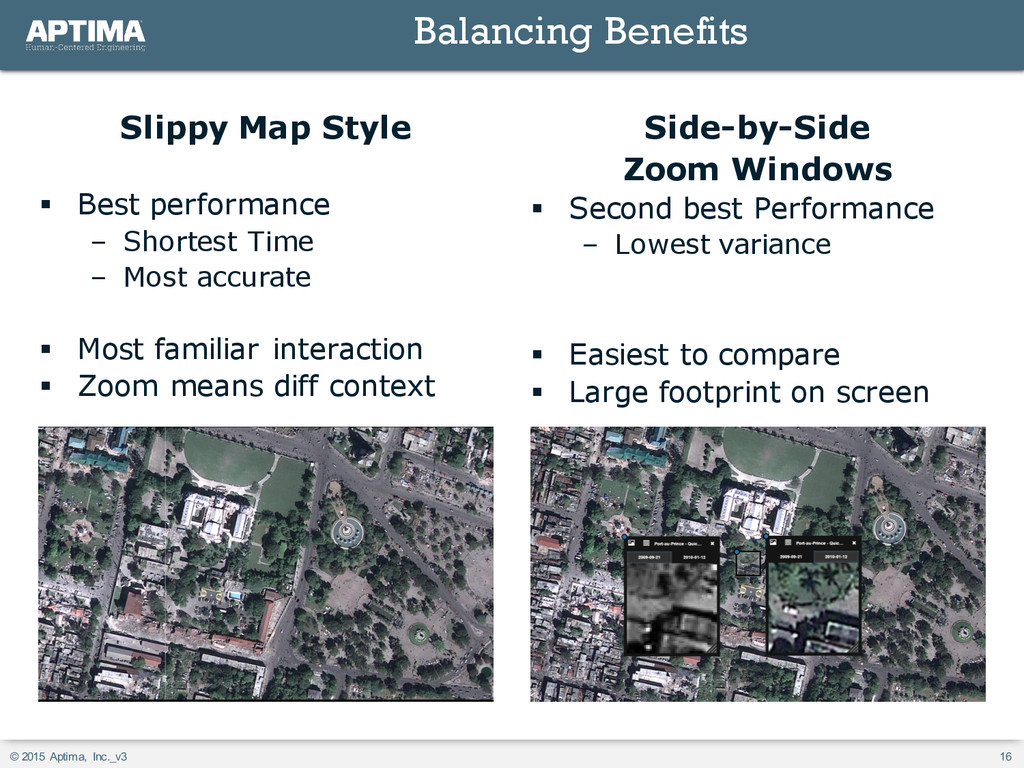
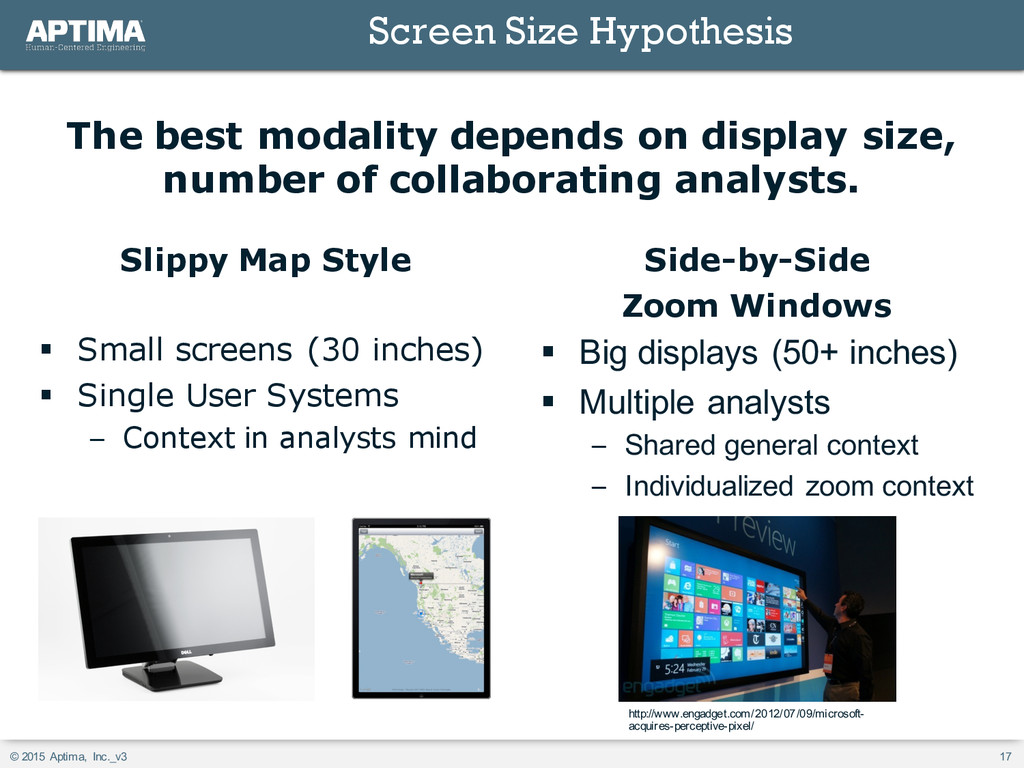
Geospatial analysts are seeking more immersive, context-aware interactions with data that emulate the experience of past analytic processes (e.g. light table and magnifier). We present the results from a pilot study, assessing the usability and utility of interactive zoom windows that were designed to emulate and extend the functionality of a tradition Loupe magnification lens in the digital environment. Twelve participants used two styles of zoom windows and a traditional slippy-map interface to identify, classify, and mark the location of buildings that were either damaged or destroyed during the 2010 Haiti Earthquake. Results show that zoom window interfaces perform at the same level as slippy-map interfaces in this simple task, with a single user on a small touch-enabled screen. Future work with these interfaces will evaluate their performance in complex and team tasks.

Presented at the 2015 Annual Meeting of the North American Cartographic Information Society

Ryan S Mullins

October 15, 2015
Tweet

More Decks by Ryan S Mullins

Other Decks in Research

Transcript

  1. © 2015 Aptima, Inc._v3
    Geographic Analysis
    in Context
    A Visual Search Task
    Comparing Zooming
    Metaphors
    Aptima
    Ryan Mullins
    Chad A. Weiss
    Adam Fouse
    Stacy Pfautz
    Visual Attention Lab
    Krista Ehinger
    Avigael M. Aizenman
    Jeremy Wolfe

    View Slide

  2. © 2015 Aptima, Inc._v3 2
    § Background
    – Geographic Analysis in Context
    – Electric Light Tables
    – Zooming Metaphors
    § Experiment
    – Research Questions
    – Experimental Conditions
    – Task Description
    – Participants and Environment
    § Results
    § Meaning
    Overview

    View Slide

  3. © 2015 Aptima, Inc._v3
    Background

    View Slide

  4. © 2015 Aptima, Inc._v3 4
    § Geographic Analysis ➡ Imagery Analysis
    – Extracting information from imagery
    – Useful in Military, Disaster Response, other applications
    – Othro, oblique images
    § Context
    – How does surrounding geography affect location, object?
    – What can we infer about an object given its surroundings?
    – How does this context shape decisions, actions?
    – Account for both Human and Physical components
    Geographic Analysis in Context

    View Slide

  5. © 2015 Aptima, Inc._v3 5
    Click to edit Master title style
    § Table-sized light box
    – Analyzing photographic imagery
    § Advantages
    – Spatiality of the experience
    – Easy to see layer intermix
    § Disadvantages
    – Not digital
    – Large space requirements
    – Dedicated hardware
    Electric Light Tables
    Loupe
    – Small magnifying lens
    – Enables quick transition between spatial contexts

    View Slide

  6. © 2015 Aptima, Inc._v3 6
    Click to edit Master title style
    § Analog light table features,
    digital package
    § Advantages
    – Dynamic filtering, layering
    – Storage capacity,
    scalability
    – Analytic extensibility
    § Disadvantages
    – Lacks “spatiality”
    – Poor user experience
    – Frequent context switching
    § Geographic
    § Functional (tools/features)
    Digital Light Tables
    Textron Systems RemoteView
    Exelis Visual Information Studios ENVI

    View Slide

  7. © 2015 Aptima, Inc._v3
    Experiment

    View Slide

  8. © 2015 Aptima, Inc._v3 8
    Is there a best way to digitally
    emulate the experience of using
    a light table and a loupe for
    imagery analysis?
    Comparing Zooming Metaphors

    View Slide

  9. © 2015 Aptima, Inc._v3 9
    Click to edit Master title style
    Slippy Map Style
    – Pinch-to-zoom base map
    – Layer toggles in title bar
    Hypothesis: 1 of 3 Metaphors
    Zoom Window with Toggle
    – No zoom on base map
    – Pinch-to-zoom in windows
    – Layer toggles in zoom Window
    Side-by-side Zoom Windows
    – No zoom on base map
    – Pinch-to-zoom in windows
    – 1 window per layer, same footprint

    View Slide

  10. © 2015 Aptima, Inc._v3 10
    Click to edit Master title style
    Semantic Events
    § Timestamp
    § Location (Lat, Lon)
    § Event Type
    § Annotation Type
    § Participant ID
    § Map ID
    § Condition ID
    Visual Search Task
    Task
    – Find, mark buildings in aerial image
    § 3 Training, 9 Real
    – Classify as damaged, destroyed
    § No deduction for incorrect
    classification
    Use Case
    – Humanitarian Aid/Disaster Response
    – 2010 Haiti Earthquake Imagery
    § Digital Globe QuickBird
    § RIT IPLER
    Metrics
    – Hit Rate
    § Mark damaged/destroyed building
    – Time Delta
    Damaged Destroyed
    Icons from GlyphIcons

    View Slide

  11. © 2015 Aptima, Inc._v3 11
    § 10 College Students
    – 5 Female
    – 5 Male
    – Ages 19-24
    § All novices in imagery analysis
    § All familiar with touch-enabled technology
    § Using 23” Multi-Touch Monitor
    – Dell Model S2340T Capacitive touch screen
    Participants

    View Slide

  12. © 2015 Aptima, Inc._v3
    Results

    View Slide

  13. © 2015 Aptima, Inc._v3 13
    Click to edit Master title style
    Nope
    But there might be a loser…
    Zoom Window with Toggle
    § Lowest Hit Rate
    – Largest Deviation
    § Longest Time Delta
    Is There A Superior Metaphor?

    View Slide

  14. © 2015 Aptima, Inc._v3 14
    Click to edit Master title style
    Interface Marks Hits Rate Dev ΔT
    Slippy Map 41 22 67.6% 18.3% 7.5s
    Side-by-Side
    Zoom
    Windows
    30 19 65.0% 15.4% 9.3s
    Toggle
    Zoom Window
    36 17 61.6% 18.9% 10.2s
    Comparing Zooming Metaphors

    View Slide

  15. © 2015 Aptima, Inc._v3
    Meaning

    View Slide

  16. © 2015 Aptima, Inc._v3 16
    Click to edit Master title style
    Slippy Map Style
    § Best performance
    – Shortest Time
    – Most accurate
    § Most familiar interaction
    § Zoom means diff context
    Side-by-Side
    Zoom Windows
    § Second best Performance
    – Lowest variance
    § Easiest to compare
    § Large footprint on screen
    Balancing Benefits

    View Slide

  17. © 2015 Aptima, Inc._v3 17
    Click to edit Master title style
    Slippy Map Style
    § Small screens (30 inches)
    § Single User Systems
    – Context in analysts mind
    Side-by-Side
    Zoom Windows
    § Big displays (50+ inches)
    § Multiple analysts
    – Shared general context
    – Individualized zoom context
    The best modality depends on display size,
    number of collaborating analysts.
    Screen Size Hypothesis
    http://www.engadget.com/2012/07/09/microsoft-
    acquires-perceptive-pixel/

    View Slide

  18. © 2015 Aptima, Inc._v3
    Ryan S Mullins | Research Engineer
    Lead, Interactive Intelligent Systems
    [email protected]
    Direct: 781.496.2452
    Aptima, Inc. | www.aptima.com
    12 Gill Street, Suite 1400
    Woburn, MA 01801

    View Slide