Upgrade to Pro — share decks privately, control downloads, hide ads and more …

Mapping Virtual Traffic in Real Space and Time

Mapping Virtual Traffic in Real Space and Time

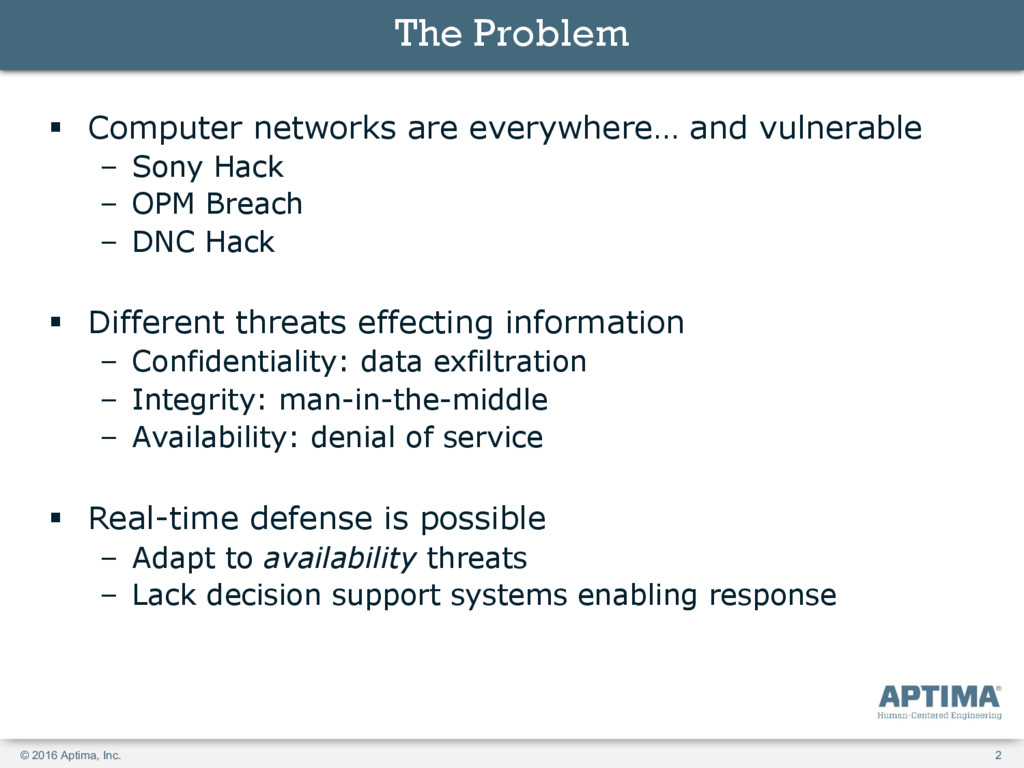
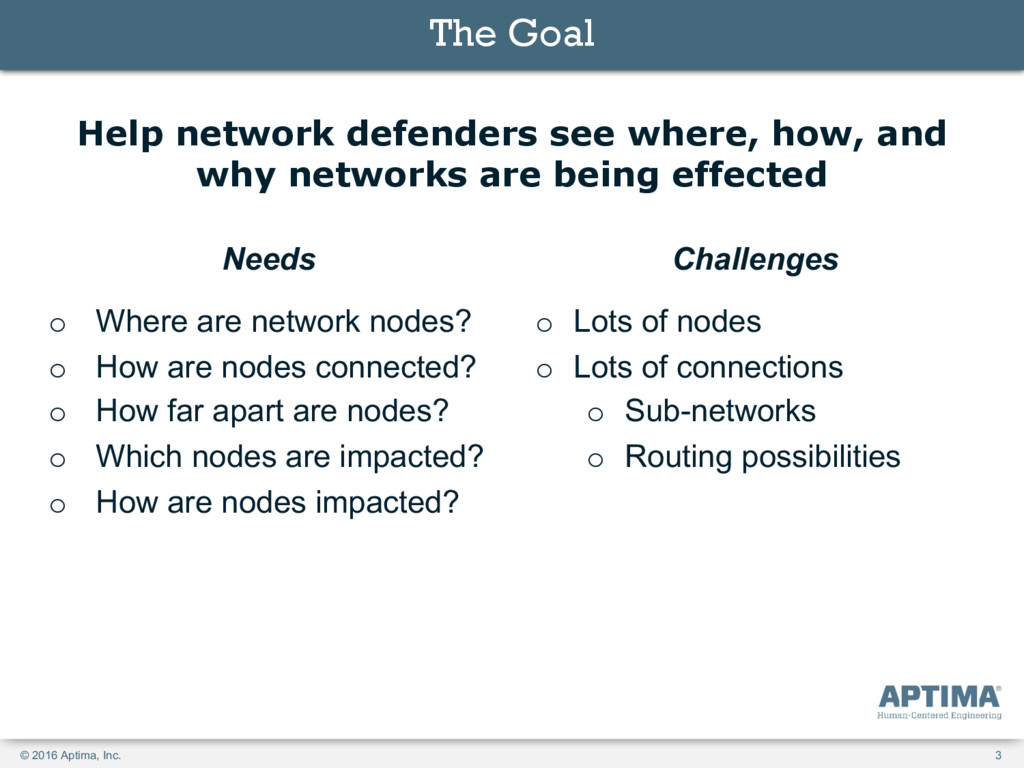
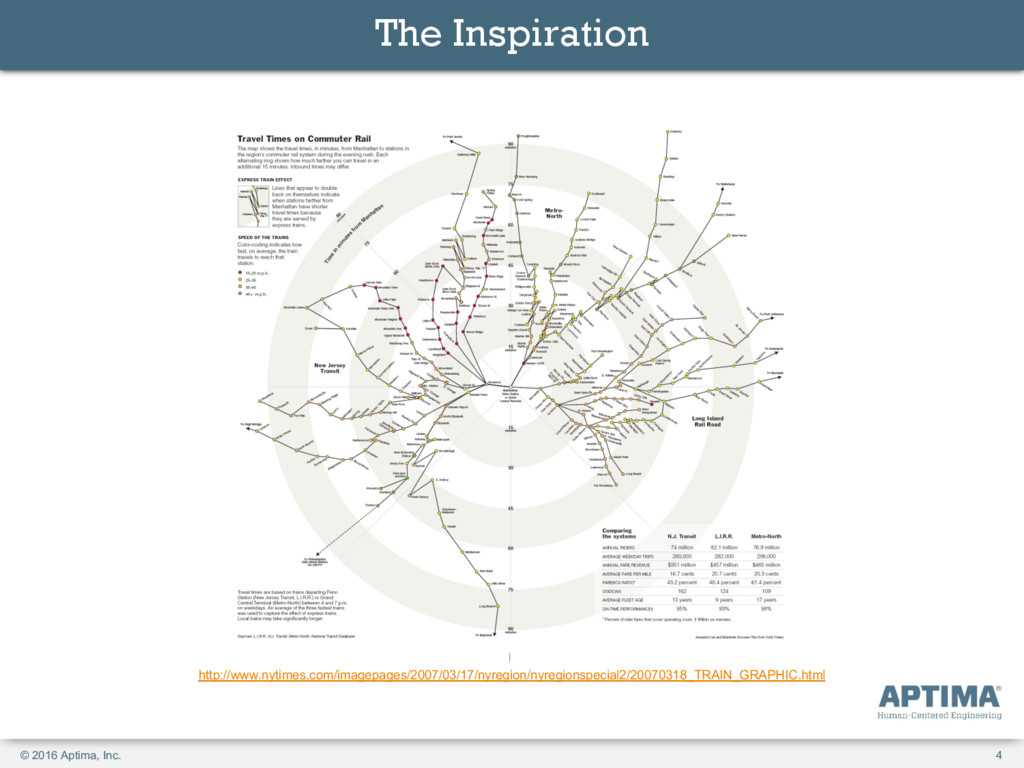
Computer networks are essential to modern communication. Understanding the logical and spatiotemporal connections of these networks is an essential requirement for those ensuring information availability, integrity, and confidentiality. Past network visualizations have, generally, focused on representing either their logical structure or physical location. Approaches to the former typically involve node-link diagrams, which offer utility for small networks but fail when scaled to the complexities of large modern networks. Approaches to the latter effectively communicate where networked assets are, but place significant cognitive load on the human figure out how and how quickly information will get there. In this presentation, we present a novel network visualization concept which combines approaches from traffic mapping and node-link diagrams to show the minimum time to communicate between network nodes. Additionally, we present some initial findings from a usability analysis that sheds some light on the important geographic attributes for network visualizations.

Ryan S Mullins

October 21, 2016
Tweet

More Decks by Ryan S Mullins

Other Decks in Research

Transcript

  1. © 2016 Aptima, Inc. Mapping Virtual Traffic in Real Space

    and Time Ryan Mullins Caroline Ziemkiewicz Adam Fouse
  2. © 2016 Aptima, Inc. 2 The Problem § Computer networks

    are everywhere… and vulnerable – Sony Hack – OPM Breach – DNC Hack § Different threats effecting information – Confidentiality: data exfiltration – Integrity: man-in-the-middle – Availability: denial of service § Real-time defense is possible – Adapt to availability threats – Lack decision support systems enabling response
  3. © 2016 Aptima, Inc. 3 The Goal Help network defenders

    see where, how, and why networks are being effected Needs o Where are network nodes? o How are nodes connected? o How far apart are nodes? o Which nodes are impacted? o How are nodes impacted? Challenges o Lots of nodes o Lots of connections o Sub-networks o Routing possibilities
  4. © 2016 Aptima, Inc. 4 Click to edit Master title

    style The Inspiration http://www.nytimes.com/imagepages/2007/03/17/nyregion/nyregionspecial2/20070318_TRAIN_GRAPHIC.html
  5. © 2016 Aptima, Inc. 6 Click to edit Master title

    style § Good – Salient representation of logical structure – Persistent picture as nodes “change” – Deterministic layout § Not-so-good – Logical >> Spatial – Overt bearing info is irrelevant – Needs more spatial context (i.e., terrain) – Multi-path representation – Sub-network exploration The Feedback
  6. © 2016 Aptima, Inc. Ryan Mullins | Research Engineer Lead,

    Interactive Intelligent Systems [email protected] Direct: 781-496-2452 Aptima, Inc. | www.aptima.com 12 Gill Street, Suite 1400 Woburn, MA 01801 The research reported in this presentation was performed in connection with contract #FA8750-15-C-0210 with the U.S. Air Force Research Laboratory. The views and conclusions contained in this presentation are those of the authors and should not be interpreted as presenting the official policies or position, either expressed or implied, of the U.S. Air Force Research Laboratory or the U.S. Government unless so designated by other authorized documents.