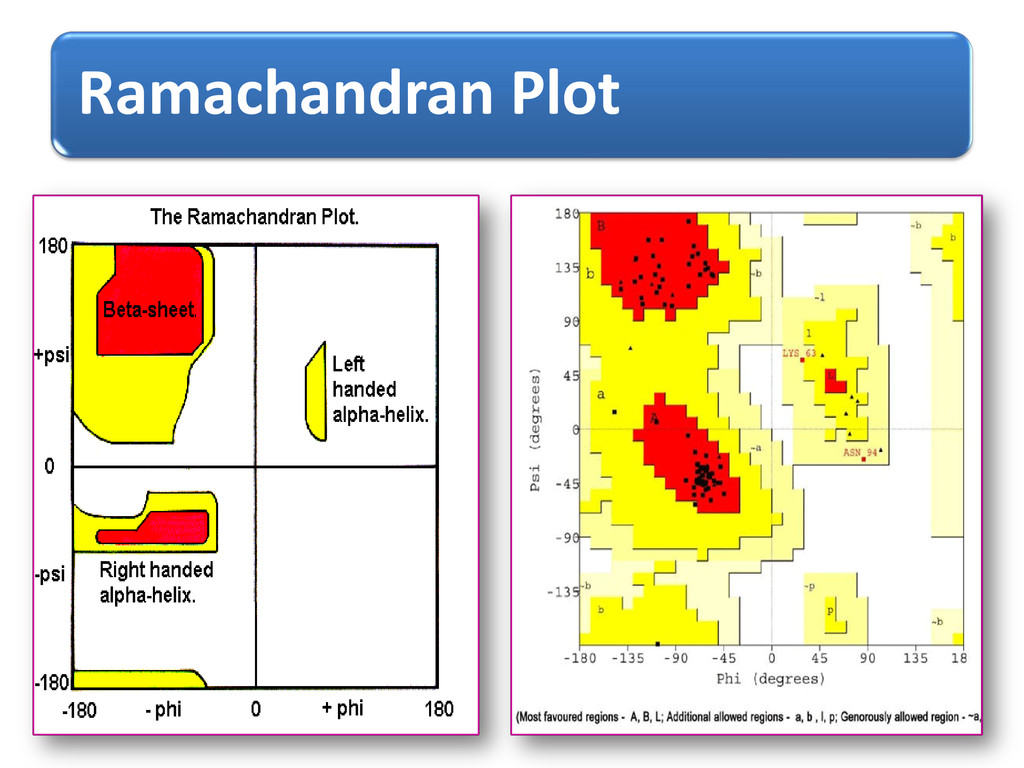
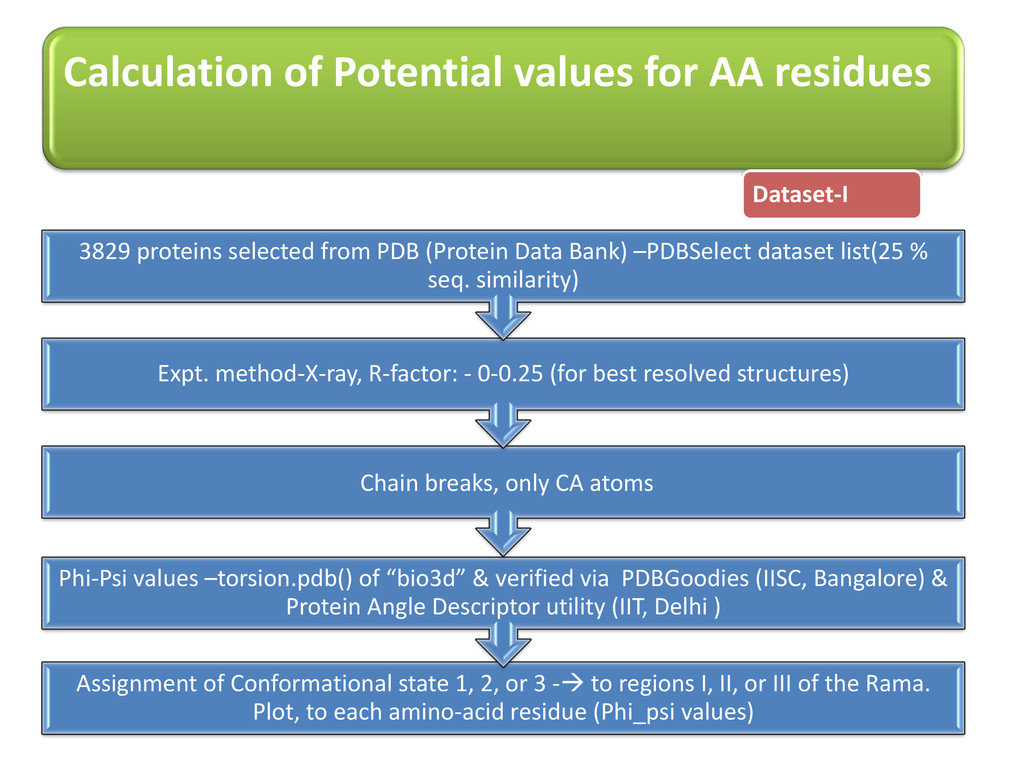
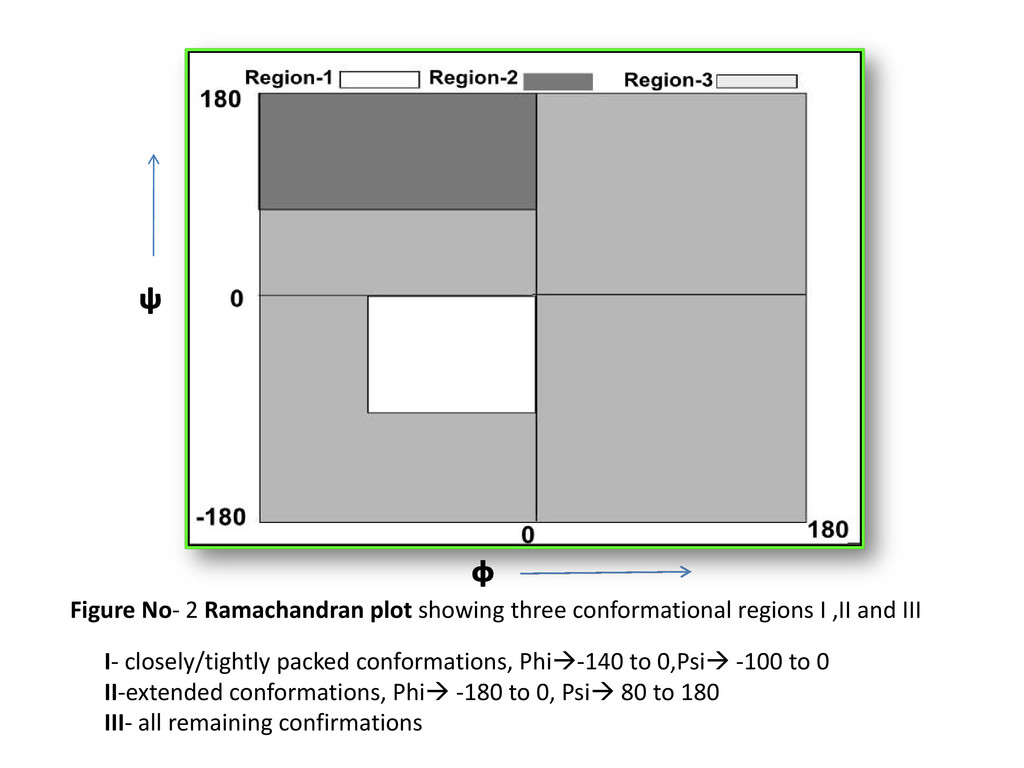
Conformational state 1, 2, or 3 - to regions I, II, or III of the Rama. Plot, to each amino-acid residue (Phi_psi values) Phi-Psi values –torsion.pdb() of “bio3d” & verified via PDBGoodies (IISC, Bangalore) & Protein Angle Descriptor utility (IIT, Delhi ) Chain breaks, only CA atoms Expt. method-X-ray, R-factor: - 0-0.25 (for best resolved structures) 3829 proteins selected from PDB (Protein Data Bank) –PDBSelect dataset list(25 % seq. similarity)
,II and III I- closely/tightly packed conformations, Phi-140 to 0,Psi -100 to 0 II-extended conformations, Phi -180 to 0, Psi 80 to 180 III- all remaining confirmations ᵠ ᶲ
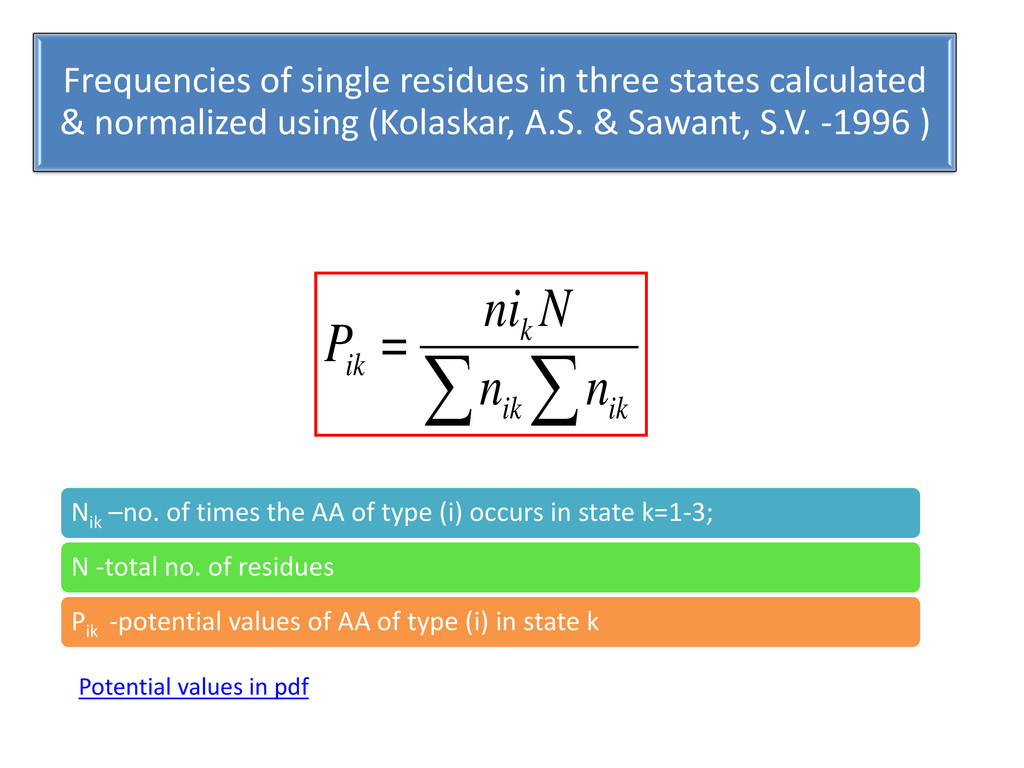
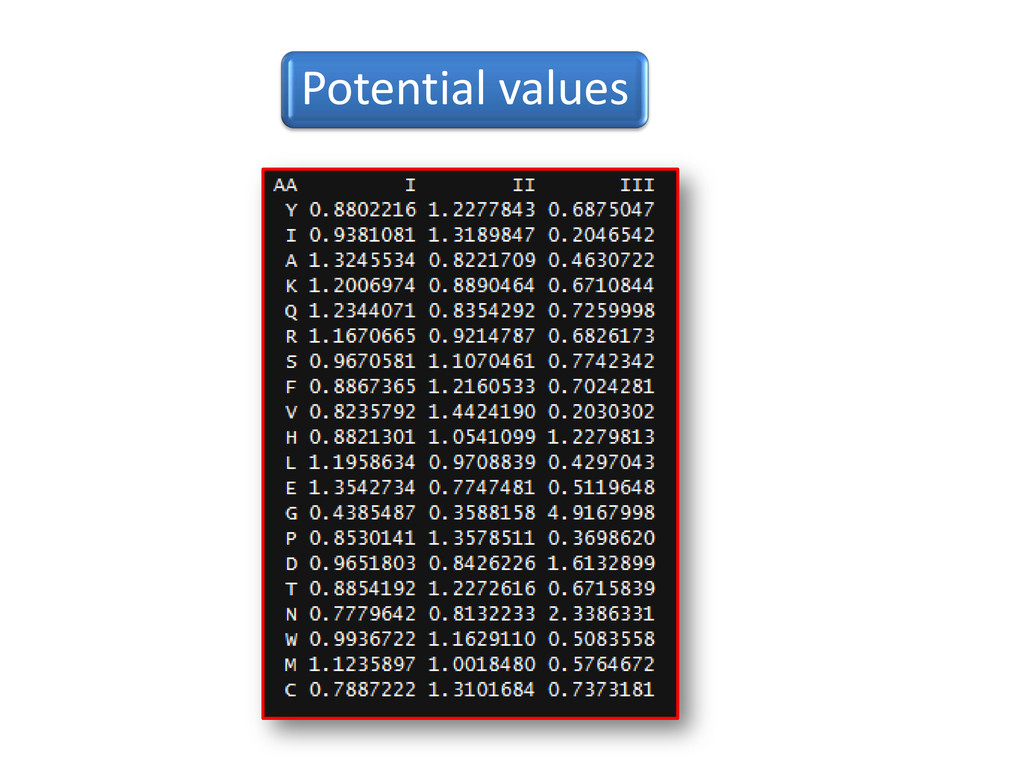
using (Kolaskar, A.S. & Sawant, S.V. -1996 ) ∑ ∑ ik ik k ik n n N ni = P Nik –no. of times the AA of type (i) occurs in state k=1-3; N -total no. of residues Pik -potential values of AA of type (i) in state k Potential values in pdf
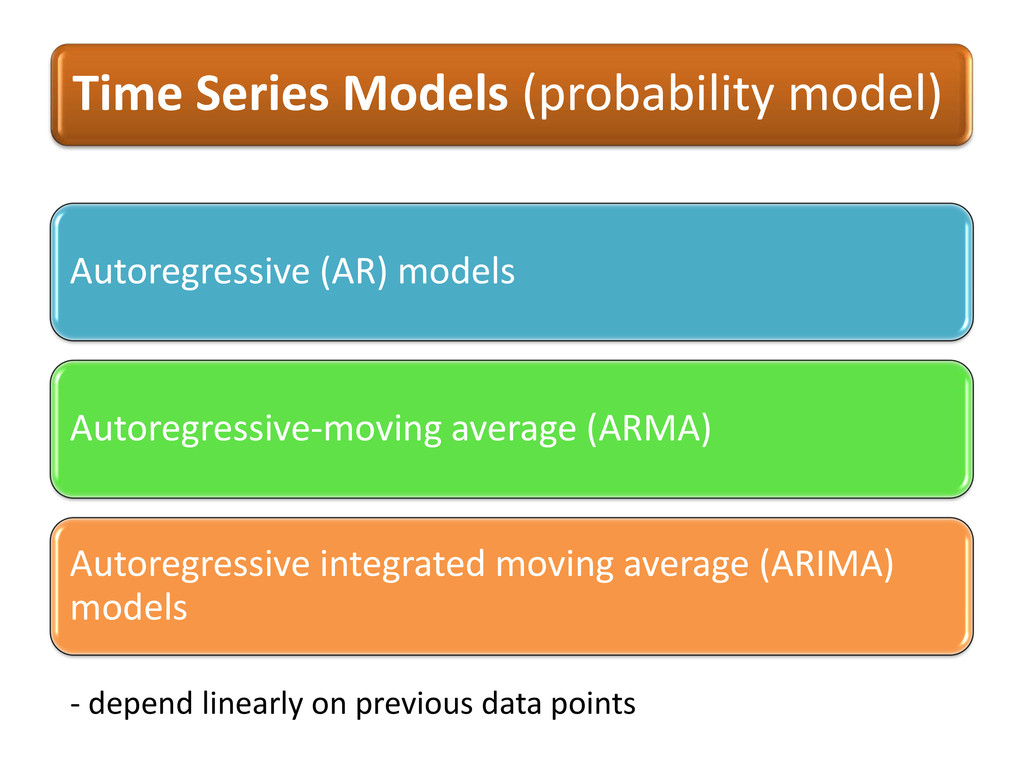
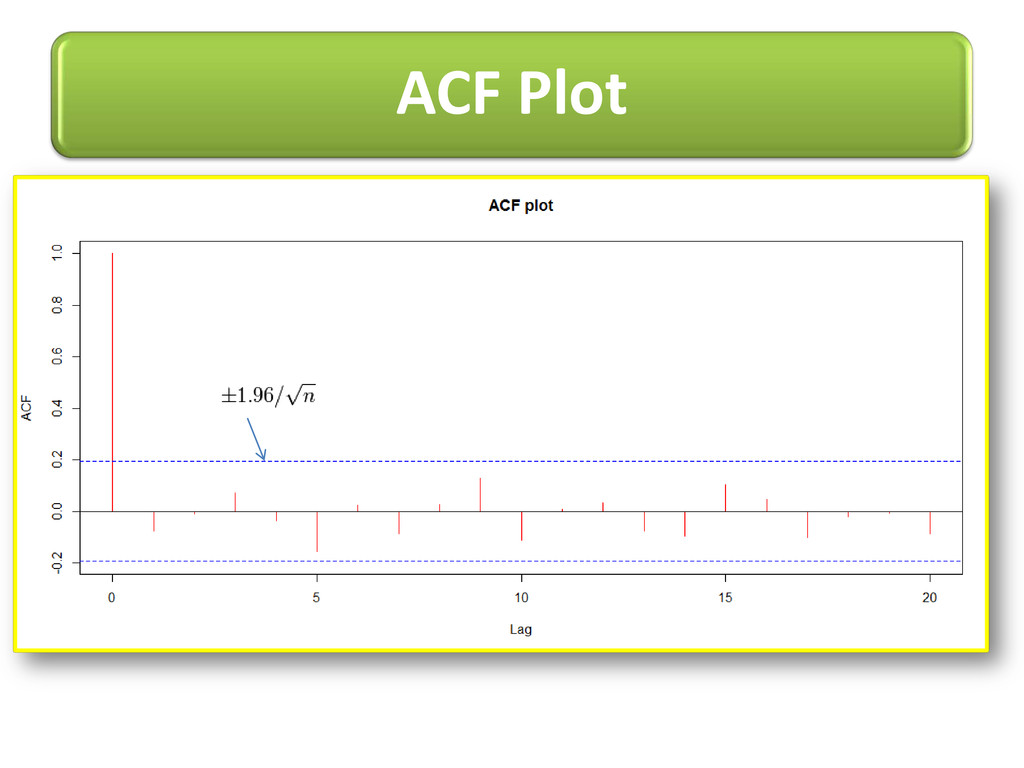
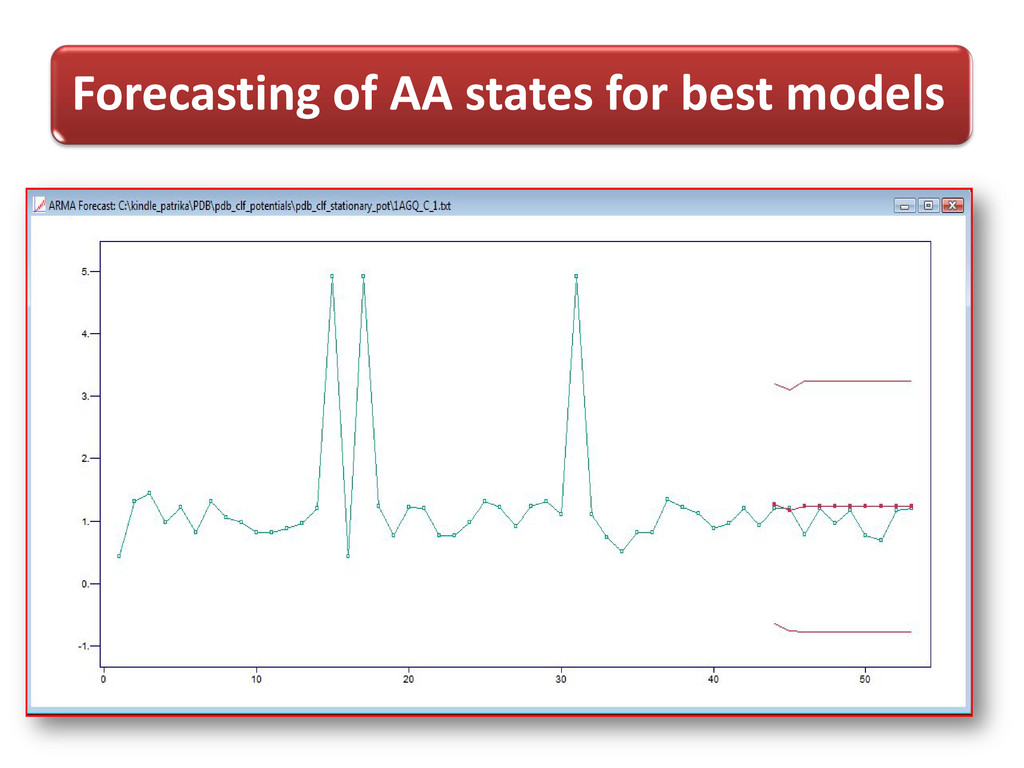
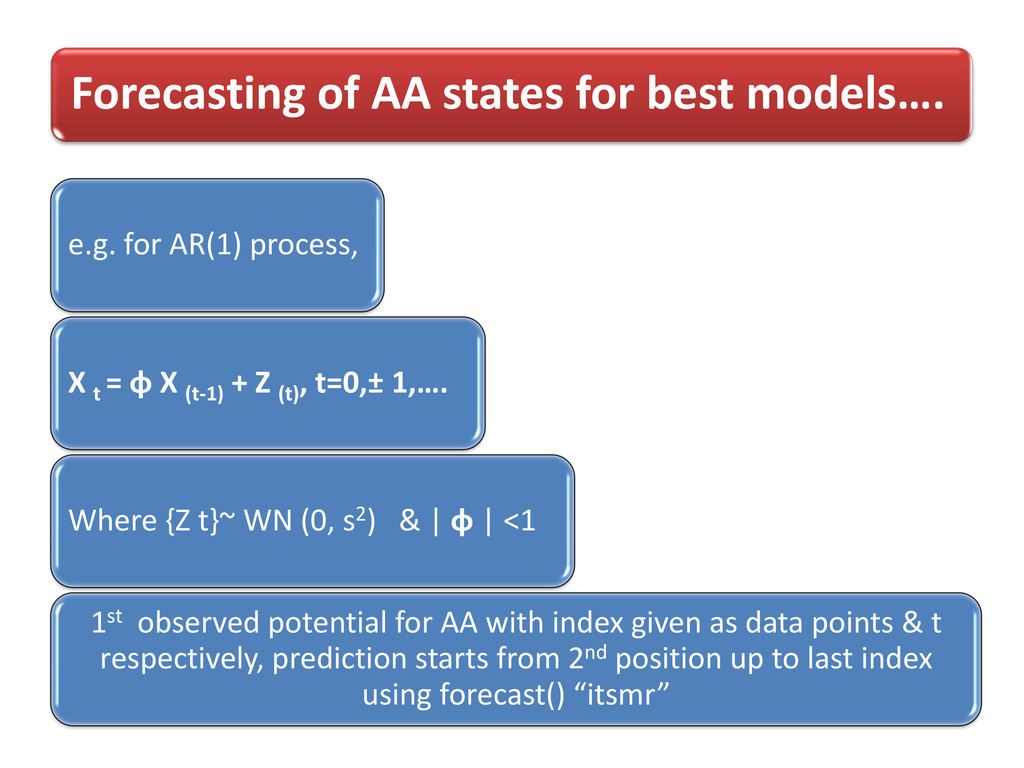
process, X t = φ X (t-1) + Z (t) , t=0,± 1,…. Where {Z t}~ WN (0, s2) & | φ | <1 1st observed potential for AA with index given as data points & t respectively, prediction starts from 2nd position up to last index using forecast() “itsmr”
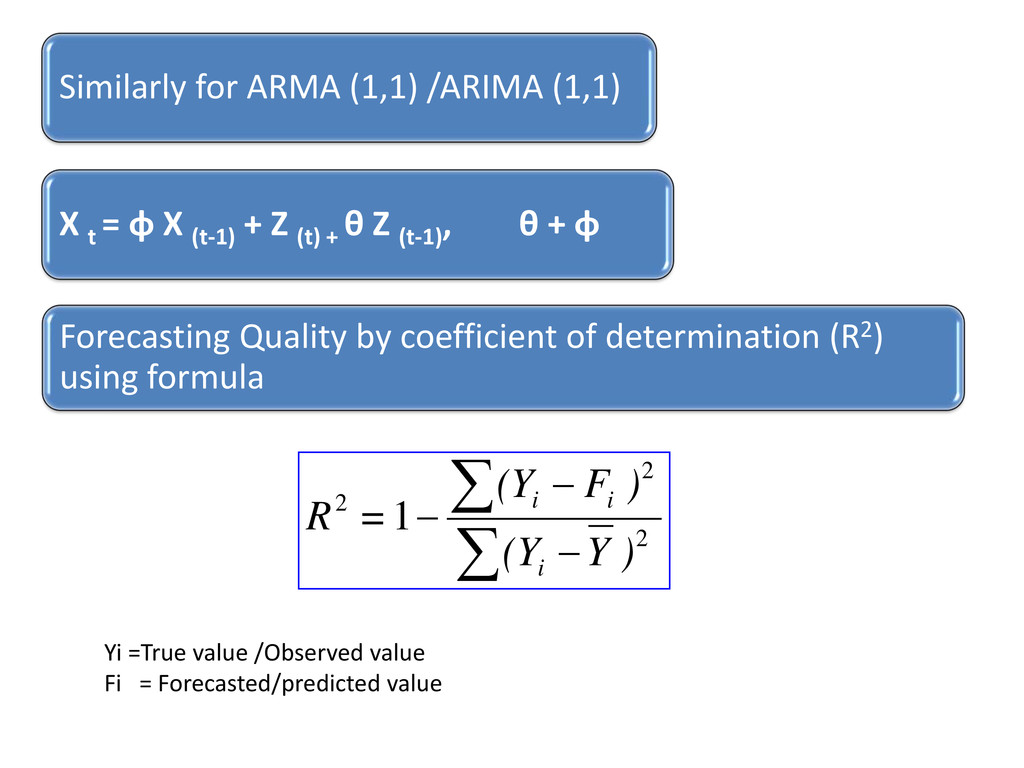
X (t-1) + Z (t) + θ Z (t-1) , θ + φ Forecasting Quality by coefficient of determination (R2) using formula ∑ ∑ − − − 2 2 2 1 ) Y (Y ) F (Y = R i i i Yi =True value /Observed value Fi = Forecasted/predicted value
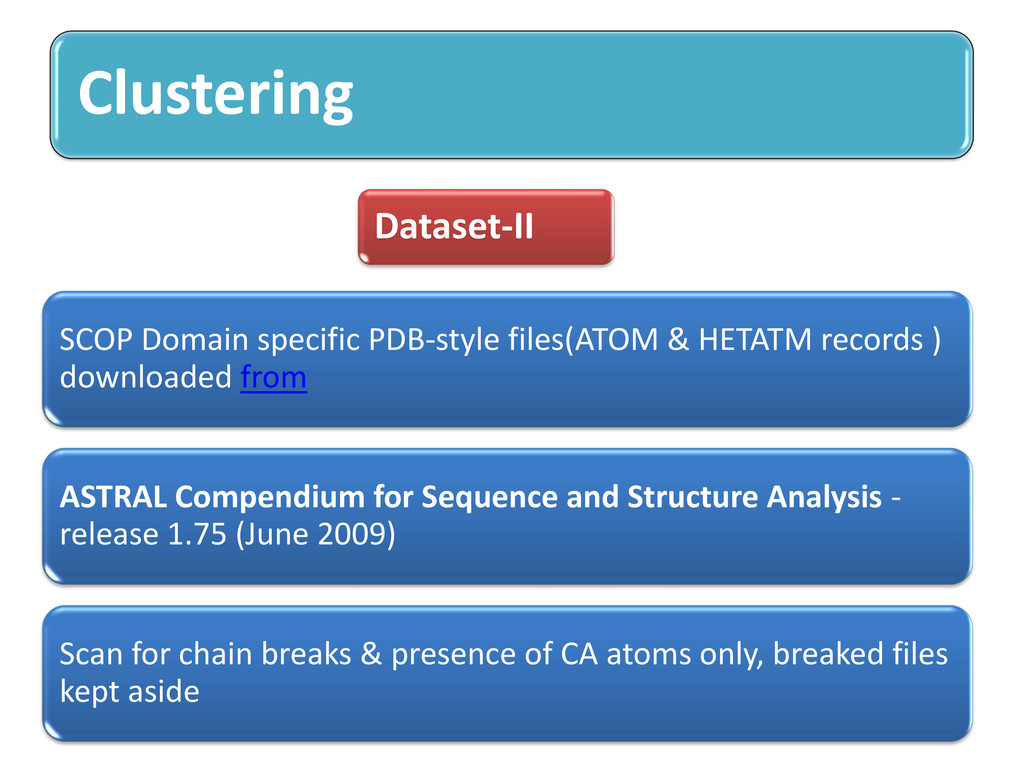
) downloaded from ASTRAL Compendium for Sequence and Structure Analysis - release 1.75 (June 2009) Scan for chain breaks & presence of CA atoms only, breaked files kept aside
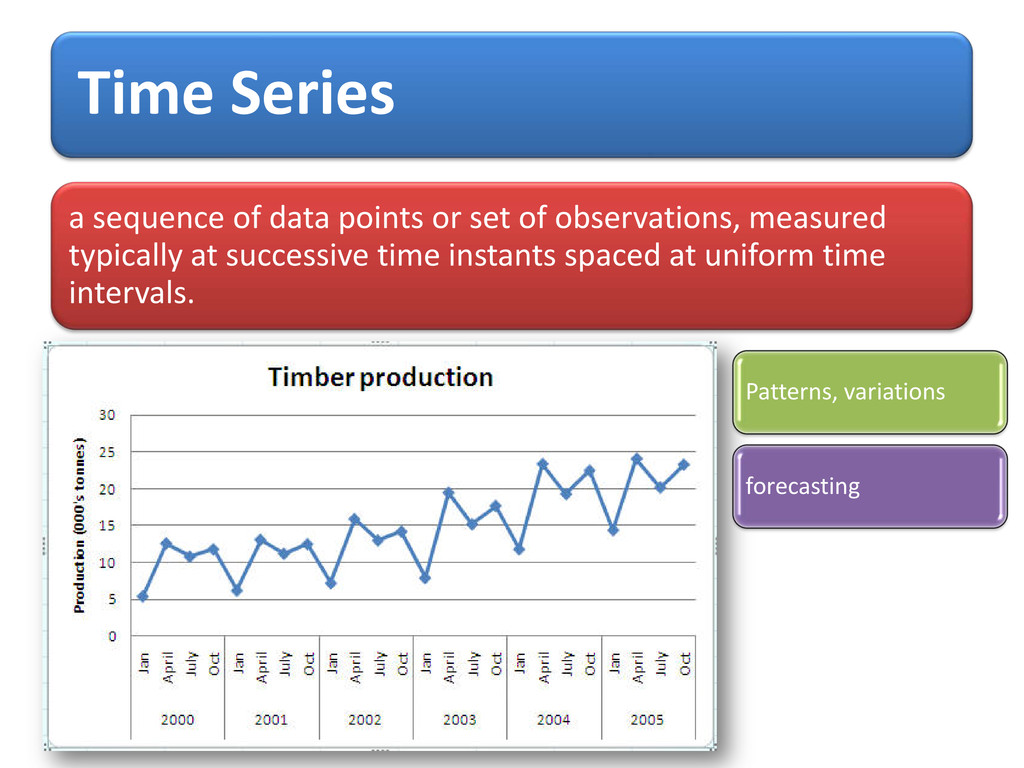
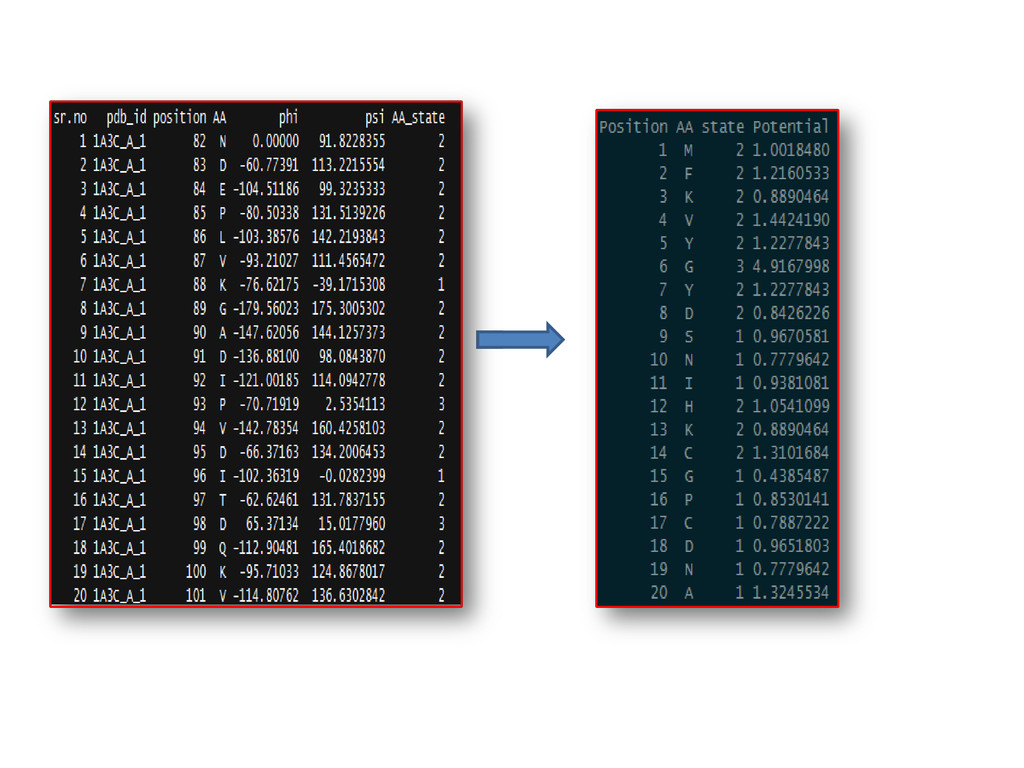
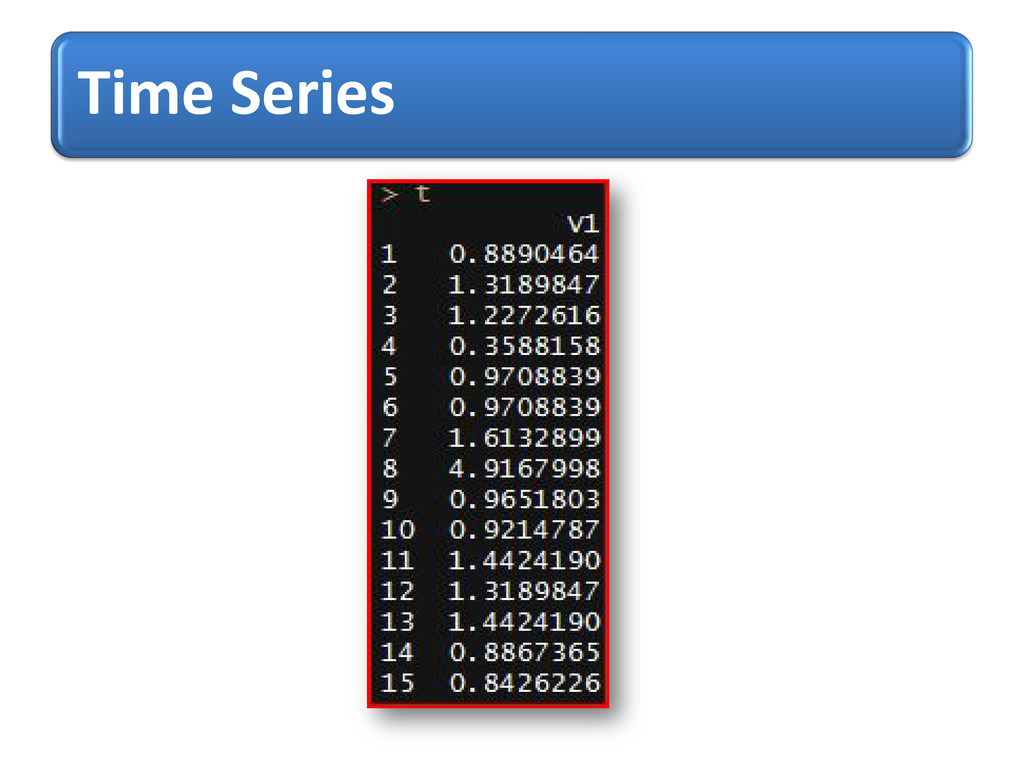
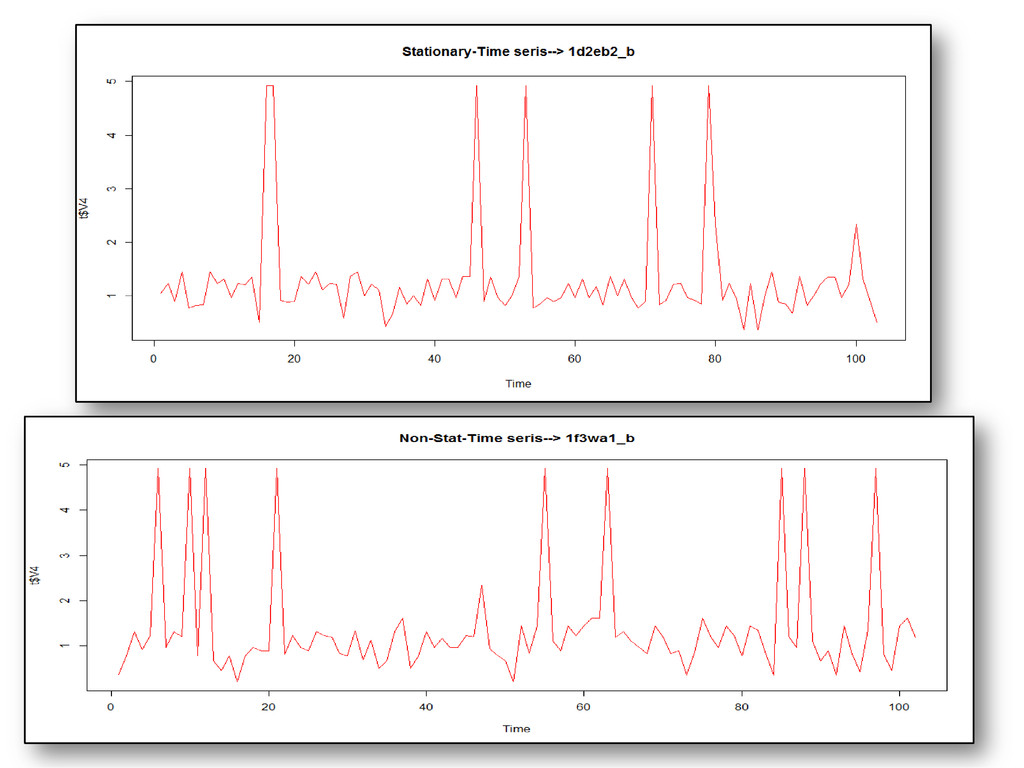
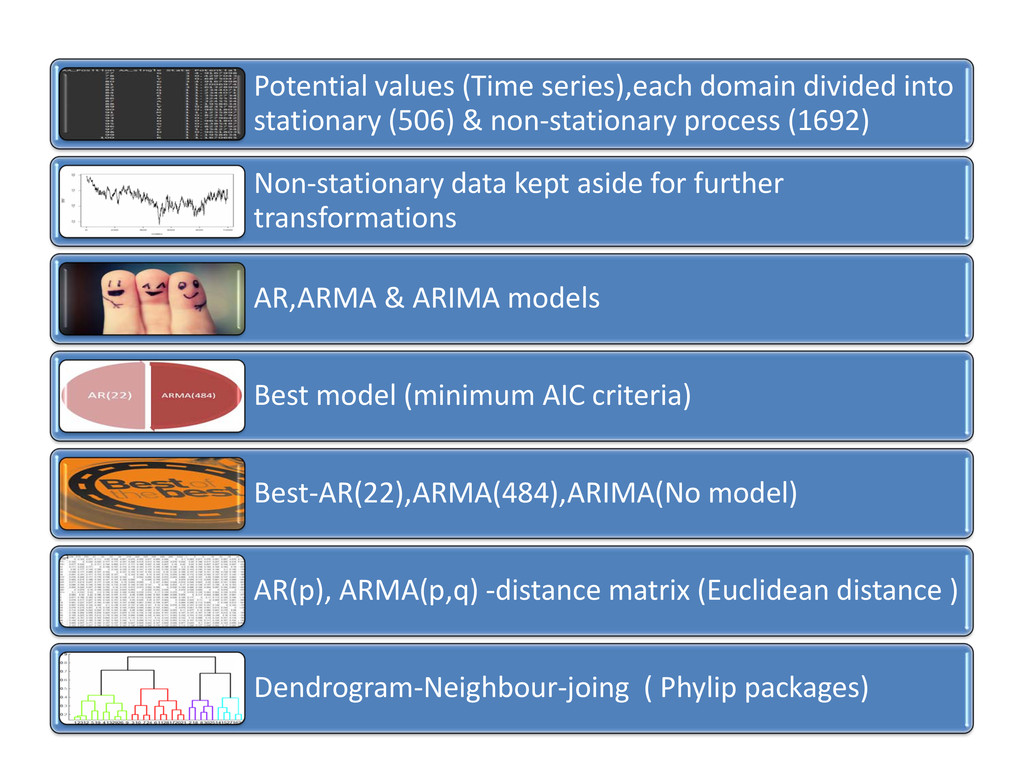
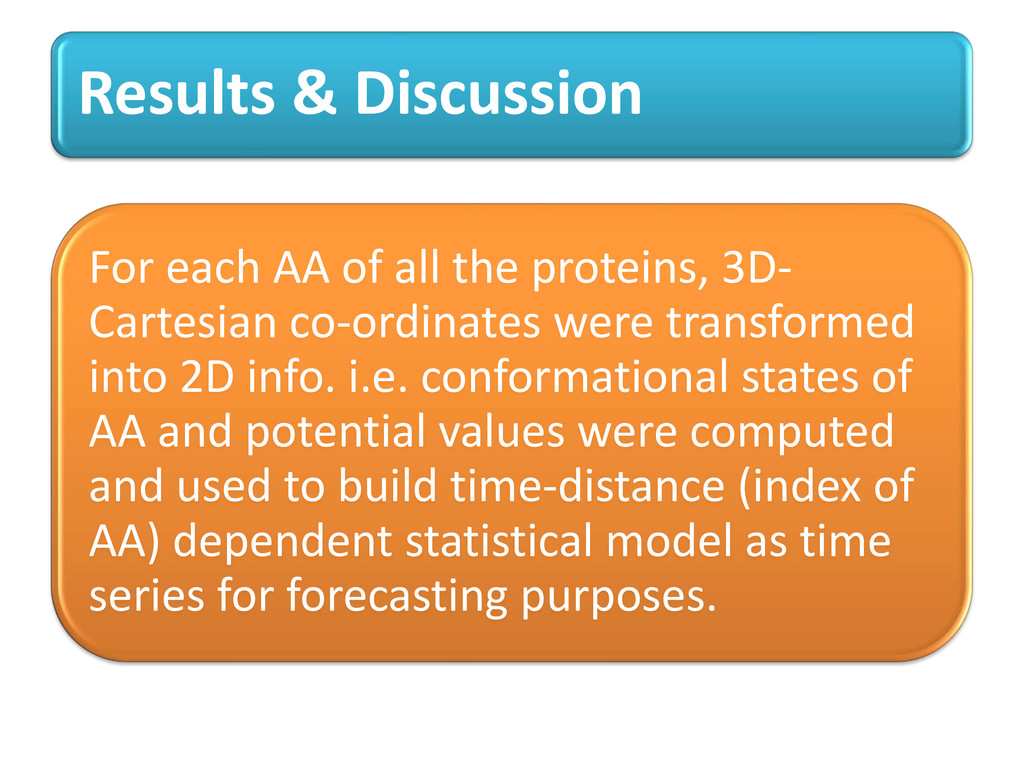
3D- Cartesian co-ordinates were transformed into 2D info. i.e. conformational states of AA and potential values were computed and used to build time-distance (index of AA) dependent statistical model as time series for forecasting purposes.
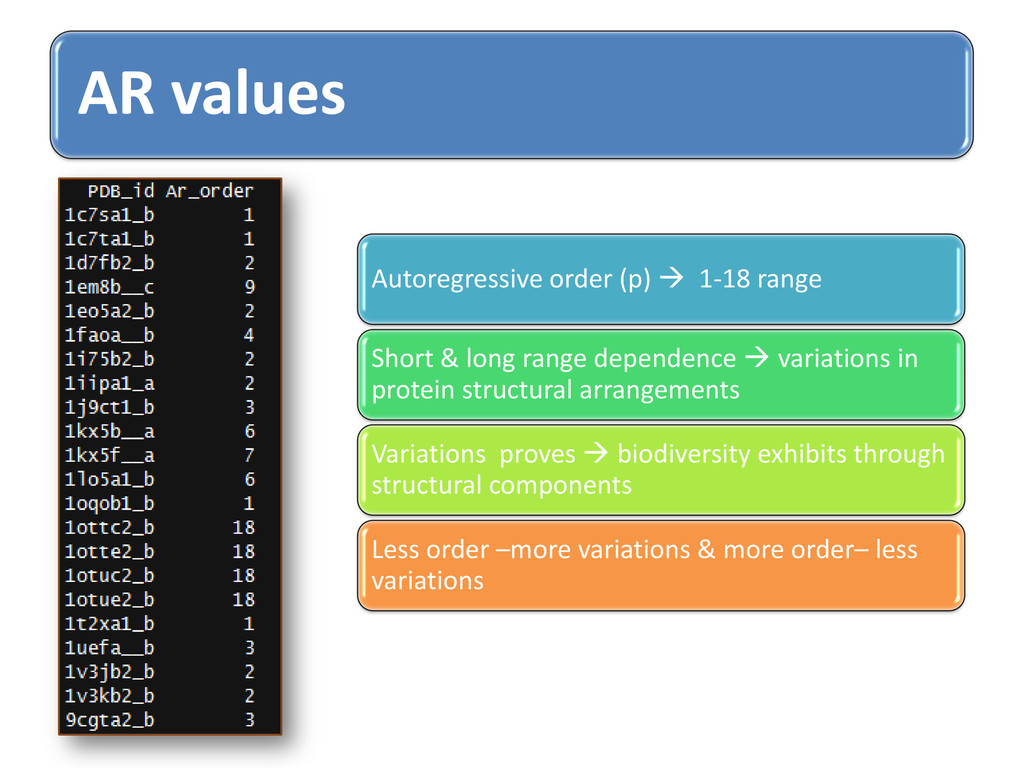
long range dependence variations in protein structural arrangements Variations proves biodiversity exhibits through structural components Less order –more variations & more order– less variations
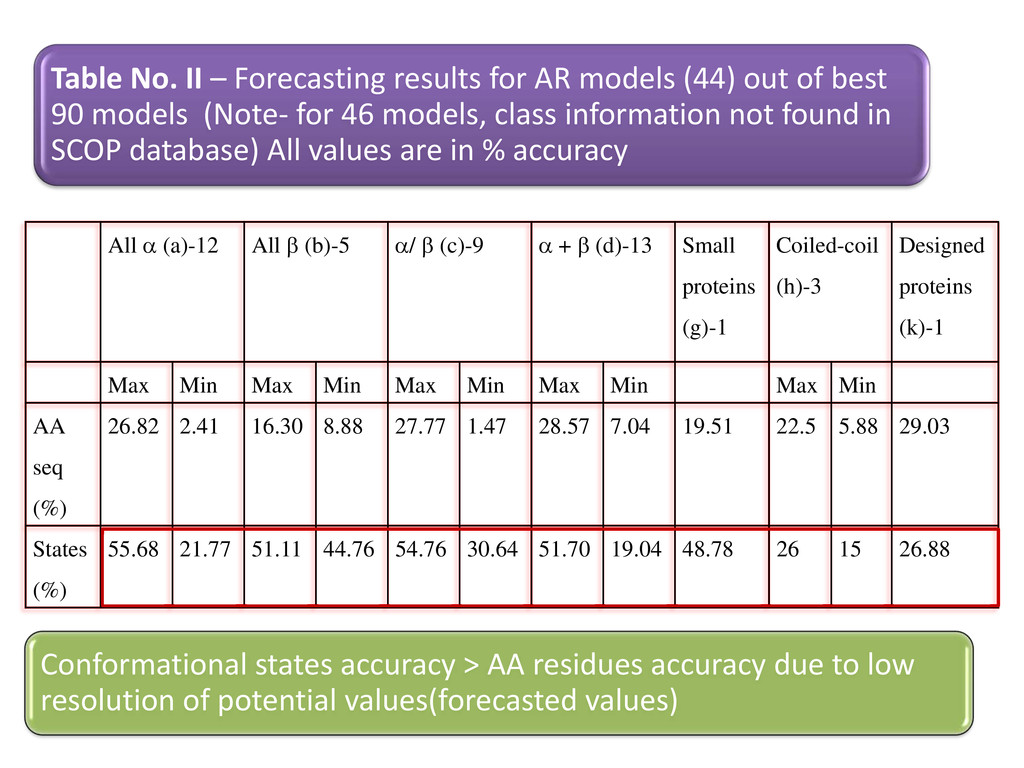
+ β (d)-13 Small proteins (g)-1 Coiled-coil (h)-3 Designed proteins (k)-1 Max Min Max Min Max Min Max Min Max Min AA seq (%) 26.82 2.41 16.30 8.88 27.77 1.47 28.57 7.04 19.51 22.5 5.88 29.03 States (%) 55.68 21.77 51.11 44.76 54.76 30.64 51.70 19.04 48.78 26 15 26.88 Table No. II – Forecasting results for AR models (44) out of best 90 models (Note- for 46 models, class information not found in SCOP database) All values are in % accuracy Conformational states accuracy > AA residues accuracy due to low resolution of potential values(forecasted values)
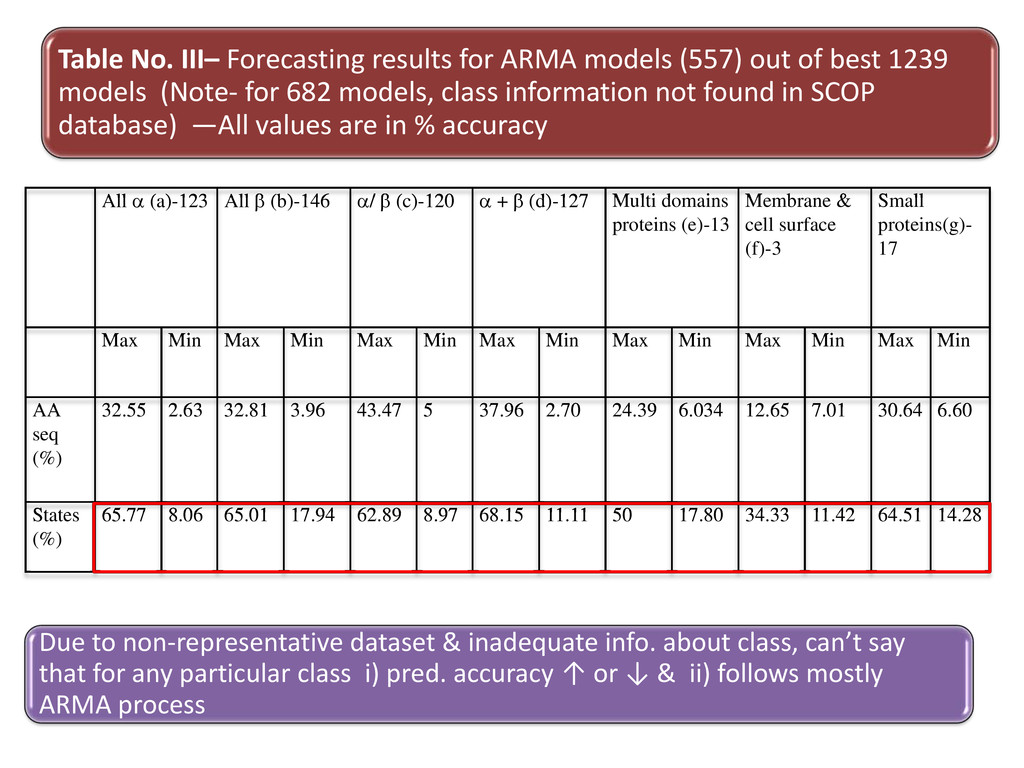
+ β (d)-127 Multi domains proteins (e)-13 Membrane & cell surface (f)-3 Small proteins(g)- 17 Max Min Max Min Max Min Max Min Max Min Max Min Max Min AA seq (%) 32.55 2.63 32.81 3.96 43.47 5 37.96 2.70 24.39 6.034 12.65 7.01 30.64 6.60 States (%) 65.77 8.06 65.01 17.94 62.89 8.97 68.15 11.11 50 17.80 34.33 11.42 64.51 14.28 Table No. III– Forecasting results for ARMA models (557) out of best 1239 models (Note- for 682 models, class information not found in SCOP database) —All values are in % accuracy Due to non-representative dataset & inadequate info. about class, can’t say that for any particular class i) pred. accuracy ↑ or ↓ & ii) follows mostly ARMA process
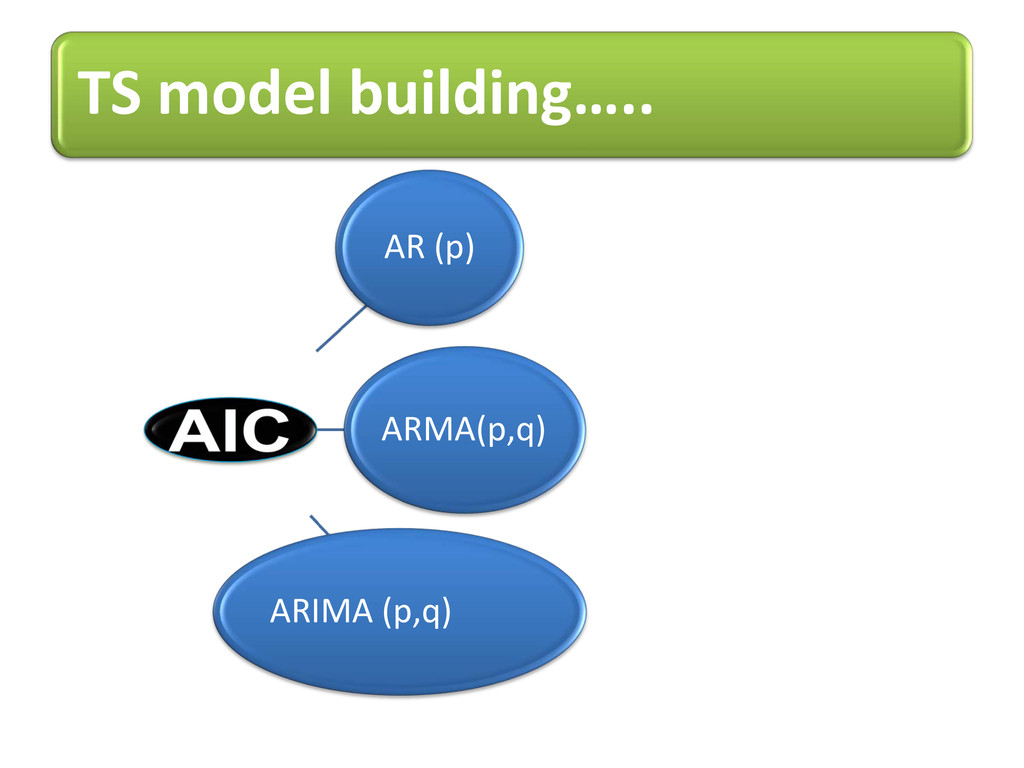
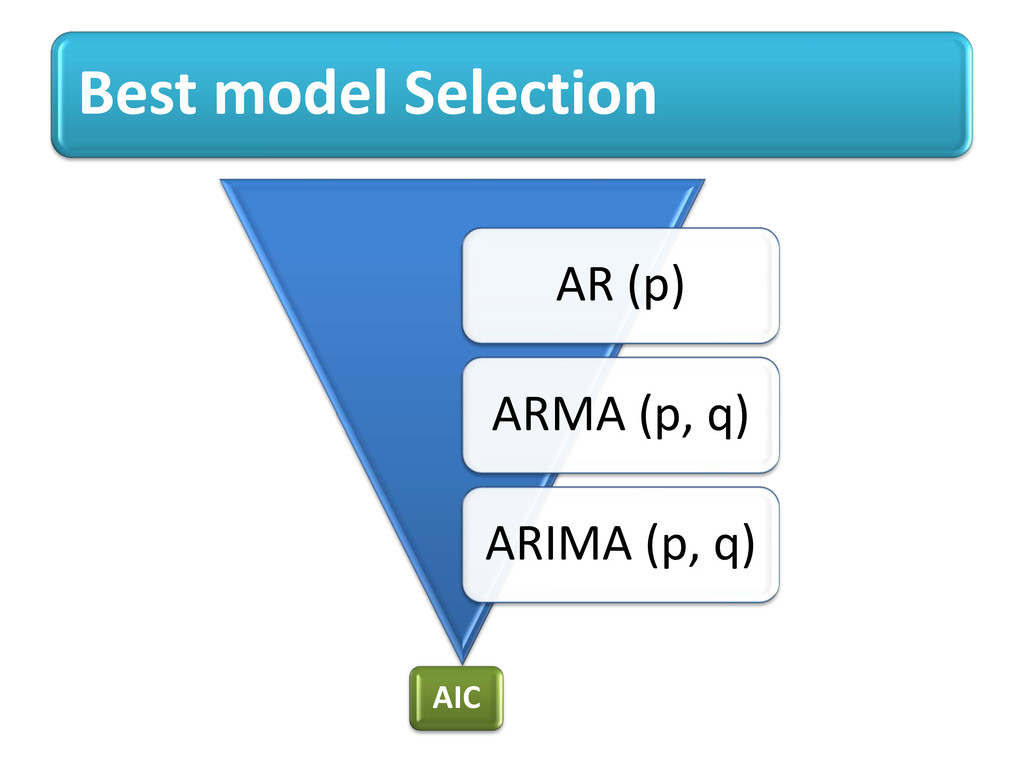
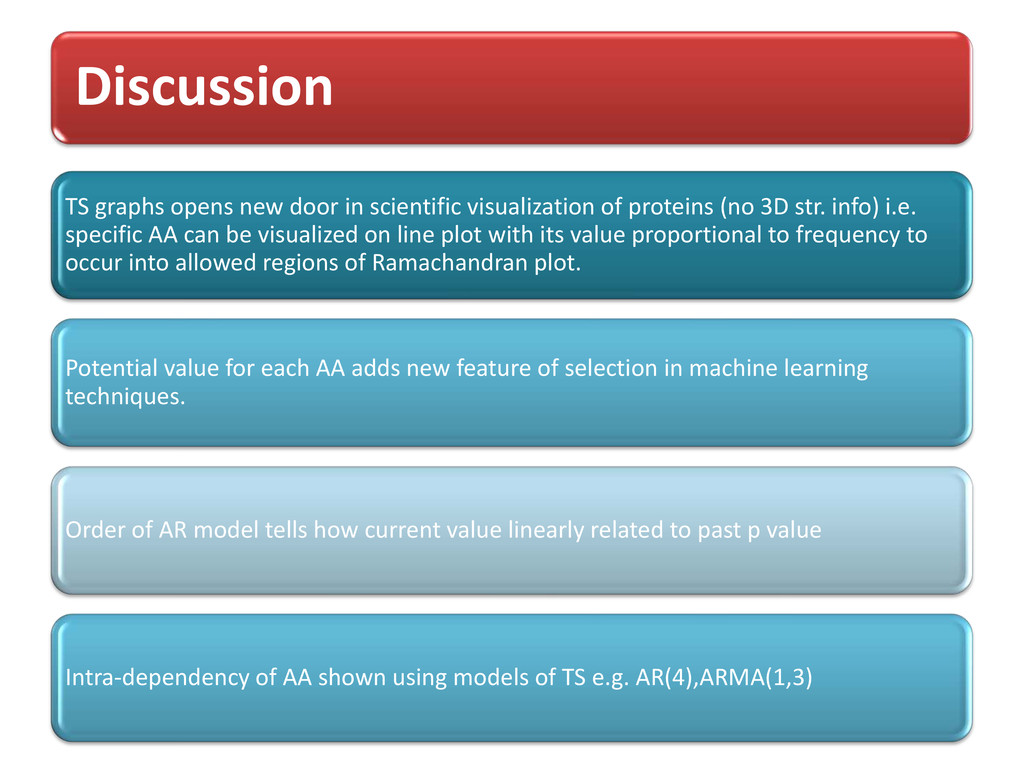
proteins (no 3D str. info) i.e. specific AA can be visualized on line plot with its value proportional to frequency to occur into allowed regions of Ramachandran plot. Potential value for each AA adds new feature of selection in machine learning techniques. Order of AR model tells how current value linearly related to past p value Intra-dependency of AA shown using models of TS e.g. AR(4),ARMA(1,3)
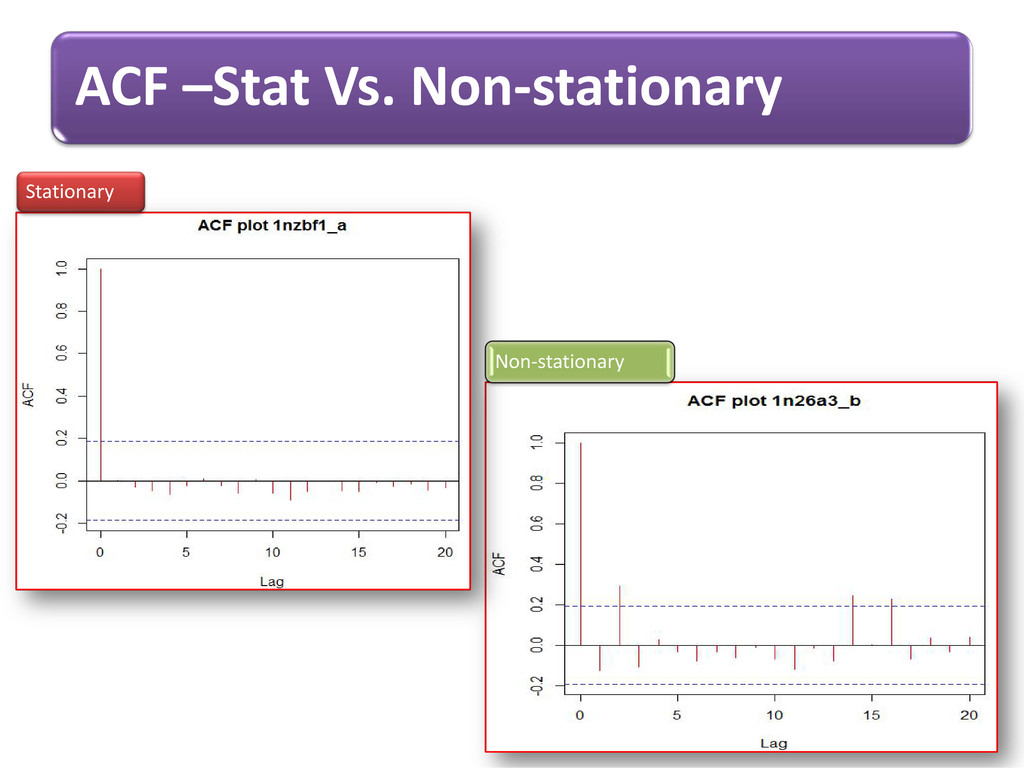
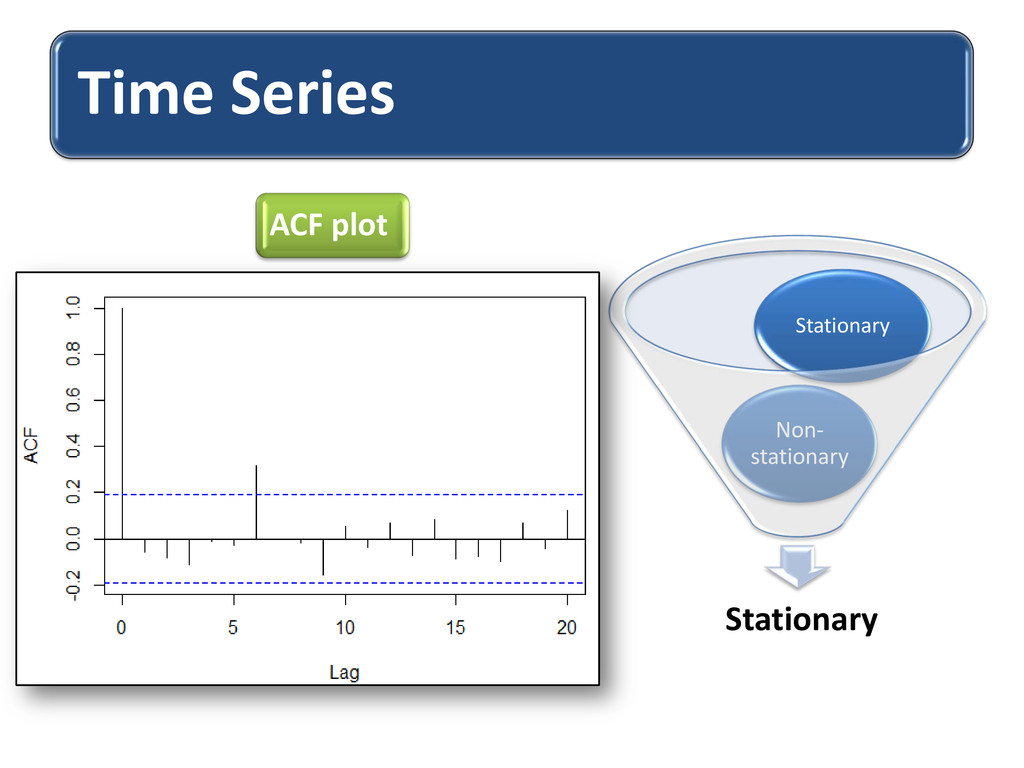
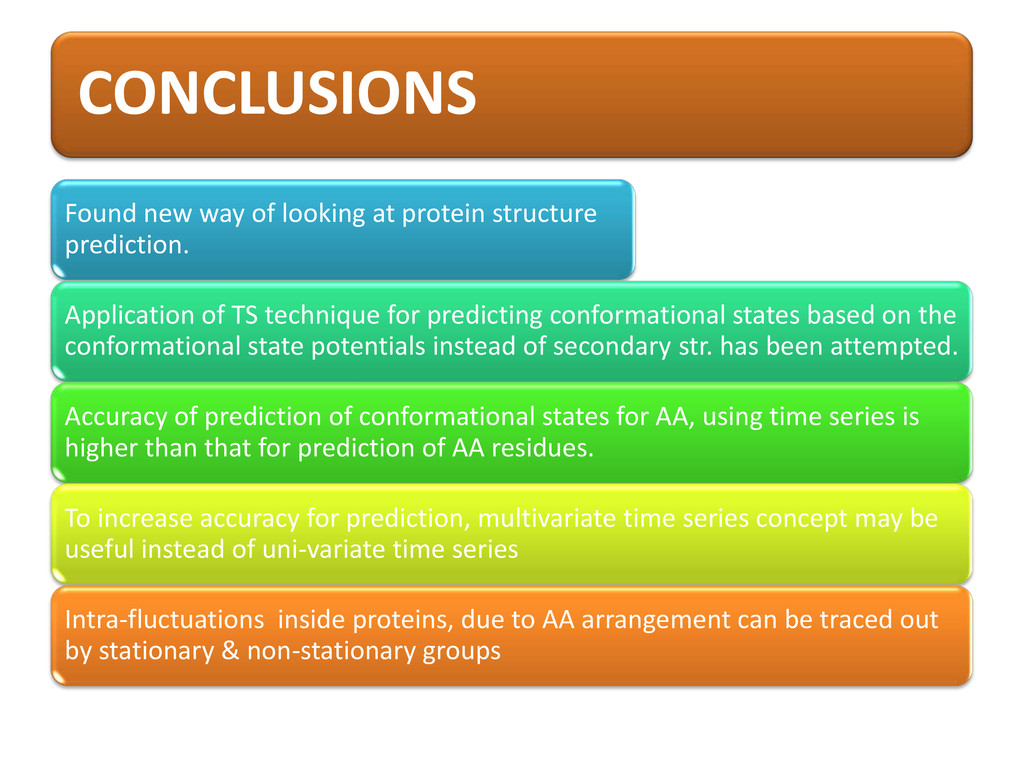
of TS technique for predicting conformational states based on the conformational state potentials instead of secondary str. has been attempted. Accuracy of prediction of conformational states for AA, using time series is higher than that for prediction of AA residues. To increase accuracy for prediction, multivariate time series concept may be useful instead of uni-variate time series Intra-fluctuations inside proteins, due to AA arrangement can be traced out by stationary & non-stationary groups CONCLUSIONS
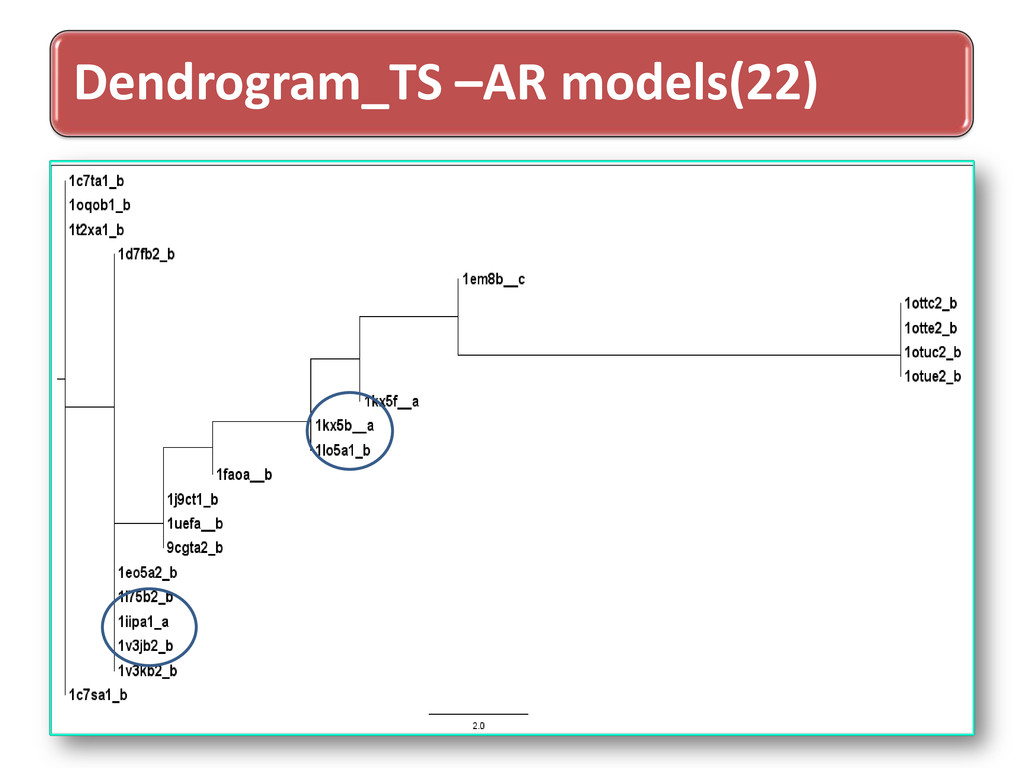
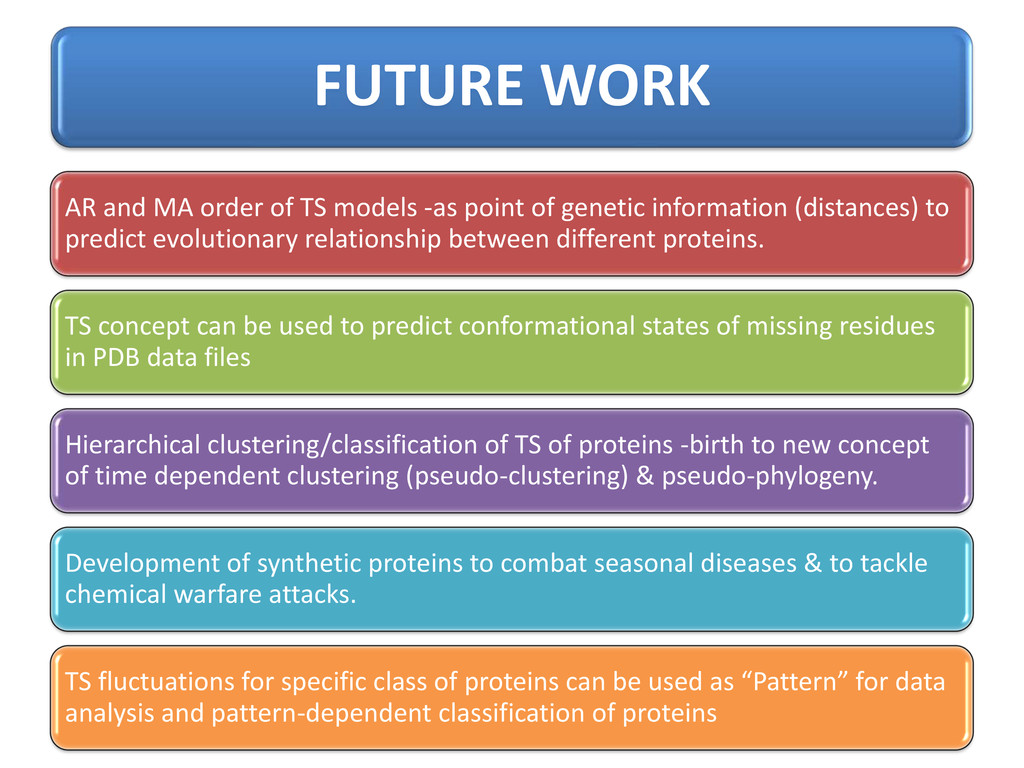
genetic information (distances) to predict evolutionary relationship between different proteins. TS concept can be used to predict conformational states of missing residues in PDB data files Hierarchical clustering/classification of TS of proteins -birth to new concept of time dependent clustering (pseudo-clustering) & pseudo-phylogeny. Development of synthetic proteins to combat seasonal diseases & to tackle chemical warfare attacks. TS fluctuations for specific class of proteins can be used as “Pattern” for data analysis and pattern-dependent classification of proteins FUTURE WORK
based prediction of protein structures and the design of novel molecules. Nature. 1987 Mar 26-Apr 1;326(6111):347-52. Review Kolaskar, A.S., Sawant, S.V. (1996). Prediction of conformational states of amino acids using a Ramachandran plot. Int.J.Peptide Protein Res.110-116 Alessandro G.,Romualdo B.,(2000). Nonlinear Methods in the Analysis of Protein Sequences:A Case Study in Rubredoxins. Biophysical Journal.136-148