Upgrade to Pro
— share decks privately, control downloads, hide ads and more …
Speaker Deck
Features
Speaker Deck
PRO
Sign in
Sign up for free
Search
Search
DTrace: printf debugging for seventh-level wizards
Search
Sponsored
·
SiteGround - Reliable hosting with speed, security, and support you can count on.
→
Shawn Moore
January 14, 2012
Programming
1.3k
2
Share
Embed
Copy iframe code
Copy JS code
Copy link
Start on current slide
DTrace: printf debugging for seventh-level wizards
Shawn Moore
January 14, 2012
More Decks by Shawn Moore
See All by Shawn Moore
Right the First Time
sartak
0
550
Lifting Moose
sartak
0
700
Kindergarten Code
sartak
0
160
How to be Fluent in Japanese
sartak
0
220
DTrace War Stories
sartak
1
200
Moose Role Usage Patterns
sartak
5
6k
git-status-tackle
sartak
5
410
Extending Moose for Applications
sartak
1
410
API Design
sartak
4
1k
Other Decks in Programming
See All in Programming
AI がコードを書く時代における新卒エンジニアの仕事風景 (2026) / New Graduate Engineers in the Era of AI Coding (2026)
sushichan044
0
220
Generative UI & AI-Assistants for Your Angular Solutions
manfredsteyer
PRO
1
190
AI時代の仕事技芸論〜ソフトウェア開発で「遊ぶように働く」職人的熟達のすすめ(スクフェス仙台 2026バージョン)
kuranuki
0
660
【やさしく解説 設計編・中級 #6】良いアーキテクチャとは ~ 一本の登り道の、行き先 ~
panda728
PRO
0
170
【やさしく解説 設計編 #0】DDDのコード、読めるのに分からない人へ
panda728
PRO
2
270
Terraform標準の組織で AWS CDKをどう使うか
mu7889yoon
0
290
Performance Engineering for Everyone
elenatanasoiu
0
270
なぜ関数型プログラミングで「型」と「証明」が語られるのか #fp_matsuri
kajitack
3
960
act2-costs.pdf
sumedhbala
0
120
【やさしく解説 設計編 #1】「ドメイン駆動」と「実装駆動」ってなに? 〜設計の考え方を、たとえ話で学ぼう〜
panda728
PRO
1
120
継続モナドとリアクティブプログラミング
yukikurage
3
610
The Bowling Game - From Imperative to Functional Programming - Part 1
philipschwarz
PRO
0
330
Featured
See All Featured
Balancing Empowerment & Direction
lara
6
1.2k
Building a A Zero-Code AI SEO Workflow
portentint
PRO
0
630
Statistics for Hackers
jakevdp
799
230k
How Fast Is Fast Enough? [PerfNow 2025]
tammyeverts
3
660
The AI Search Optimization Roadmap by Aleyda Solis
aleyda
1
6k
Noah Learner - AI + Me: how we built a GSC Bulk Export data pipeline
techseoconnect
PRO
0
220
Amusing Abliteration
ianozsvald
1
230
What does AI have to do with Human Rights?
axbom
PRO
1
2.3k
Making the Leap to Tech Lead
cromwellryan
135
10k
Context Engineering - Making Every Token Count
addyosmani
9
1k
We Are The Robots
honzajavorek
0
280
How to optimise 3,500 product descriptions for ecommerce in one day using ChatGPT
katarinadahlin
PRO
1
3.7k
Transcript
@sartak DTRACE printf debugging for seventh-level wizards 121݄14༵
ME ME ME ME ME ME ME Shawn M Moore
@sartak I’m Bawstin’ Moose-lover Infinity Interactive 121݄14༵
What’s my computer doing right now? Q: A: Find out
with DTrace 121݄14༵
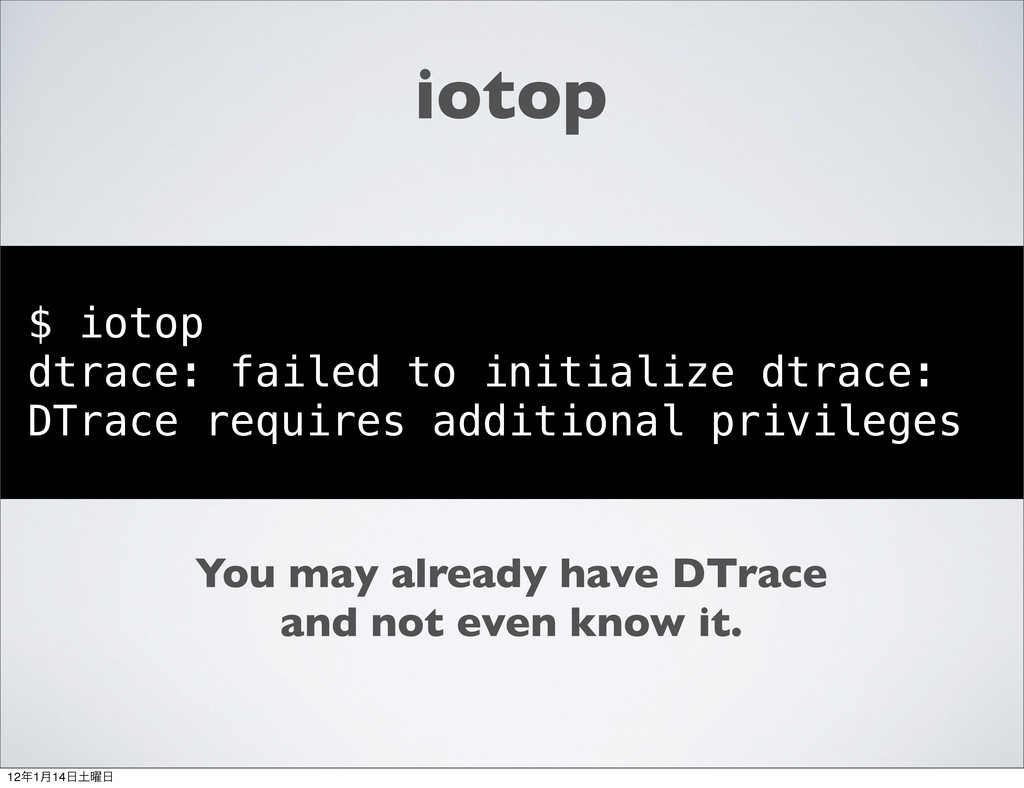
iotop $ iotop dtrace: failed to initialize dtrace: DTrace requires
additional privileges You may already have DTrace and not even know it. 121݄14༵
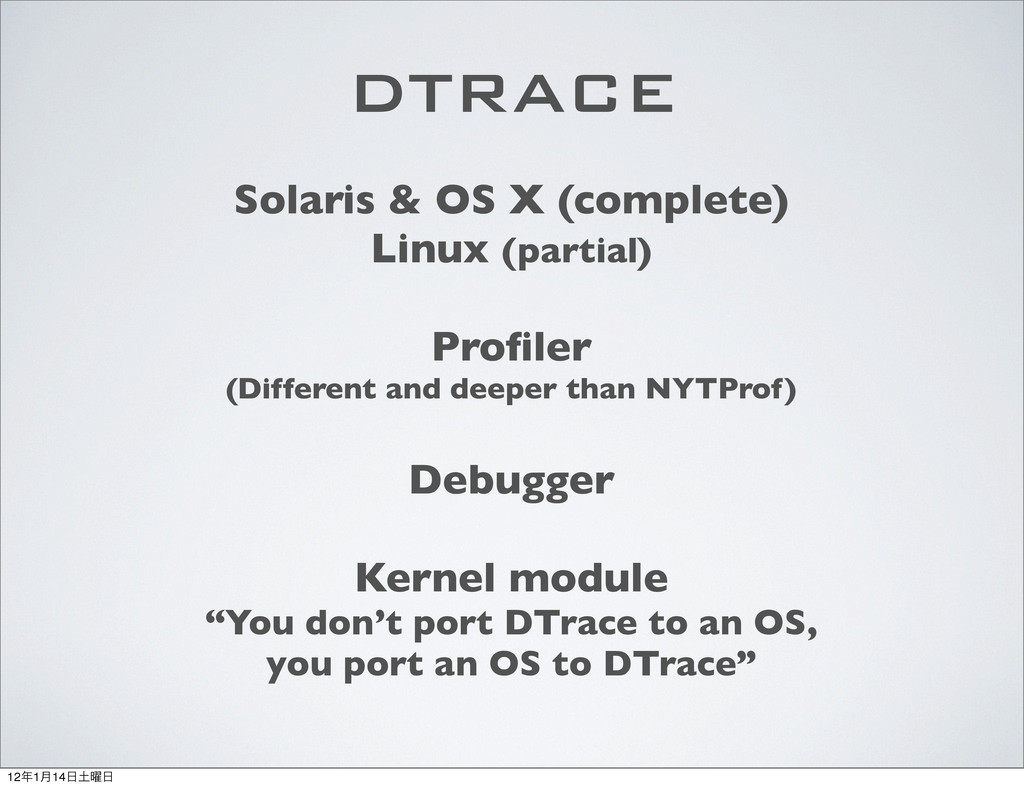
Solaris & OS X (complete) Linux (partial) Profiler (Different and
deeper than NYTProf) Debugger Kernel module “You don’t port DTrace to an OS, you port an OS to DTrace” DTRACE 121݄14༵
SAFE! ɾNo unwanted side effects ɾVery low overhead ɾDo it
in production! 121݄14༵
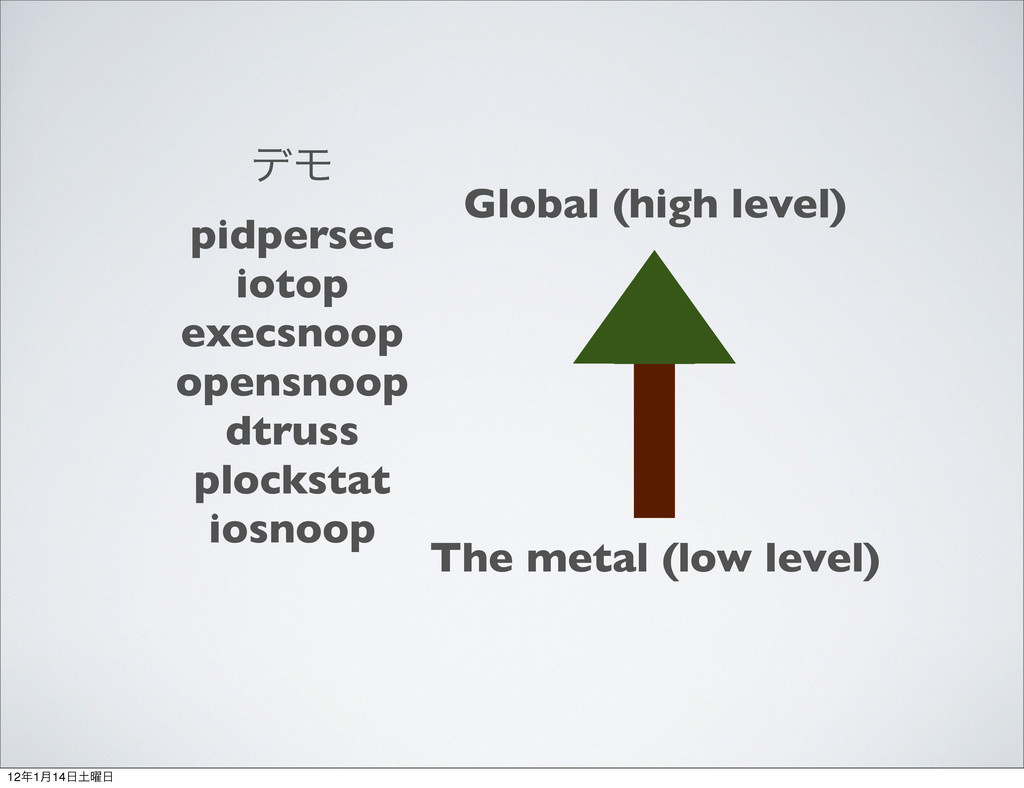
σϞ pidpersec iotop execsnoop opensnoop dtruss plockstat iosnoop Global (high
level) The metal (low level) 121݄14༵
σϞ pidpersec iotop execsnoop opensnoop dtruss plockstat iosnoop Global (high
level) The metal (low level) 121݄14༵
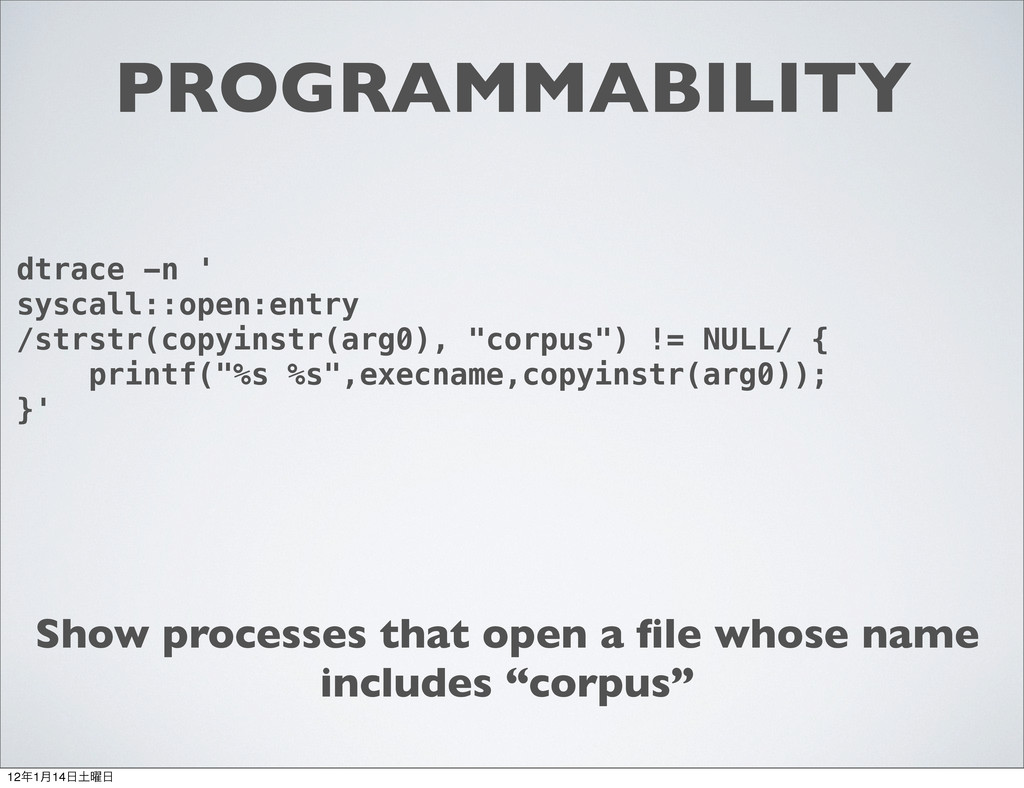
PROGRAMMABILITY dtrace -n ' syscall::open:entry /strstr(copyinstr(arg0), "corpus") != NULL/ {
printf("%s %s",execname,copyinstr(arg0)); }' Show processes that open a file whose name includes “corpus” 121݄14༵
PROGRAMMABILITY dtrace -n ' syscall::open:entry /strstr(copyinstr(arg0), "corpus") != NULL/ {
printf("%s %s",execname,copyinstr(arg0)); }' Show processes that open a file whose name includes “corpus” Event(Probe Description) 121݄14༵
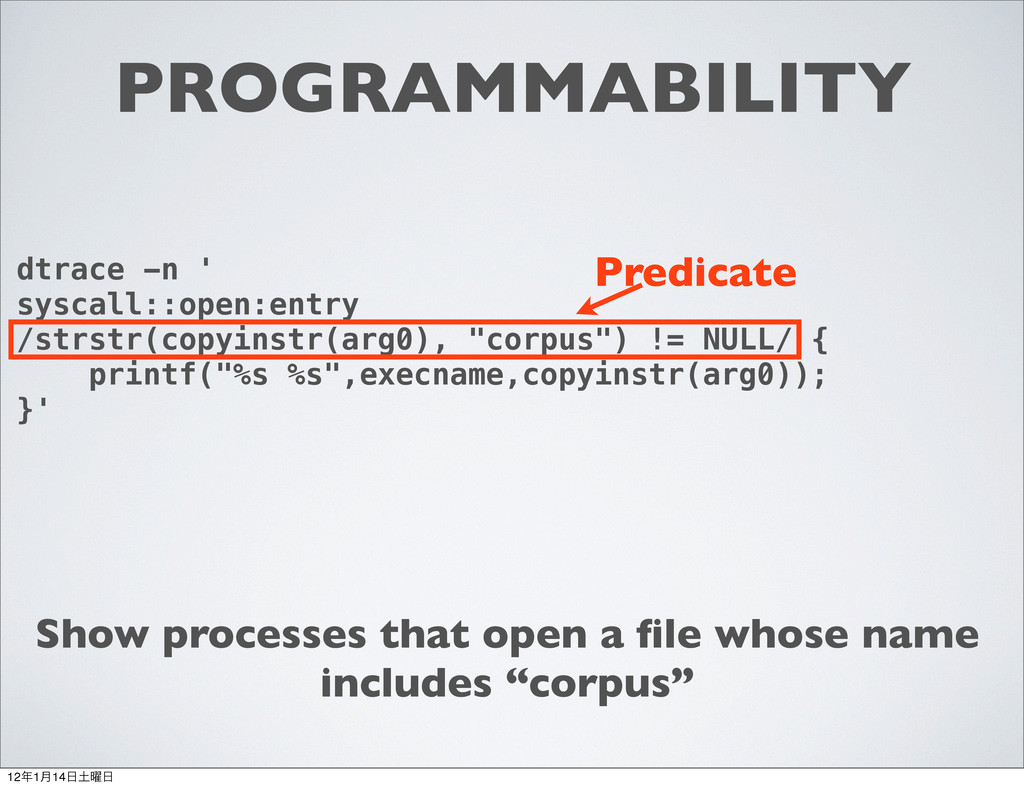
PROGRAMMABILITY dtrace -n ' syscall::open:entry /strstr(copyinstr(arg0), "corpus") != NULL/ {
printf("%s %s",execname,copyinstr(arg0)); }' Show processes that open a file whose name includes “corpus” Predicate 121݄14༵
PROGRAMMABILITY dtrace -n ' syscall::open:entry /strstr(copyinstr(arg0), "corpus") != NULL/ {
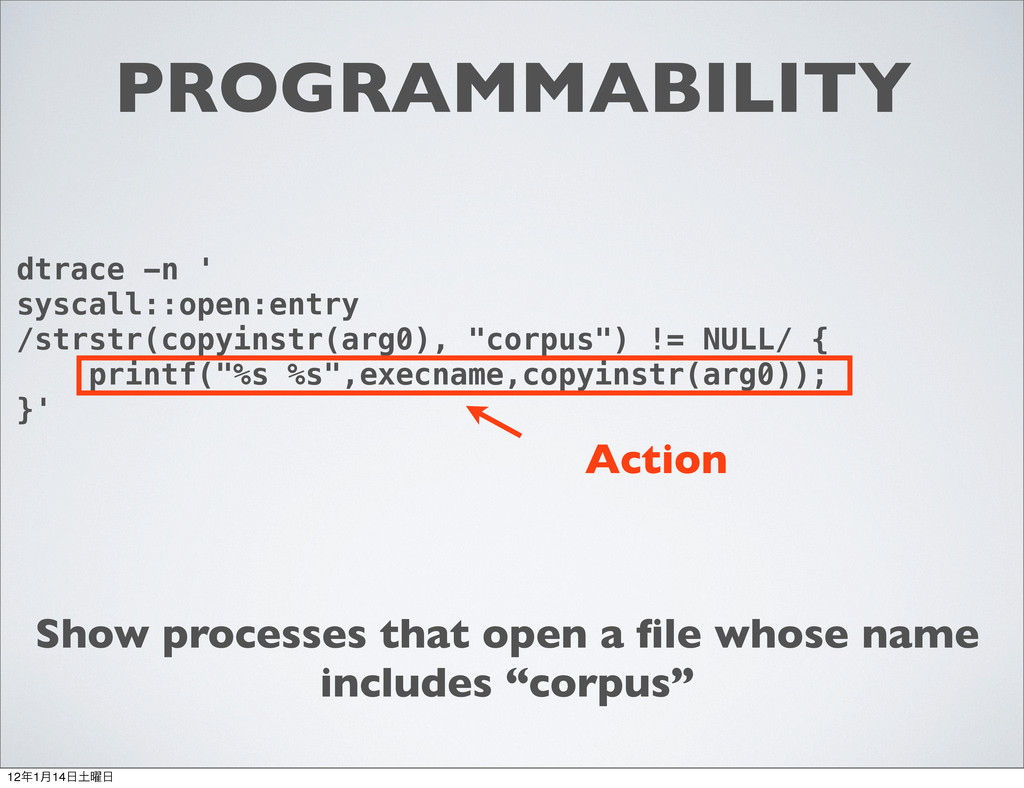
printf("%s %s",execname,copyinstr(arg0)); }' Show processes that open a file whose name includes “corpus” Action 121݄14༵
PROGRAMMABILITY dtrace -n ' syscall::open:entry /strstr(copyinstr(arg0), "corpus") != NULL/ {
printf("%s %s",execname,copyinstr(arg0)); }' Show processes that open a file whose name includes “corpus” 121݄14༵
DTrace instrumentation points ɾKernel function calls/returns (syscalls too) ɾPerl function
calls/returns ɾSQL execution ɾthreads ɾsignals ɾmany more PROBES 121݄14༵
THE COOL DEMO HEY, FORGETFUL! DEMO THE GPG THING 121݄14༵
PROFILER Devel::NYTProf kicks ass 121݄14༵
PROFILER But there’s more than one way to do it
121݄14༵
PROFILER DEMO: syscalls intuit_method 121݄14༵
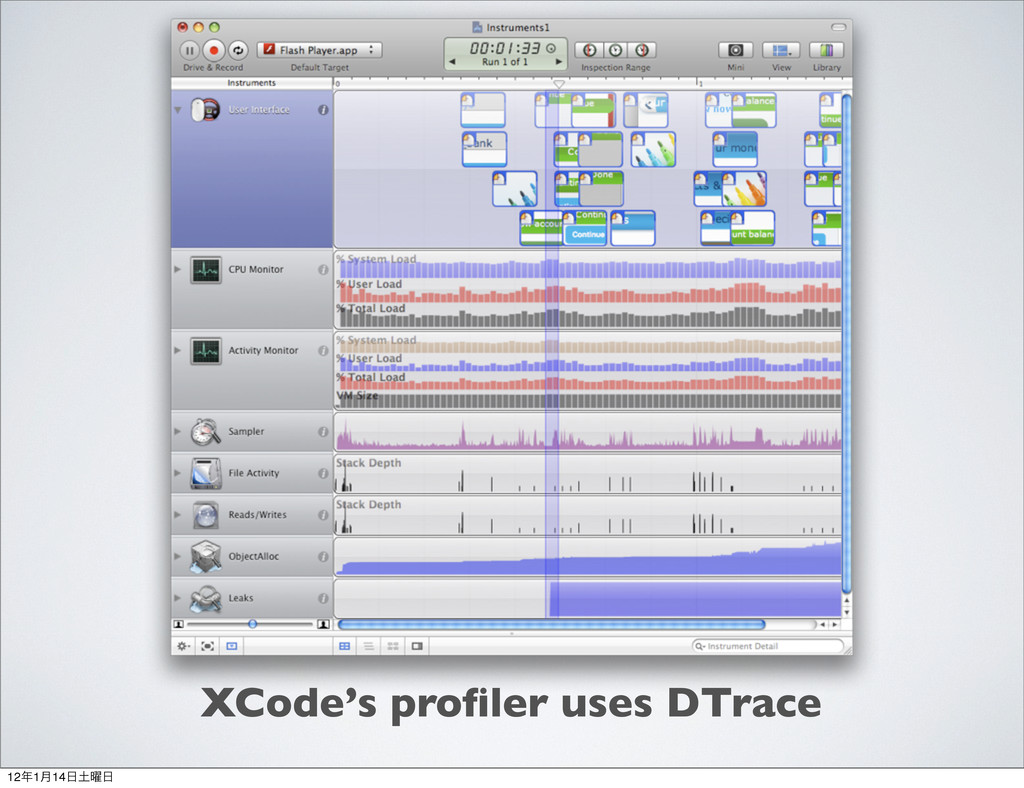
XCode’s profiler uses DTrace 121݄14༵
121݄14༵
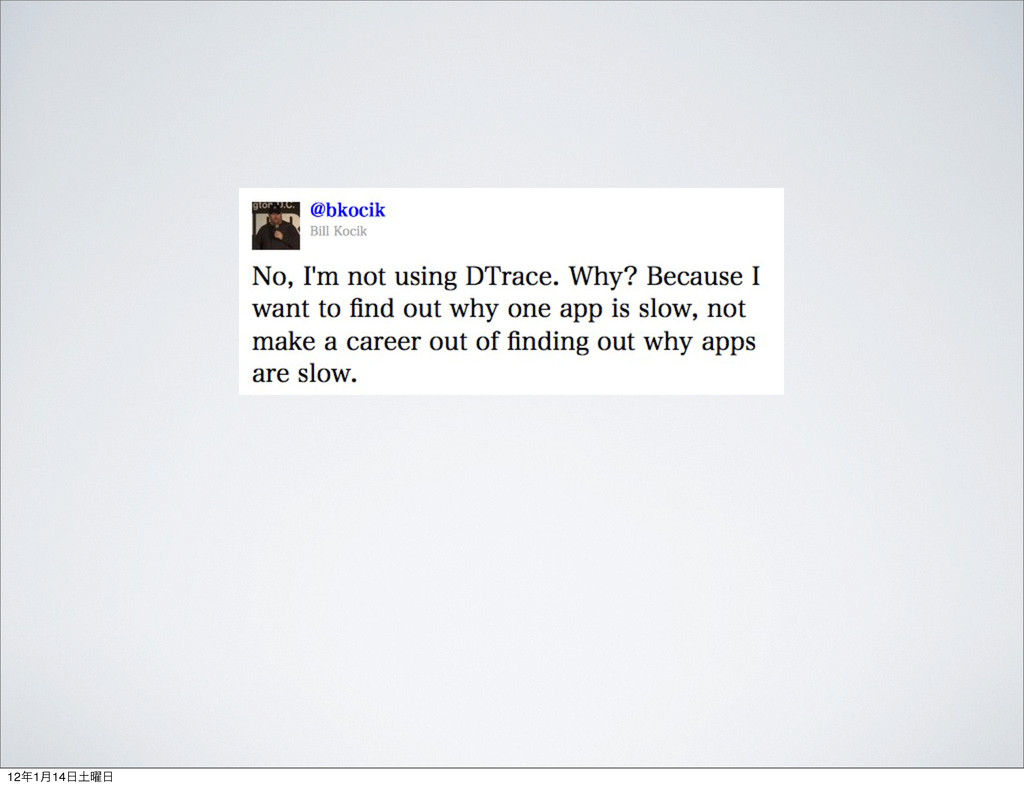
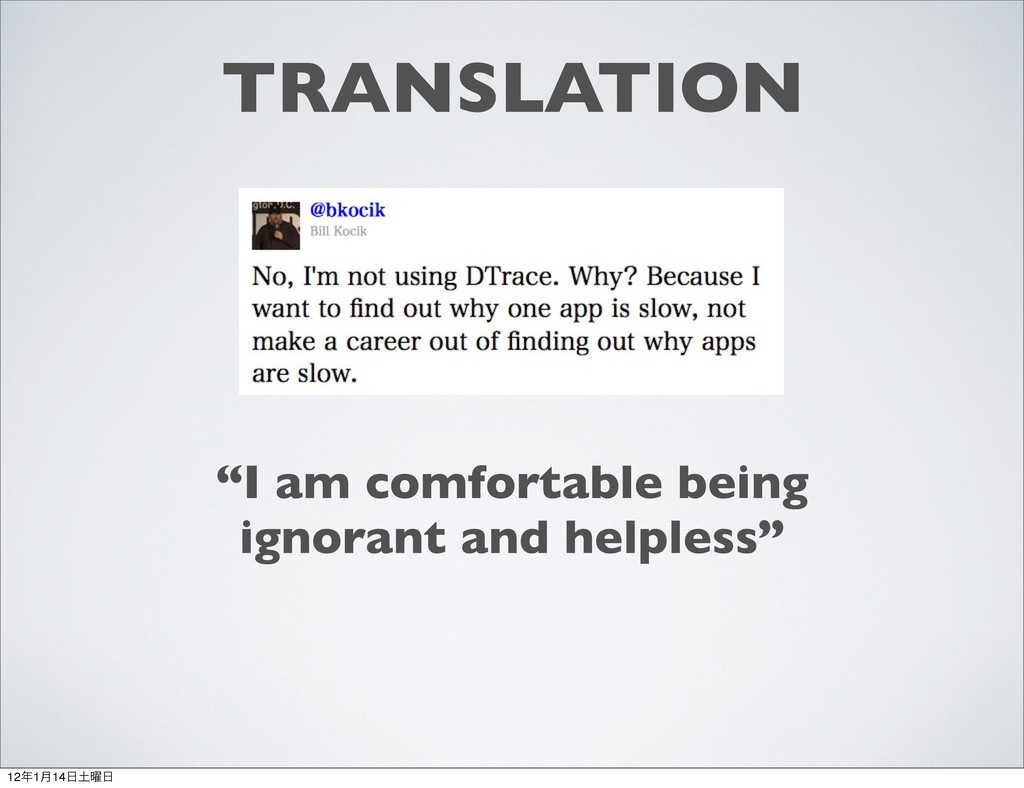
TRANSLATION “I am comfortable being ignorant and helpless” 121݄14༵
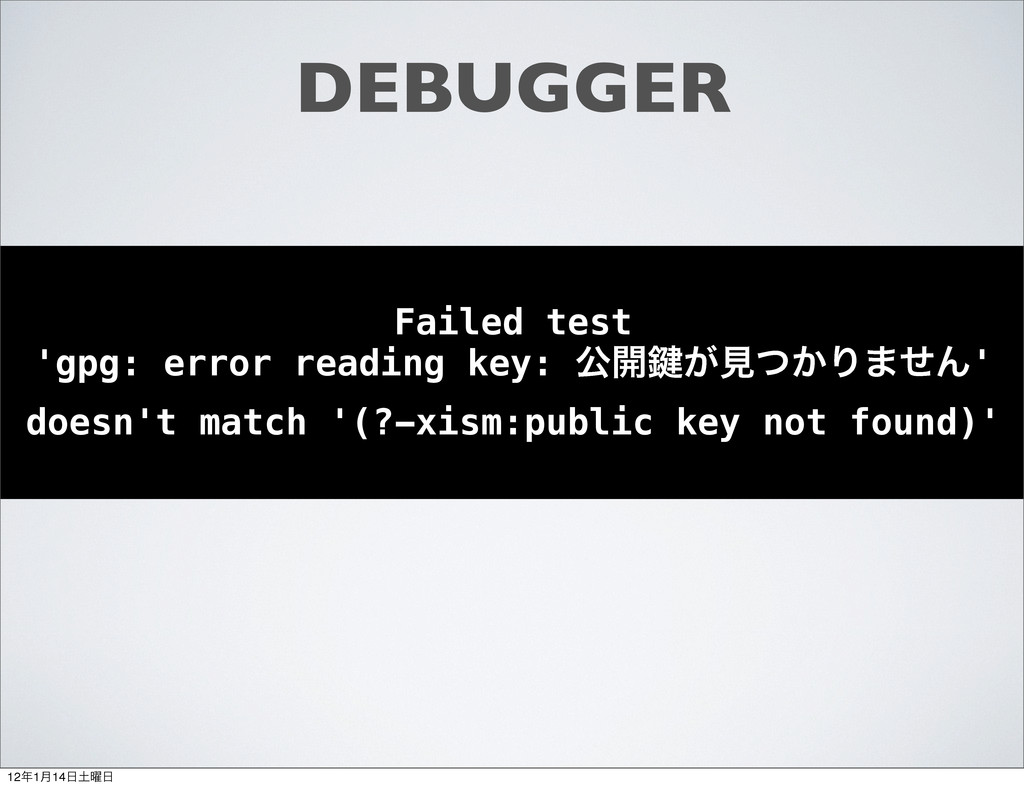
DEBUGGER Request Tracker (e.g. rt.cpan.org) was failing tests on mod_perl.
On only my computer. Probably because of all the Japanese. 121݄14༵
DEBUGGER Failed test 'gpg: error reading key: ެ։伴͕ݟ͔ͭΓ·ͤΜ' doesn't match
'(?-xism:public key not found)' 121݄14༵
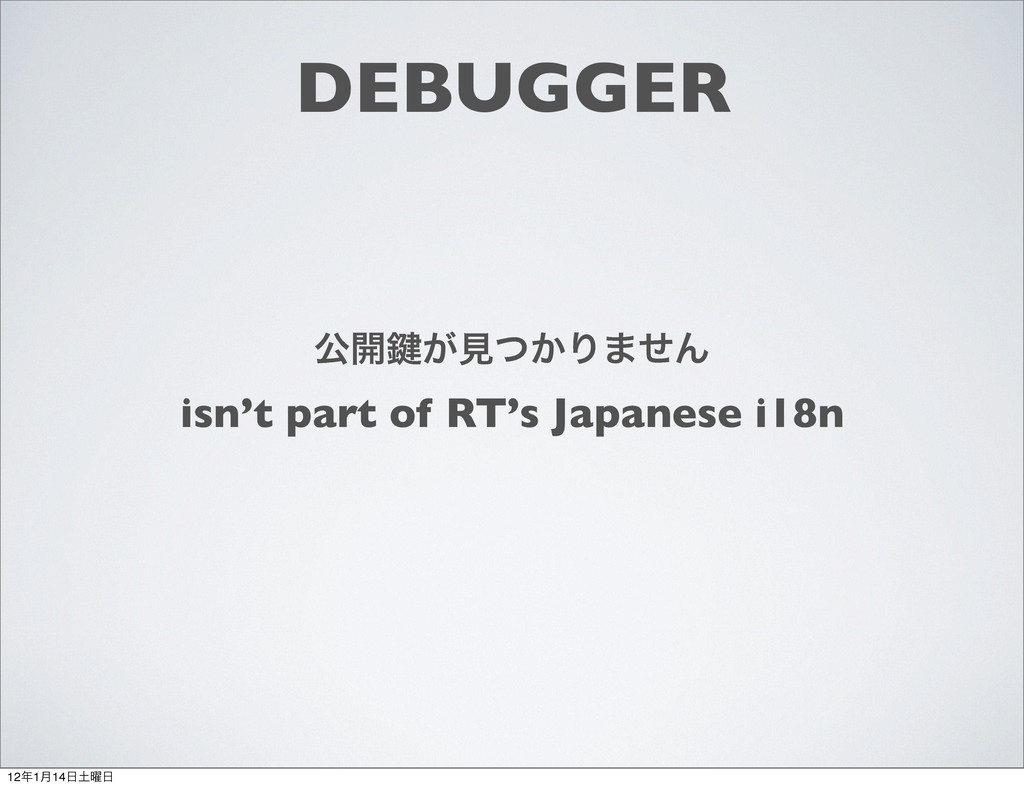
DEBUGGER ެ։伴͕ݟ͔ͭΓ·ͤΜ isn’t part of RT’s Japanese i18n 121݄14༵
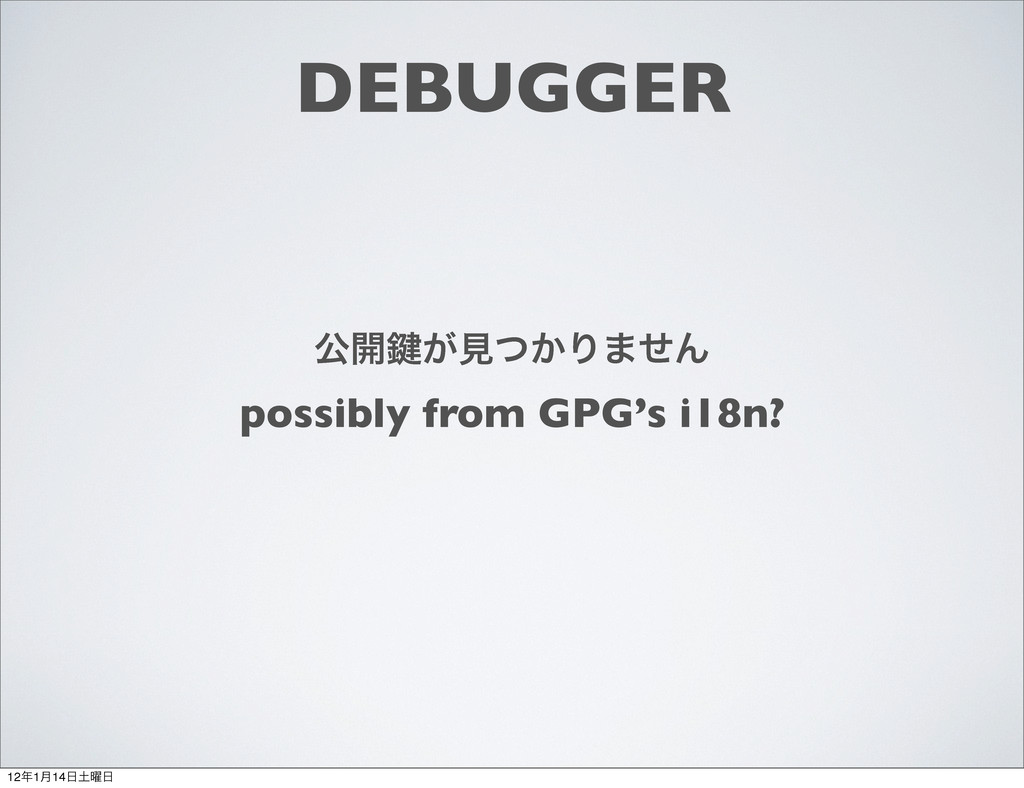
DEBUGGER ެ։伴͕ݟ͔ͭΓ·ͤΜ possibly from GPG’s i18n? 121݄14༵
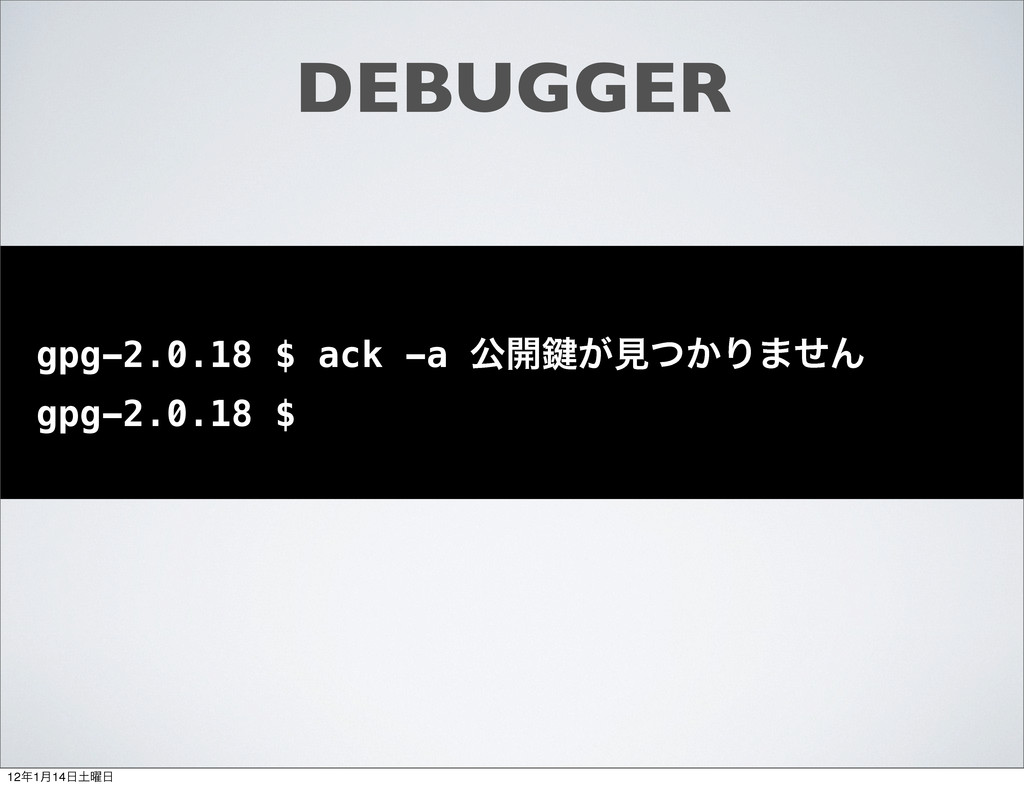
DEBUGGER gpg-2.0.18 $ ack -a ެ։伴͕ݟ͔ͭΓ·ͤΜ gpg-2.0.18 $ 121݄14༵
DEBUGGER gpg-2.0.18 $ echo "ެ։伴͕ݟ͔ͭΓ·ͤΜ" | iconv -f UTF-8 -t
EUCJP | xargs ack -ao | iconv -f EUCJP -t UTF-8 Binary file po/ja.gmo matches po/ja.po:2965:ެ։伴͕ݟ͔ͭΓ·ͤΜ po/ja.po:6525:ެ։伴͕ݟ͔ͭΓ·ͤΜ po/ja.po:8311:ެ։伴͕ݟ͔ͭΓ·ͤΜ gpg-2.0.18 $ 121݄14༵
DEBUGGER probably a mis-set $LANG, $LC_ALL? 121݄14༵
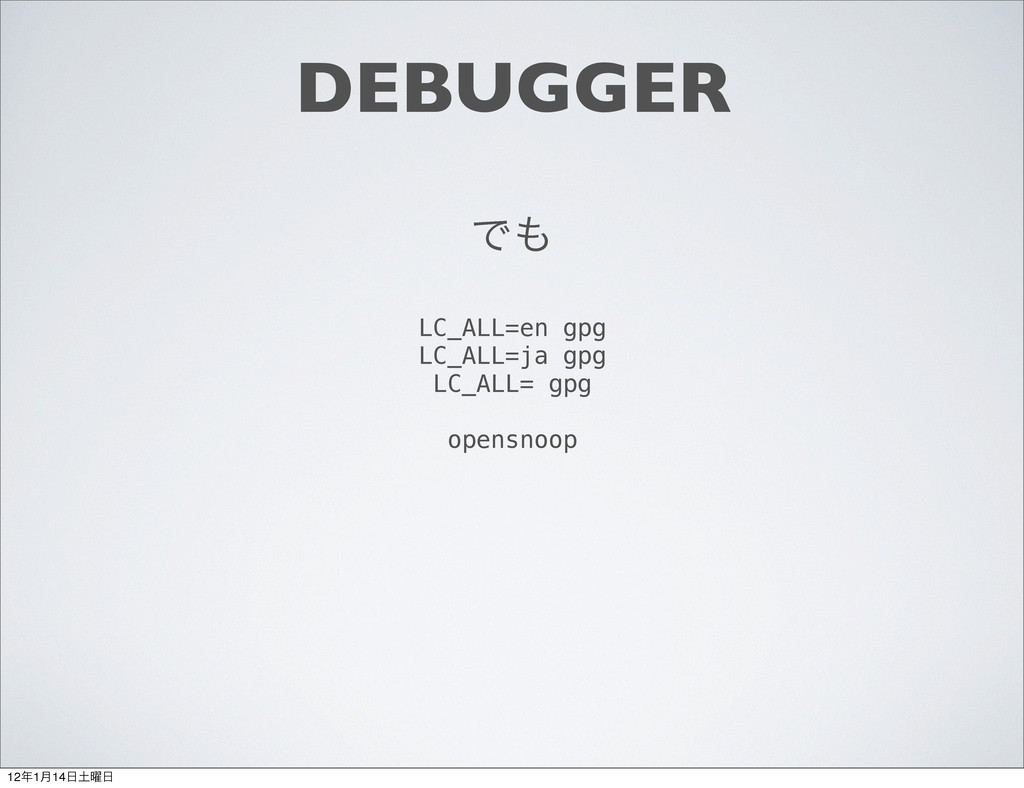
DEBUGGER Ͱ LC_ALL=en gpg LC_ALL=ja gpg LC_ALL= gpg opensnoop 121݄14༵
DEBUGGER Without DTrace, woulda had to add print statements to
GPG itself 121݄14༵
DEBUGGER then compiled it 121݄14༵
DEBUGGER then installed it 121݄14༵
DEBUGGER then repeated a couple of times because I’m a
“throw everything til something sticks” kinda guy 121݄14༵
DEBUGGER then cleaned up after all that hot mess 121݄14༵
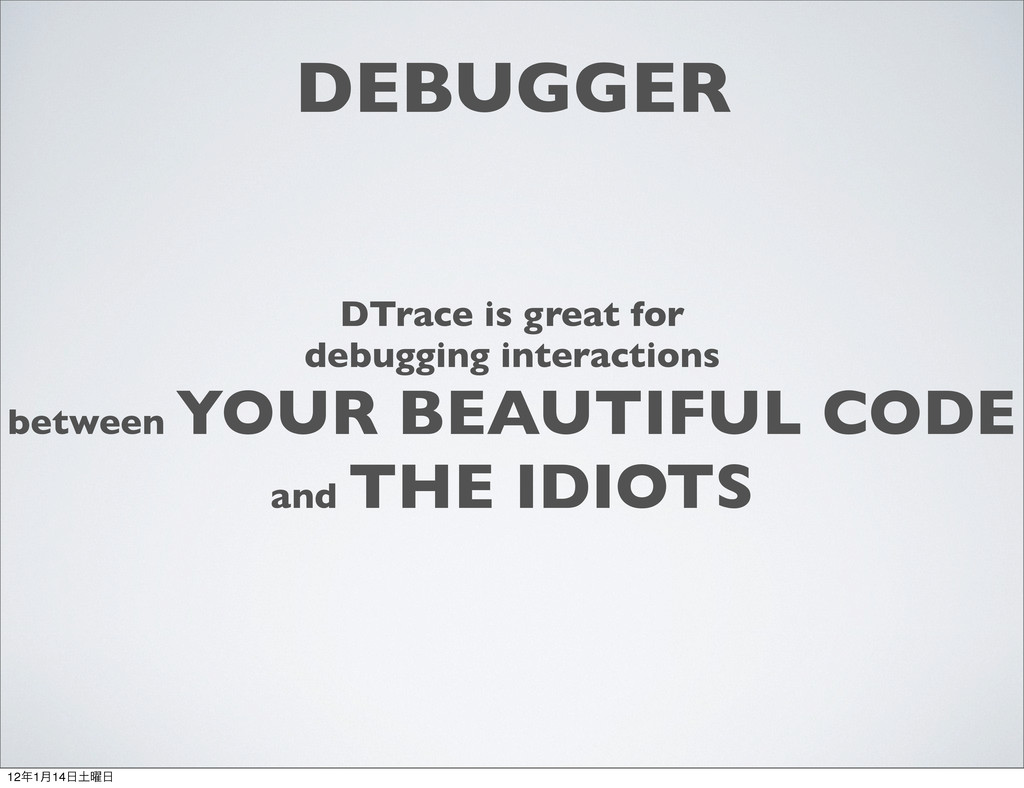
DEBUGGER DTrace is great for debugging interactions between programs 121݄14༵
DEBUGGER DTrace is great for debugging interactions between YOUR BEAUTIFUL
CODE and THE IDIOTS 121݄14༵
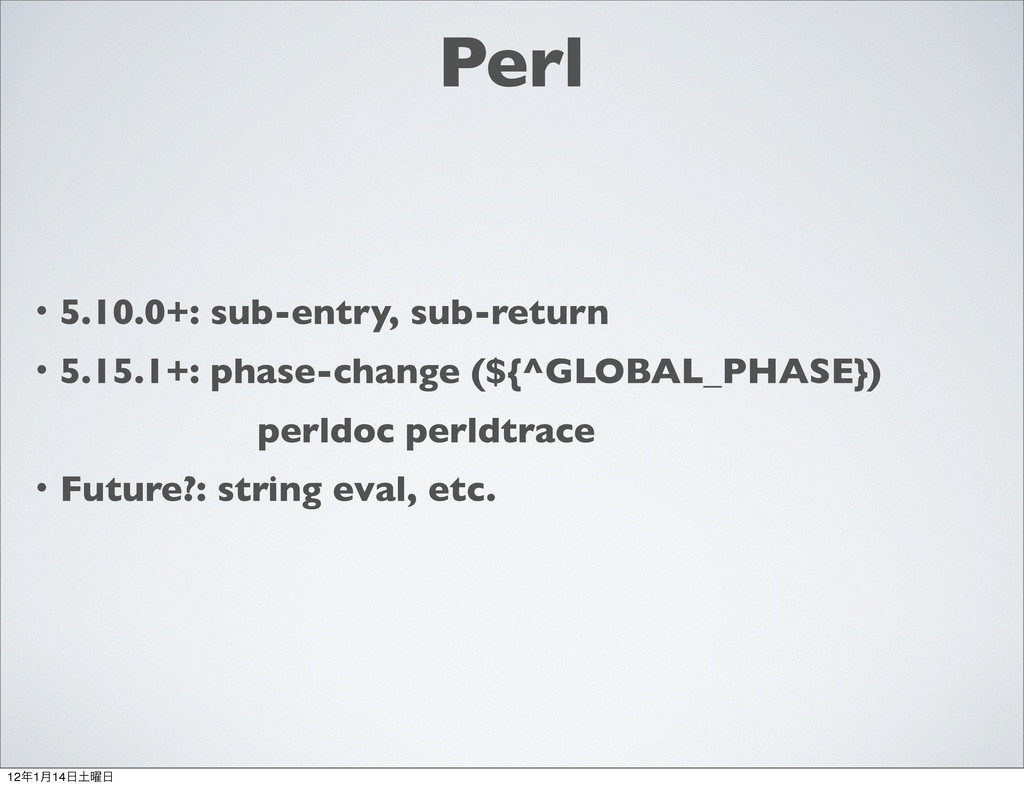
Perl ɾ5.10.0+: sub-entry, sub-return ɾ5.15.1+: phase-change (${^GLOBAL_PHASE}) ɹ ɾFuture?: string
eval, etc. perldoc perldtrace 121݄14༵
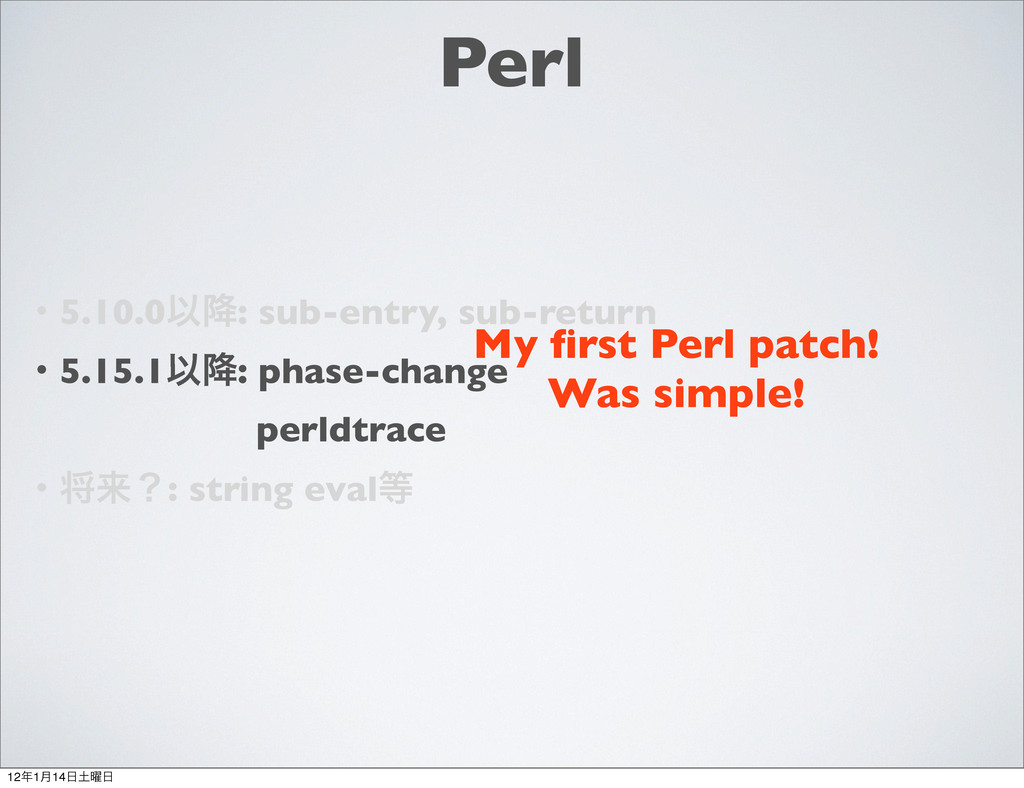
Perl ɾ5.10.0Ҏ߱: sub-entry, sub-return ɾ5.15.1Ҏ߱: phase-change ɹ ɾকདྷʁ: string eval
My first Perl patch! Was simple! perldtrace 121݄14༵
QUESTIONS? ຊޠͰ̤̠Ͱ͢ʂ slides: http://twitter.com/sartak 121݄14༵