Upgrade to Pro — share decks privately, control downloads, hide ads and more …

DTrace War Stories

DTrace War Stories

Several stories of how DTrace saved someone's day when *nothing else* could.

You too can wield this power and be the envy of your community.

Shawn Moore

June 23, 2014
Tweet

More Decks by Shawn Moore

Other Decks in Programming

Transcript

  1. “Give me a console and source code from which to

    printf, and I shall debug the world.” Sometimes I feel like any problem could be solved with thoughtfully-placed printf debugging. I’ve never been a fan of debuggers like perldb and gdb. Feels like they get in the way more than they “amplify my capabilities” as any tool should.
  2. 1. stop the program 2. think very hard 3. improve

    instrumentation 4. restart the program 5. replicate the problem 6. observe output 7. GOTO 1 Here’s my seven step process to debugging any problem with printf. It’s served me remarkably well over the years. Probably 99% of bugs I’ve fixed have been thanks to this method. But there is still that remaining 1%.
  3. 1. stop the program ! ! 4. restart the program

    1. stop the program 2. think very hard 3. improve instrumentation 4. restart the program 5. replicate the problem 6. observe output 7. GOTO 1 I want to highlight these two steps. Stopping and restarting the program is not always an option. What if this is a critical production server? You can’t just stop and start the server, or especially change the code on a whim.
  4. “A process cannot be understood by stopping it. Understanding must

    move with the flow of the process, must join it and flow with it.” The First Law of Mentat
  5. ! ! ! ! 5. replicate the problem 1. stop

    the program 2. think very hard 3. improve instrumentation 4. restart the program 5. replicate the problem 6. observe output 7. GOTO 1 And then there’s this step. What if the problem takes days or very unusual circumstances to replicate? Sometimes it’s not always trivial to directly replicate a problem. But you’ll know it when you see it.
  6. DTrace These types of 1% problems are where I use

    DTrace. DTrace is a powerful, flexible tool that empowers you to solve problems that are otherwise intractible.
  7. scriptable, full-stack, runtime, production-safe instrumentation tool This is the best

    way I could sum up DTrace. It’s an instrumentation tool, so it tells you about interesting events in your system. You can use that for both profiling or debugging. It’s scriptable, which is how you tell DTrace what events are interesting to you. It’s full-stack, meaning you can instrument everything from your Perl application to the Perl interpreter it’s running on to your kernel to your device drivers, even in a gestalt sense (so you can correlate how your Perl application, Postgres, and the hard drive are working together). It’s runtime meaning you can instrument programs as they run without any modification or special compile flags or even restarting them. And finally it’s production-safe meaning you never have to worry about it interfering negatively with your system. It’s low overhead and carefully designed to prevent destructive activity.
  8. DTrace “the best last resort” I personally think about DTrace

    as the best last resort. It’s never the first tool I reach for. (That is Google) It’s just too generic and flexible and requires a bit more careful use. But when those specialized tools like Devel::NYTProf or strace or Charles proxy or even printf fail me, I know DTrace is there to back me up.
  9. ! 2. think very hard 1. stop the program 2.

    think very hard 3. improve instrumentation 4. restart the program 5. replicate the problem 6. observe output 7. GOTO 1 But regardless of how good your tools are, you’re never going to be able to avoid this step. But, DTrace will help a little, since its power and flexibility affords
  10. I18N test fail Slow local CDN Compiling regex File regressing

    Now I want to get into some specific problems I ran into in my career for which DTrace ended up being the only way to solve them. My hope is that you will see these and
  11. I18N test fail ࠃࡍԽͷ͍ͤɺςετࣦഊ The first story is a test

    that was failing because of internationalization.
  12. Failed test 'gpg: error reading key: ެ։伴͕ݟ͔ͭΓ·ͤΜ' doesn't match '(?-xism:public

    key not found)' I was seeing this problem where tests were failing because some output was being localized into Japanese. Tests passed for everybody else. I’m not the only developer using a language other than English; there was a Russian guy on this project too. So it’s not that our I18N was completely busted.
  13. rt $ ack -a ެ։伴͕ݟ͔ͭΓ·ͤΜ rt $ This string does

    not exist in our project, so it seemed that the translation was being done by gpg itself. This significantly narrowed down the search space. It seemed that something was wonky with the way we were invoking gpg. But it wasn’t happening to the Russian guy, so it was a particularly odd problem.
  14. How come GPG knows to use ೔ຊޠ? So to figure

    out what is different here, we have to investigate why GPG knows to use Japanese.
  15. Hypothesis: syscalls My first hypothesis was there was some kind

    of syscall that GPG was making to figure out what language it should be using. Since the environment variables should be the same between everyone’s systems, since our project was standardizing which variables were passed in.
  16. Instrument gpg’s syscalls Instrumenting gpg’s syscalls, we can see that

    it opens and reads a plist file in my ~/Library directory, which was how gpg could tell that my system should be using Japanese. ! (OS X apparently changed this behavior in the intervening years, but this was true at the time)
  17. $ LC_ALL= gpg gpg: ։࢝͠·͢ɻϝοηʔδΛଧ͍ͬͯͩ͘͞ ... This is how we

    were invoking GPG. We cleared LC_ALL and LANG and other related variables to try to get GPG into a consistent, pristine state.
  18. $ LC_ALL=ja gpg gpg: ։࢝͠·͢ɻϝοηʔδΛଧ͍ͬͯͩ͘͞ ... Of course, if we

    force Japanese, gpg will continue producing Japanese.
  19. $ LC_ALL=en gpg gpg: Go ahead and type your message

    ... BUT if we use LC_ALL=en, then that convinces GPG to use English regardless of my system’s settings. Since our test suite is in English, that was ultimately what we did.
  20. -$ENV{LC_ALL} = ‘’; +$ENV{LC_ALL} = ‘en’; The fix then is

    to force English output with the correct LC_ALL setting, rather than letting GPG guess based on the environment. And the environment is what was different between the Russian developer and myself; I’m on a Mac, he was on Linux.
  21. “the best last resort” I know what some of you

    are thinking… you called DTrace the “best last resort”. Why didn’t you just use strace to solve this problem?
  22. It amazes me that Marvel printed that line in 1984.

    How would kids even know what that meant?
  23. dtruss I did in fact use the OS X equivalent

    of strace for this. dtruss is a “frontend” to DTrace. It just configures DTrace to automatically emit information relating to syscalls.
  24. dtruss -n gpg What I actually used was “dtruss -n

    gpg”. What this does is instrument ALL gpg processes and print the syscalls they make. So I launched this in one terminal, then switched to another terminal to run the test file that was failing. I didn’t have to pause the test at some crucial moment to capture gpg’s pid, or edit a single line of code. Pretty nice!
  25. Even though Paul released strace 2.5 in 1992, Branko's work

    was based on Paul’s strace 1.5 release from 1991.” “ man strace While reading the strace man page I noticed this interesting little tidbit in its History section. Isn’t it swell that we have the internet nowadays? Rebasing that must’ve put a severe dent into Mr. Lankester’s day.
  26. Slow local CDN We were writing a small static fileserver

    for a client as part of a larger project. This server was pretty much a thin wrapper around Plack::App::Static. But we noticed that it was pretty slow.
  27. time curl cdn.local:9292 ! 5.008 total Like, every request takes

    5 seconds slow. Both from a web browser and from curl. This was only happening on a few machines, including mine. And I cannot abide this kind of problem. I’m sure I used tools like Devel::NYTProf and iotop to try to figure out why the server was being so slow. But no progress. From the point of view of Perl, everything was super fast.
  28. 67648/0xb8097: madvise(0x7FE93B4A1000, 0x1000, 0x7) = 0 0 67648/0xb8097: madvise(0x7FE93B4A2000, 0x1000,

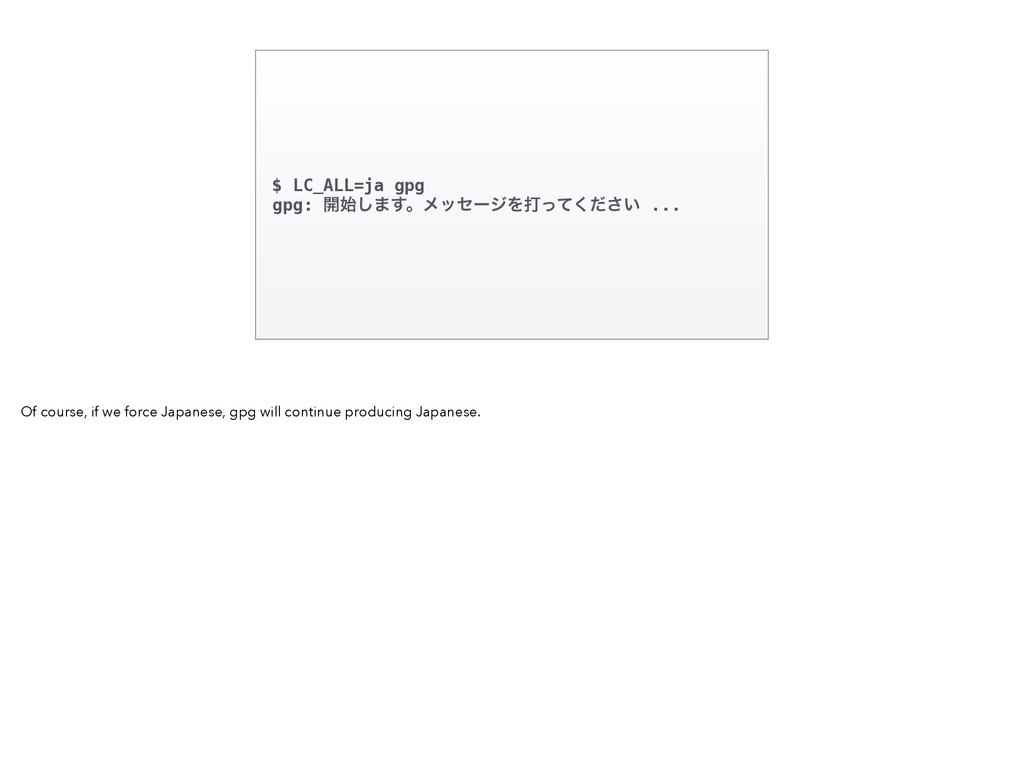
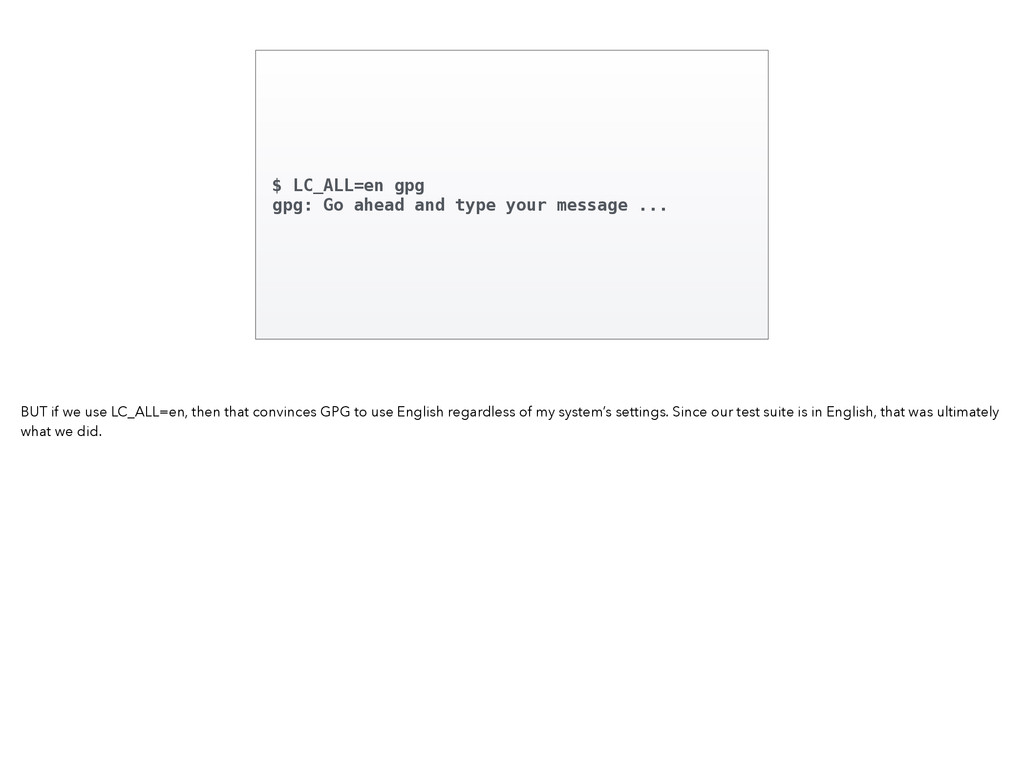
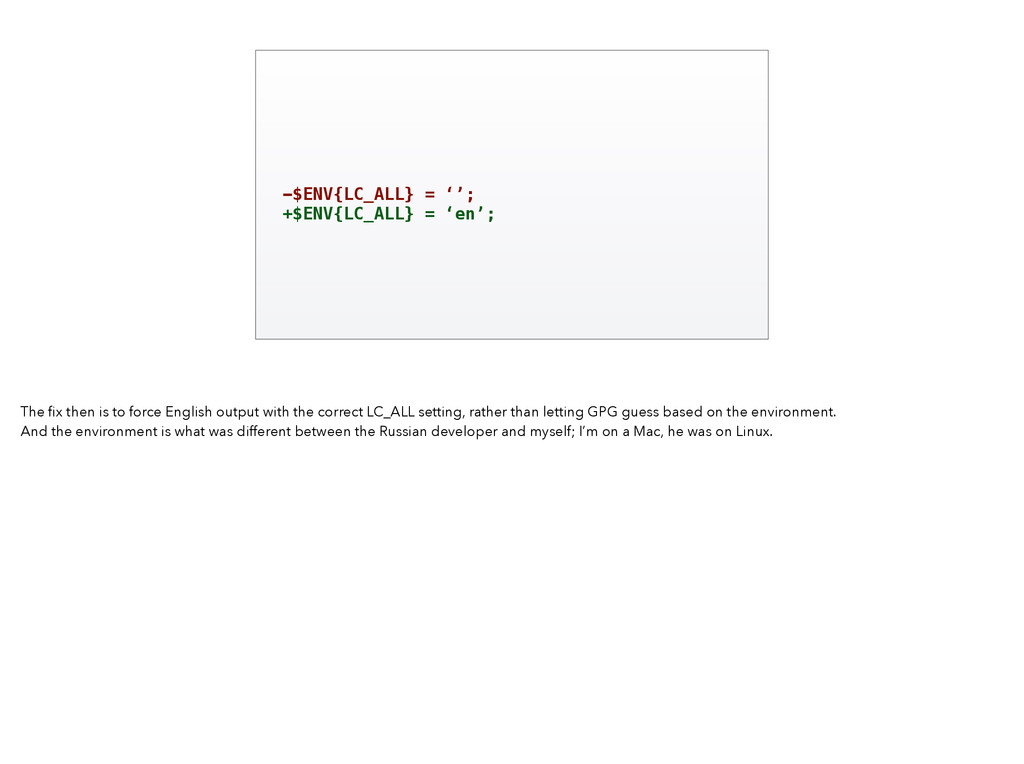
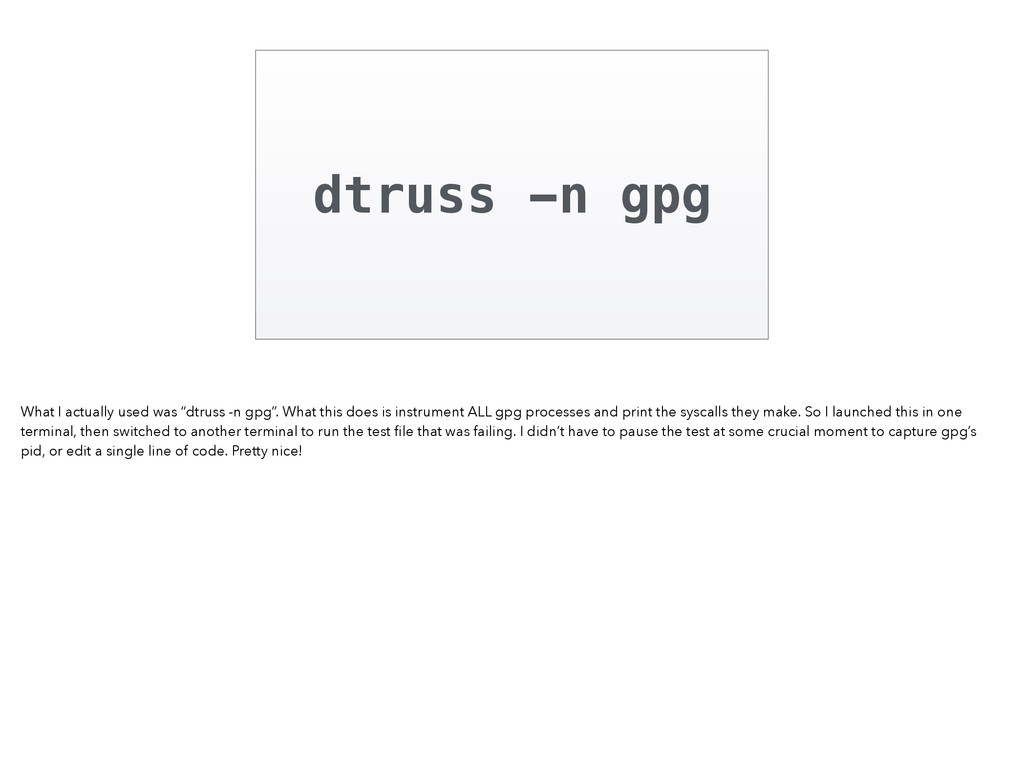
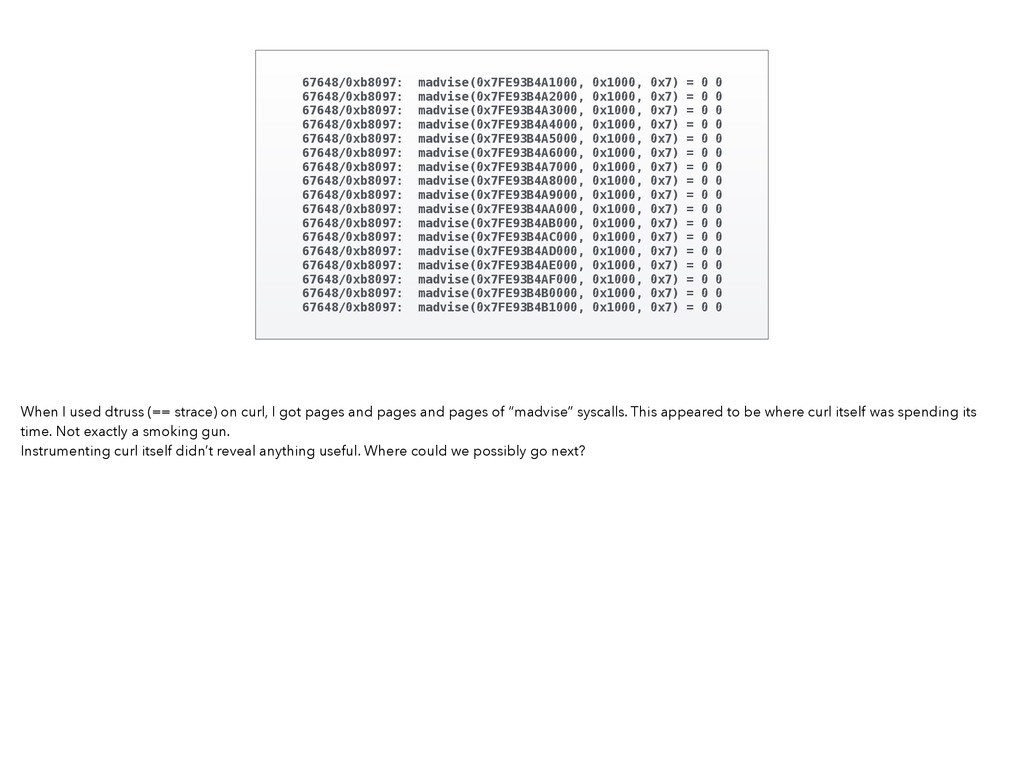
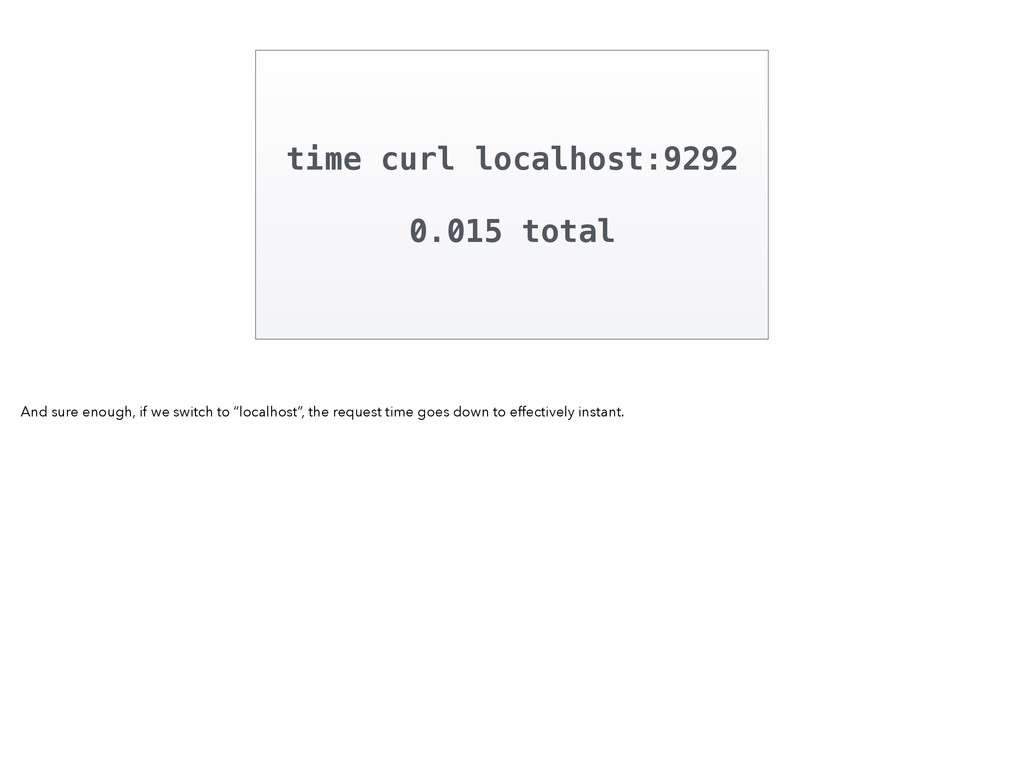
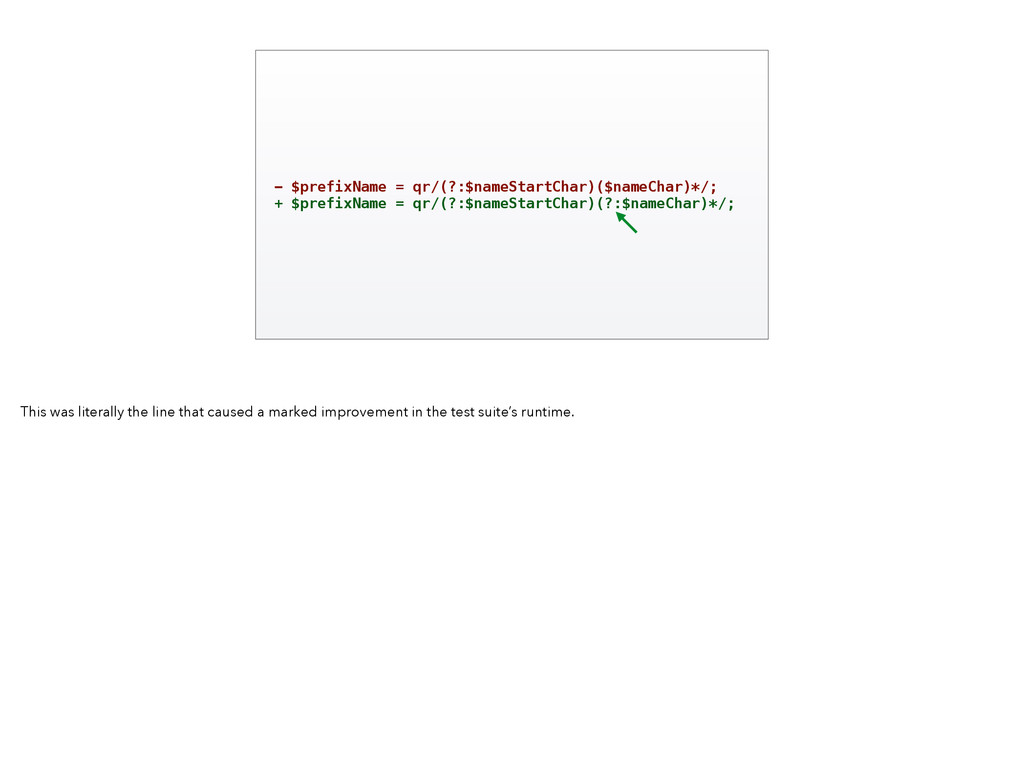
    0x7) = 0 0 67648/0xb8097: madvise(0x7FE93B4A3000, 0x1000, 0x7) = 0 0 67648/0xb8097: madvise(0x7FE93B4A4000, 0x1000, 0x7) = 0 0 67648/0xb8097: madvise(0x7FE93B4A5000, 0x1000, 0x7) = 0 0 67648/0xb8097: madvise(0x7FE93B4A6000, 0x1000, 0x7) = 0 0 67648/0xb8097: madvise(0x7FE93B4A7000, 0x1000, 0x7) = 0 0 67648/0xb8097: madvise(0x7FE93B4A8000, 0x1000, 0x7) = 0 0 67648/0xb8097: madvise(0x7FE93B4A9000, 0x1000, 0x7) = 0 0 67648/0xb8097: madvise(0x7FE93B4AA000, 0x1000, 0x7) = 0 0 67648/0xb8097: madvise(0x7FE93B4AB000, 0x1000, 0x7) = 0 0 67648/0xb8097: madvise(0x7FE93B4AC000, 0x1000, 0x7) = 0 0 67648/0xb8097: madvise(0x7FE93B4AD000, 0x1000, 0x7) = 0 0 67648/0xb8097: madvise(0x7FE93B4AE000, 0x1000, 0x7) = 0 0 67648/0xb8097: madvise(0x7FE93B4AF000, 0x1000, 0x7) = 0 0 67648/0xb8097: madvise(0x7FE93B4B0000, 0x1000, 0x7) = 0 0 67648/0xb8097: madvise(0x7FE93B4B1000, 0x1000, 0x7) = 0 0 When I used dtruss (== strace) on curl, I got pages and pages and pages of “madvise” syscalls. This appeared to be where curl itself was spending its time. Not exactly a smoking gun. Instrumenting curl itself didn’t reveal anything useful. Where could we possibly go next?
  29. Profile the kernel! That’s right. With DTrace, you can profile

    the kernel itself. You certainly don’t need to recompile the kernel to do this. You don’t even need to reboot the machine into some kind of safe mode or anything.
  30. Every 1001 µs, snapshot kernel stack Our plan of attack

    will be to look at what the kernel is doing every thousand (and one) microseconds. Then surely we’ll be able to figure out what the hell is going on in our process that takes five whole seconds.
  31. New plan! That in itself is useful information. It means

    something is blocking waiting for something else to happen. The fact that every request seems to take 5.0x seconds also suggests that there’s a 5 second timeout somewhere.
  32. When curl becomes blocked, capture stack trace So here’s our

    plan. When curl does become blocked waiting for something, capture its stack trace. That might help us understand where the time is being spent.
  33. dyld`dlopen+0x1b8 The most prevalent stack trace includes dlopen. That is

    for loading dynamic libraries. I’m pretty sure that’s not slow, otherwise every curl invocation would take a long time. Moving on.
  34. libsystem_dnssd.dylib`DNSServiceQueryRecord+0x115 libsystem_info.dylib`_mdns_query_start+0x337 libsystem_info.dylib`_mdns_search+0x31b libsystem_info.dylib`mdns_addrinfo+0x201 libsystem_info.dylib`search_addrinfo+0xb7 The next stack trace looks

    very interesting. Look at all these references to DNS and something called “mdns”. Now that we have this new piece of information, we can restart our debug cycle from the top. And what’s the first step to solve any programming problem?
  35. One of the first results for “mDNS” is the Wikipedia

    article on Multicast DNS. Let me summarize: If your machine is resolving a hostname ending in “.local”, that triggers a Multicast DNS lookup. Which involves sending out a request to all other machines on the local network. The matching machine responds with its IP address. This is how Bonjour for Mac works. That process can take some time. Say… up to 5 seconds?
  36. time curl localhost:9292 ! 0.015 total And sure enough, if

    we switch to “localhost”, the request time goes down to effectively instant.
  37. time curl app.cdn:9292 ! 0.016 total Or we could use

    a special hostname that doesn’t end in “.local”, which is how we ended up solving the problem.
  38. Compiling regex At the Moving to Moose Hackathon a few

    years ago, someone was working on improving the performance of the Perl/RDF toolchain.
  39. “Is there a regular expression master in the room?” They

    ran into a problem and Ruben Verborgh asked “Is there a regular expression master in the room?” I volunteered to help. Oops.
  40. The basic problem was that a regex was being recompiled

    every time it was matched. Which was happening like 380k times. And all those compilations add up to a looooong time.
  41. qr/…/ So of course I first jumped in and suggested

    qr//. But bizarrely, this was happening even though the regex was being compiled correctly.
  42. What now? So Ruben and crew found this performance problem

    immediately with NYTProf. ! But the next step, figuring out why this was happening, wasn’t obvious.
  43. perl’s C stack We wanted more detail than NYTProf could

    give. We investigated the C stack trace of the Perl interpreter using DTrace. The hope was we’d see something in there that hints at what was happening under the hood. Why regcomp was being called. Unfortunately, that did not pan out.
  44. value --------- Distribution --------- count 2 | 0 4 |

    7 8 |@@@@@@@@@@@@@@@ 44834 16 |@@@@@@@@@@@@@@@ 45058 32 | 0 64 | 0 128 |@@@@@ 14926 256 |@@@@@ 15186 512 | 15 1024 | 0 Eventually I ended up timing how long every match took. This chart buckets the duration of each match. So obviously a quarter of the matches are taking an order of magnitude longer. That’s probably because these matches required compilation. As soon as I produced this chart, Ruben jumped up and said “Eureka!” The problem was with one of the four regular expressions that are matched here.
  45. - $prefixName = qr/(?:$nameStartChar)($nameChar)*/; + $prefixName = qr/(?:$nameStartChar)(?:$nameChar)*/; This was

    literally the line that caused a marked improvement in the test suite’s runtime.
  46. Tim Bunce Tim Bunce is the author of NYTProf among

    many other things. He likes DTrace just as much as I do, so he knows quantize would be a useful feature. I still owe him a patch to give him this feature for NYTProf. I’m sorry Tim!
  47. File regressing I was approached by a gentleman who had

    a problem. He knew that he wanted to use DTrace to solve it, but hadn’t learned it yet, so he asked for my help.
  48. R. Pumpking To protect the innocent, I won’t to reveal

    who this gentleman is, but for the sake of the story let’s call him… R. Pumpking.
  49. 1 time 2 3 4 1 1 3 expected.txt Ricardo

    Pumpking was monitoring a particular important file. Now, this is what you expect would happen. First the file’s contents were 1 for a few iterations. Then the contents changed to 2. Then 3. Next time he checked the file was still 3. Then finally 4.
  50. 1 time 2 3 4 1 1 3 got.txt But

    when he monitored this file, this is what its contents actually looked like. Every now and then, the file’s contents would be mysteriously reverted to an earlier version. This was causing problems at work, so he needed to get to the bottom of it.
  51. 1. cron 2. sha1sum 3. printf 4. git 5. locate

    6. perl debugger Tools These were some of the tools that Rik used to try to debug this problem. ! This file was generated by a Perl program. His suspicion was that an older deploy of the code was still being kept around somewhere. But sleuthing around with tools like “locate” and “git” everything looked up to date. And trying printf debugging from the Perl process wasn’t actually firing when it wrote to this file. So something else was. And I’m sure Rik tried several other tools before reaching for DTrace.
  52. “Which processes open or rename this file?” Rik came to

    me for help. He knew I had some proficiency with DTrace. It also helped a lot that I was sitting next to him between talks at YAPC::Asia in Japan. ! He knew what he wanted to know, but asked my help writing the DTrace script.
  53. ! $ echo ACK > foo Input DTrace output Say

    we run this DTrace script on files containing the word “bar”. Obviously, if we write to “foo”, we’ll get no output from DTrace.
  54. ! $ echo SYN > bar Input ! zsh <-

    bar ! mdworker <- /Users/sartak/bar DTrace output But if we echo to the file “bar”, we’ll see some output from DTrace. First is my shell opening the file to write to it. But then almost immediately after, a process called “mdworker” looks at this file. mdworker is the process that manages the index for OS X’s “Spotlight” search engine. So it’s cool to see it notice the changed file and instantly updates its index.
  55. ! $ mv foo bar Input ! mv: foo ->

    bar ! mdworker <- /Users/sartak/bar ! Finder <- /Users/sartak/bar DTrace output If we move a different file on top of our interesting file, we’ll see output there too. First of course is the “mv” process that I invoked. Then the expected mdworker updating the Spotlight index. Then finally Finder had a peek at the file. I’m not sure why; that might be worth investigating further (using DTrace!). Maybe I had a Finder window open to this directory when it happened, so it had to update its view.
  56. ! $ cat bar Input ! cat <- bar DTrace

    output And finally if we open the file for reading we’ll see that too. That wasn’t part of Rik’s spec for the DTrace program, but I figured better to include such actions in the hopes of spotting something interesting rather than being overly precise.
  57. smtpd <- vital.txt ! smtpd <- vital.txt ! perl <-

    vital.txt ! smtpd <- vital.txt ! puppet: vital.txt -> vital.txt DTrace output So when Rik ran this on his production server, he saw that smtpd opened this file every few moments. Probably in response to outgoing email. Every now and then, perl would open the file for writing. But we already ruled that out as the source of the problem with printf debugging. Finally, every so often, a puppet process was mv’ing a file onto our target file. Bingo!
  58. I18N test fail: OS X config Slow local CDN: mDNS

    Compiling regex: (?: …) File regressing: Puppet So we saw a number of mysteries solved with DTrace. In all cases, many other tools were used in the attempt to solve the problem before arriving at DTrace. So if we didn’t know DTrace, there’s a good chance we wouldn’t have been able to solve them.
  59. Confidence And so, DTrace gives me the confidence that I

    can solve any problem that gets sent my way. Since it empowers you to inspect every part of the stack both in isolation and in the gestalt, it lets you build tools to answer exactly the questions you need answered. And that engenders a tremendous sense of confidence.
  60. dtracebook.com man perldtrace mailing list training dtrace.conf HOLD UP KINDLE

    The first and foremost resource is the DTrace book written by Brendan Gregg and Jim Mauro. It’s a very thick tome, but it contains a billion useful D scripts. Perl has document describing its DTrace support and gives sample scripts. There’s a low-traffic, high SNR mailing list where you can get help from the original developers and the rest of the community. Joyent offers a multi-day training every year or so. Every couple years there’s a DTrace conference.
  61. One more thing… Oh, before I go, there is one

    more little thing… It turns out that DTrace is not just a development-time tool. Since it describes itself as “safe for production” I see no reason we can’t use it as a fundamental building block in our applications.
  62. NetHack AI Tactical Amulet Extraction Bot Years ago I worked

    on a NetHack bot with Jesse Luehrs, Stefan O’Rear (who later went on to write Niecza), and others. It did pretty well; got very far. I’m still quite happy with its architecture. Which surprises me, given it’s ~7 years old at this point.
  63. The primary thing I was unhappy with about TAEB was

    its speed. 2 or 3 turns per second is not great. We profiled and tried to optimize where we could. We couldn’t really find bottlenecks, so we just chalked it up to Perl having too much overhead. Since we didn’t want to abandon Perl (we’d accumulated 25k lines of code and tons of NetHack::* libraries), there wasn’t much we could do besides try to do less work. ! One recurring problem we had was in interfacing with NetHack. We didn’t want to modify the code at all, so we could never be suspected of cheating by looking at internal, private game state. That way we could also play on public servers alongside everyone else. But it means we need to stay in sync with NetHack; we need to know when it’s done sending us output and is waiting for input. That turns out to be a hard problem and the way we solved it for public server play was with fragile telnet protocol abuse. For local play, we had some solutions but the only one that worked on my machine boiled down to sleeping a fixed amount of time every turn. ! But late last year I realized I could teach TAEB how to use DTrace.
  64. With DTrace, our NetHack bot now runs 10x faster. It

    went from “boring to watch” to “significantly faster than the fastest human players”. This is a huge boon to productivity, debuggability, experimentation, and even to excitement. Games now finish in minutes rather than hours. We could start to analyze the effects of individual changes in terms of play performance. ! Going from idea to working proof of concept took exactly twenty minutes. The implementation wraps a one-line DTrace script which just tells TAEB when NetHack is blocked on input. Since DTrace hooks into the kernel, it notifies TAEB instantly. So the time waiting for NetHack became effectively zero. Perhaps even more importantly, this approach is robust (DTrace will never be wrong), whereas the earlier solutions were approximate (our tricks could only correlate effects with I/O). ! Honestly, I don’t know how we never found this bottleneck in our profiling. I suspect that if we look at those old profile runs again, we’ll see that waiting for NetHack was in fact the biggest bottleneck. We just never saw it because obviously that had to take some chunk of time. It never occurred to us just how much time that actually was.
  65. sub put_on_invis_ring { return if TAEB->is_invisible || TAEB->current_level->enemies == 0;

    ! return if TAEB->equipment->left_ring && TAEB->equipment->right_ring; ! my $ring = TAEB->inventory->find( identity => 'ring of invisibility', is_cursed => 0, ) or return; ! return TAEB::Action::Wear->new(item => $ring); } This is a taste of what the code for my Magus AI looks like. It’s not too bad. This routine decides whether it’s worth putting on a ring of invisibility. There are several conditions that have to be just right for the bot to do it. One rule is that there have to be enemies around. This causes the bot to mostly use its ring of invisibility as a force multiplier in combat. Which is actually quite thrilling to watch. The bot spots a group of monsters, puts the ring on, kills them, then takes it off (because being invisible forever would have unfortunate consequences). Most humans would quickly grow bored of micromanaging the invisibility for each encounter, but that’s of course where computers shine. And it is indeed a distinct advantage to use invisibility this way. Not bad for 10 lines of code. ! Jesse and I have both given talks on our bot TAEB. Unfortunately it’s a pretty dead project at this point. If anyone wants to pick up the reigns come talk to me!
  66. Slides twitter.com/sartak I’ll tweet a link to my slides once

    I’ve got them uploaded. ! Thanks for your attention! Go forth and DTrace!