How fast are prices falling in Japan? Satoshi Imai, Bureau of Statistics, Japan, Chihiro Shimizu, Reitaku University and UBC, Tsutomu Watanabe, University of Tokyo
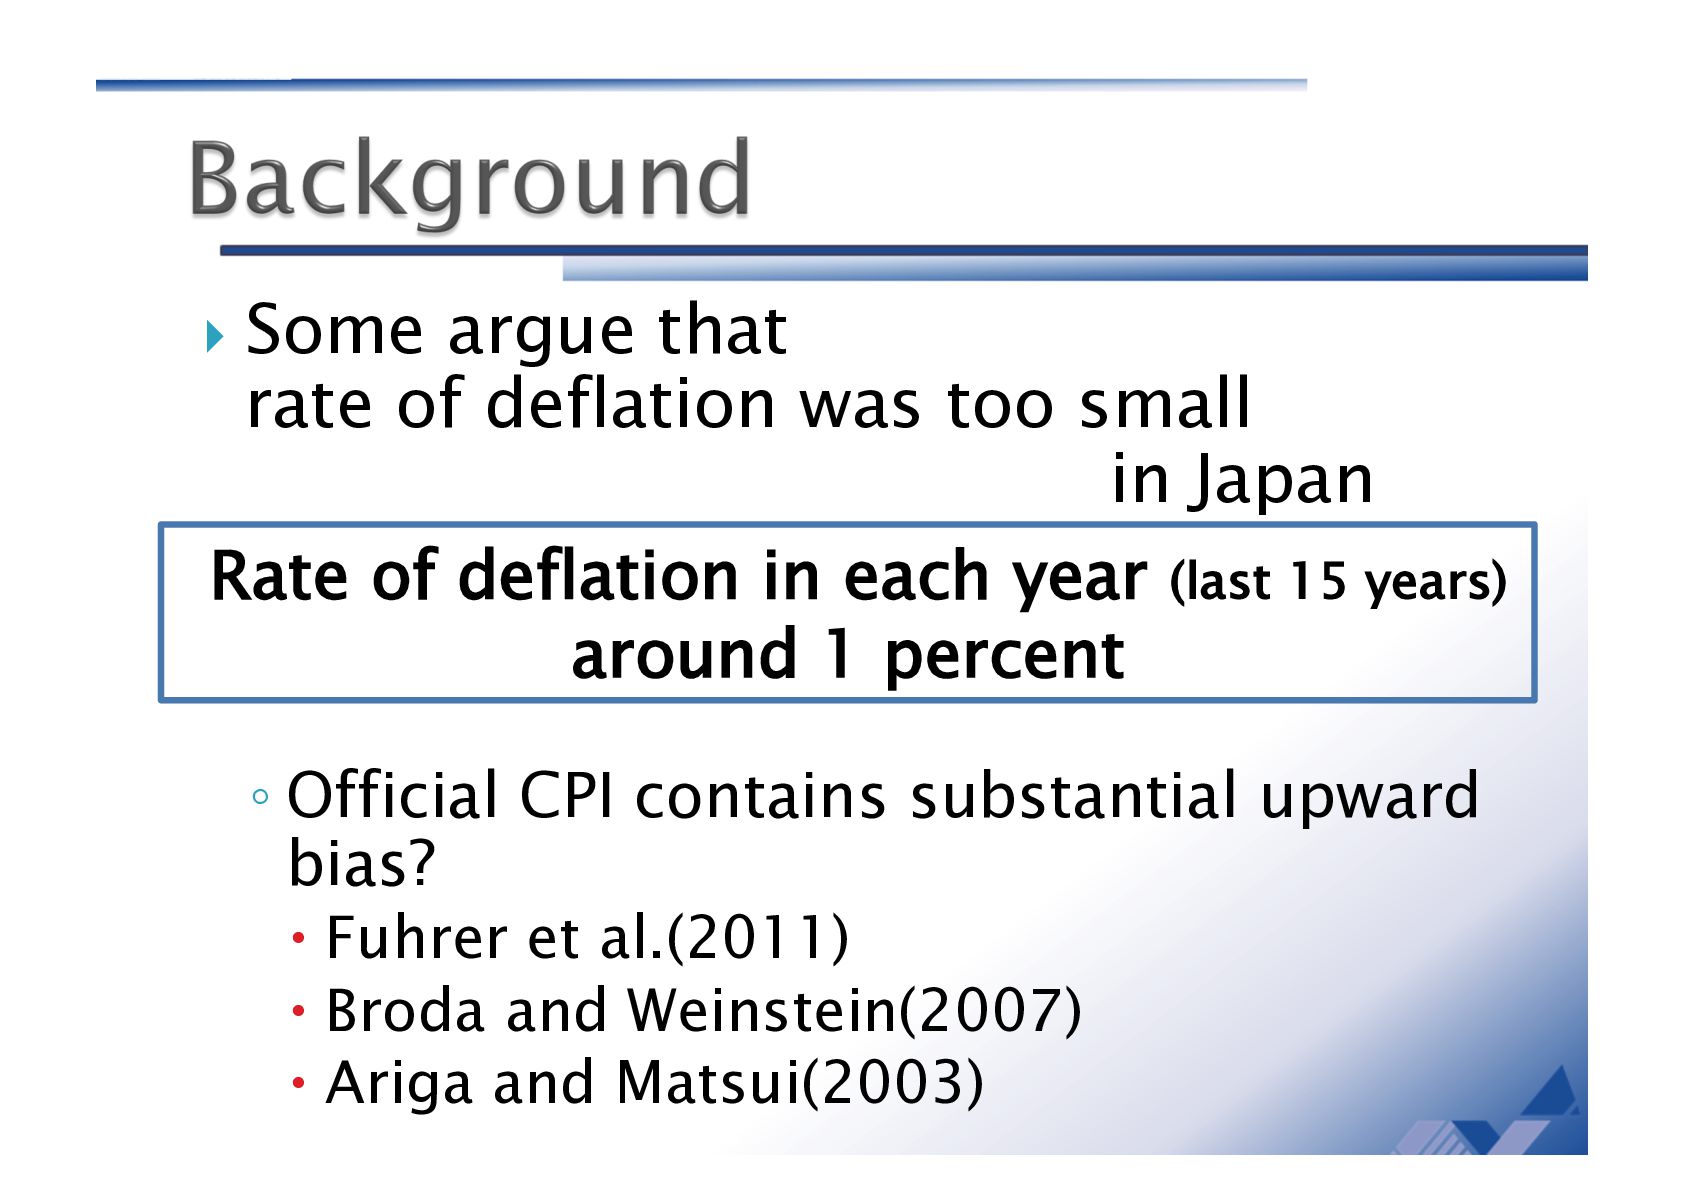
in Japan ◦ Official CPI contains substantial upward bias? Fuhrer et al.(2011) Broda and Weinstein(2007) Ariga and Matsui(2003) Rate of deflation in each year (last 15 years) around 1 percent
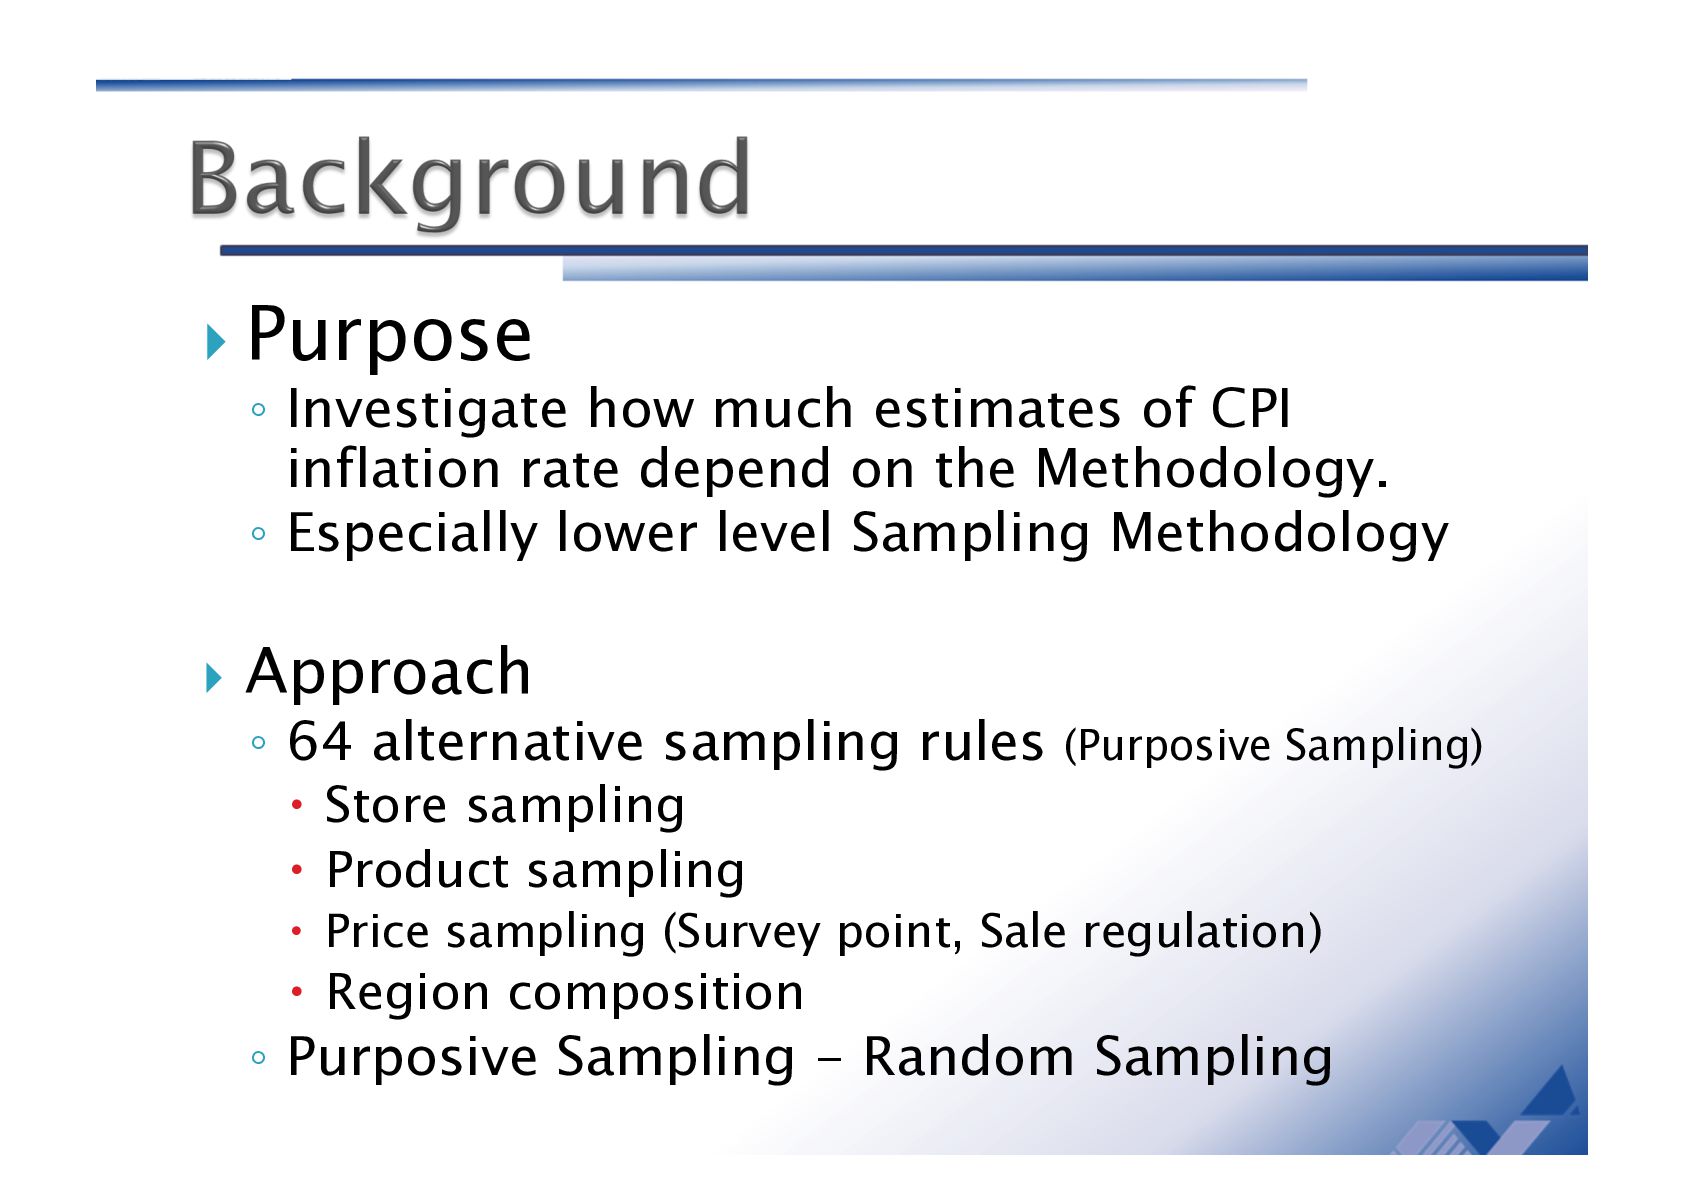
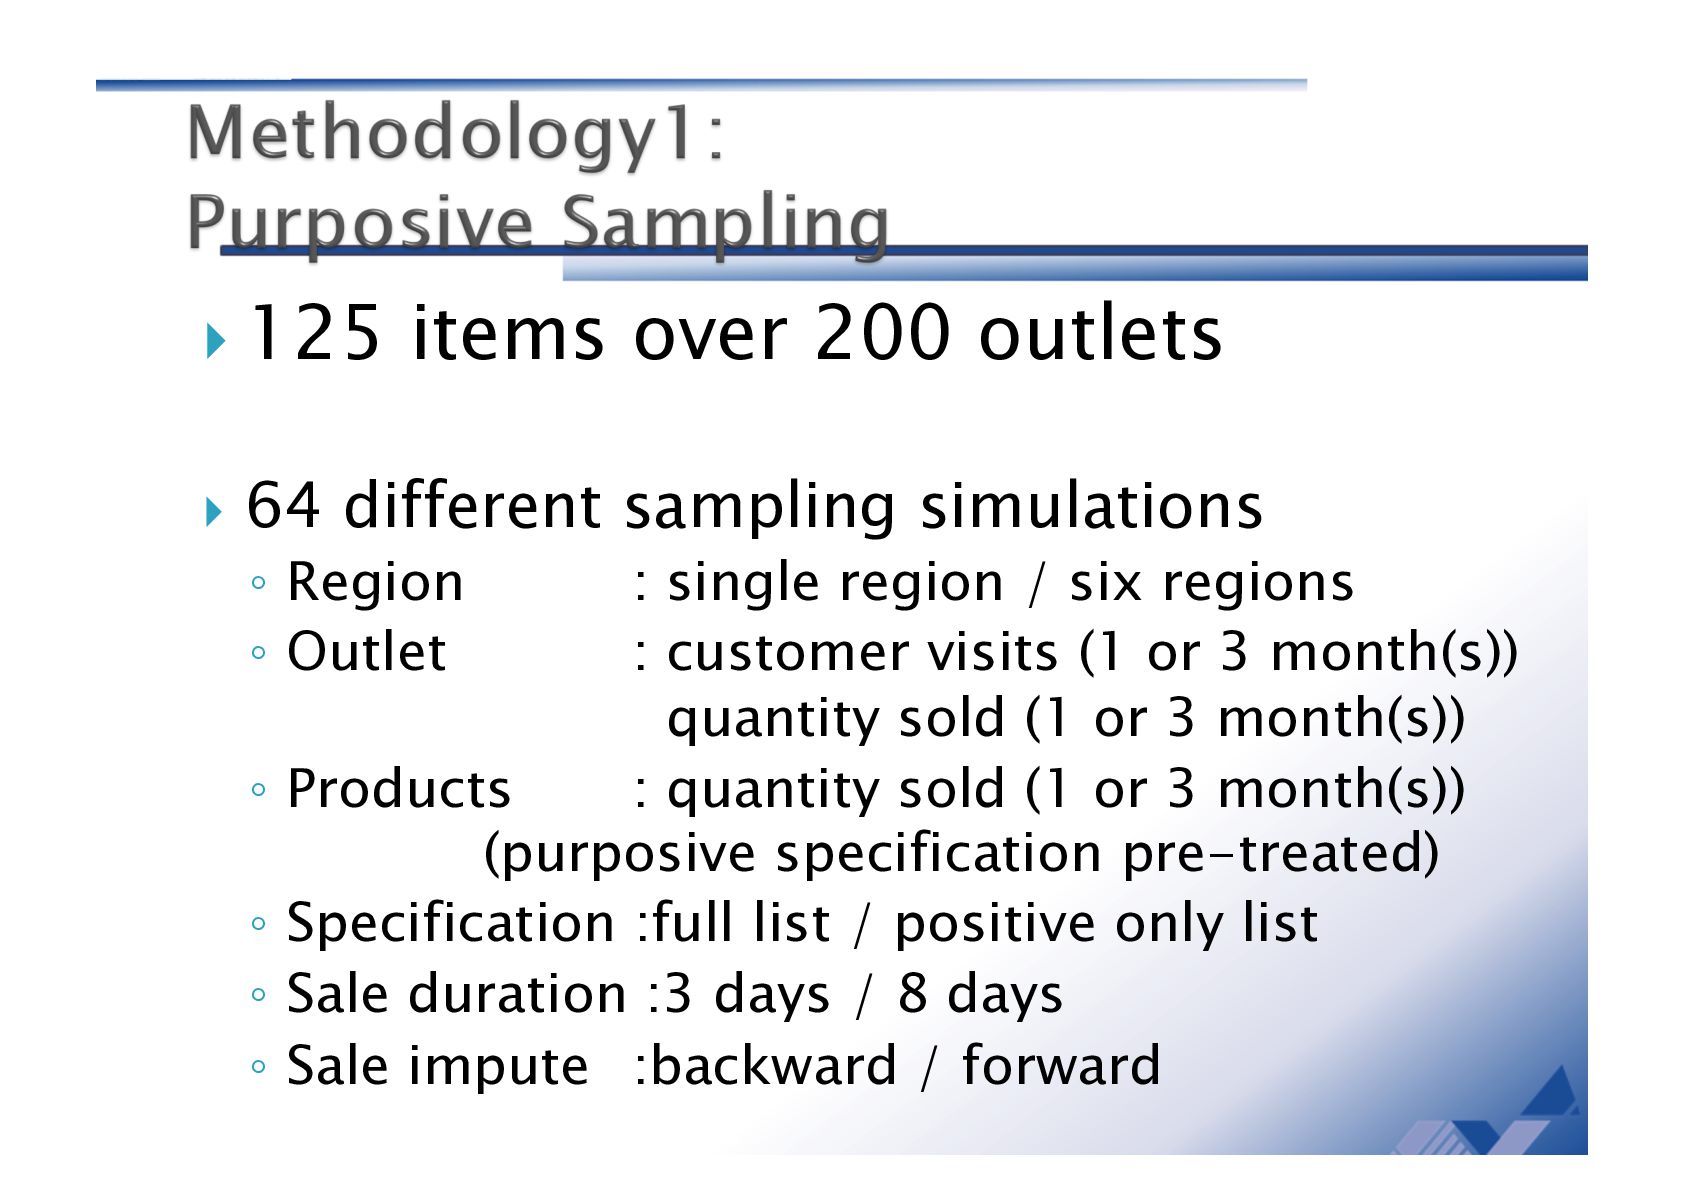
on the Methodology. ◦ Especially lower level Sampling Methodology Approach ◦ 64 alternative sampling rules (Purposive Sampling) Store sampling Product sampling Price sampling (Survey point, Sale regulation) Region composition ◦ Purposive Sampling - Random Sampling
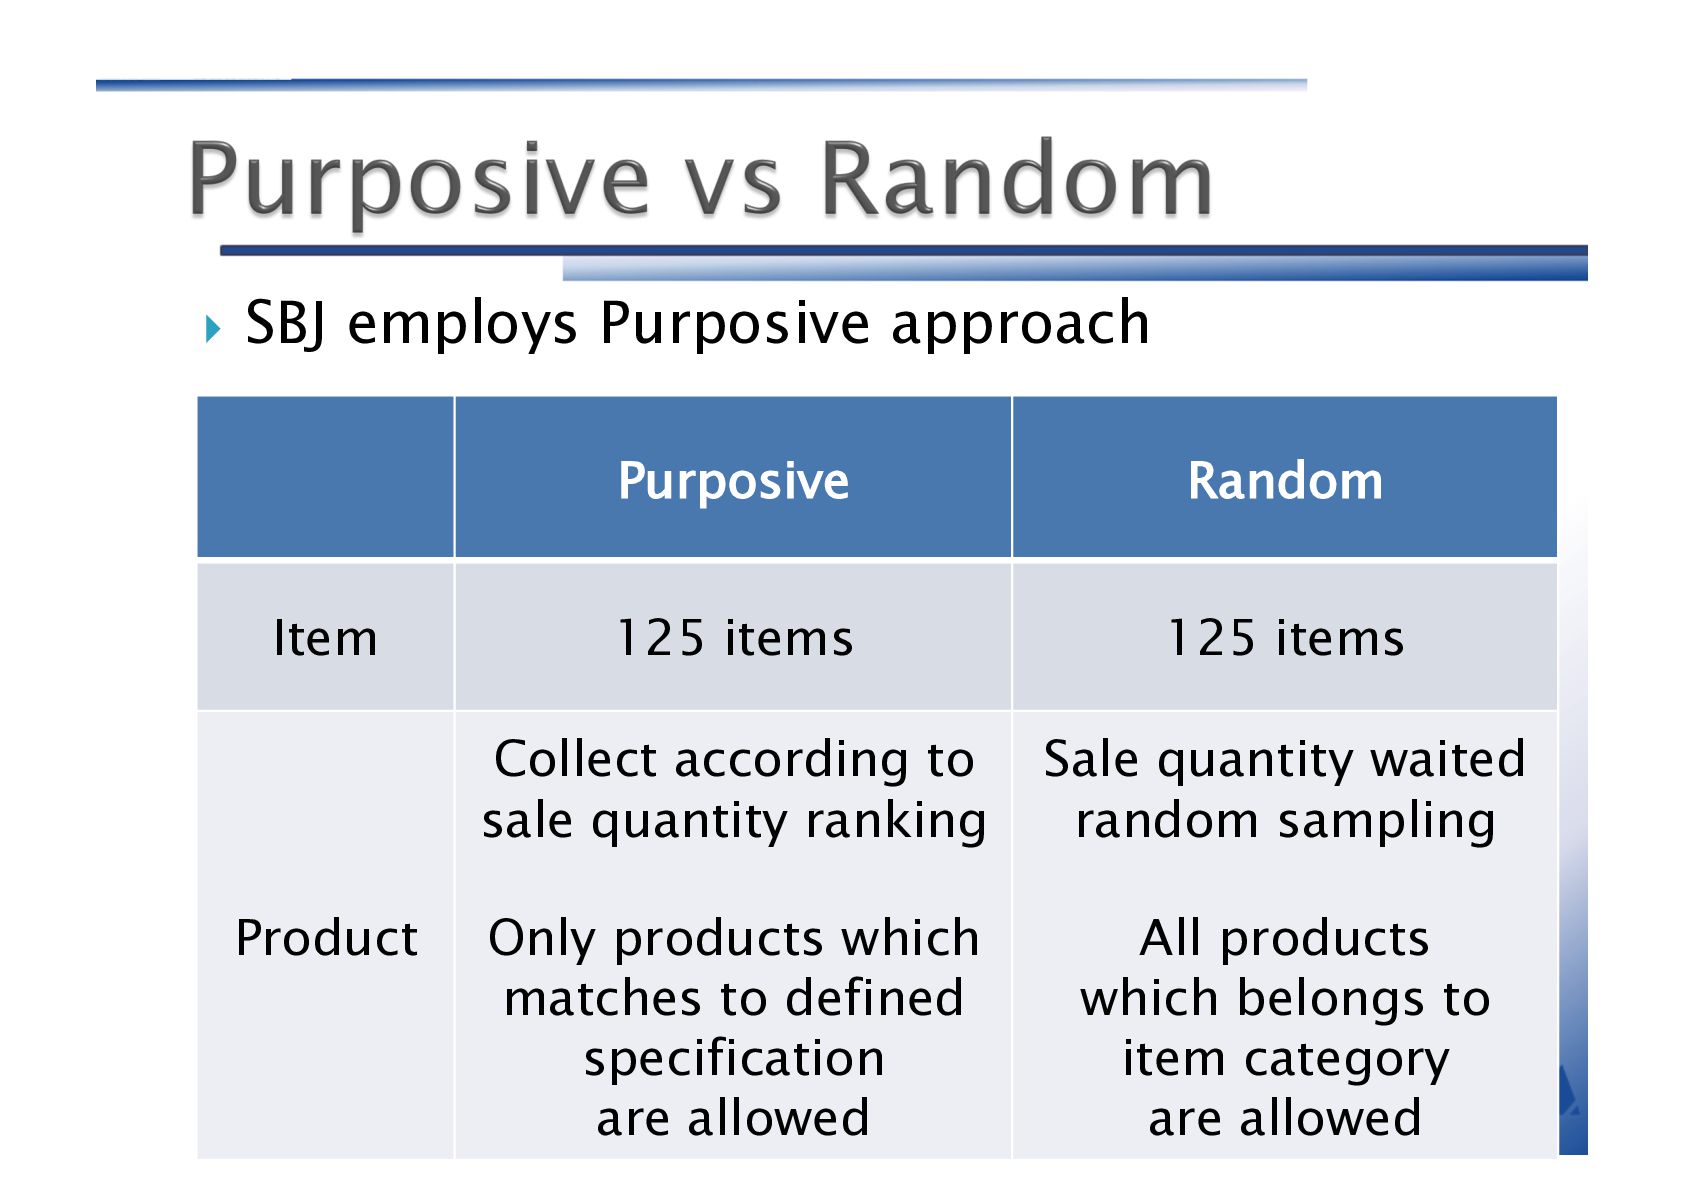
125 items Product Collect according to sale quantity ranking Only products which matches to defined specification are allowed Sale quantity waited random sampling All products which belongs to item category are allowed
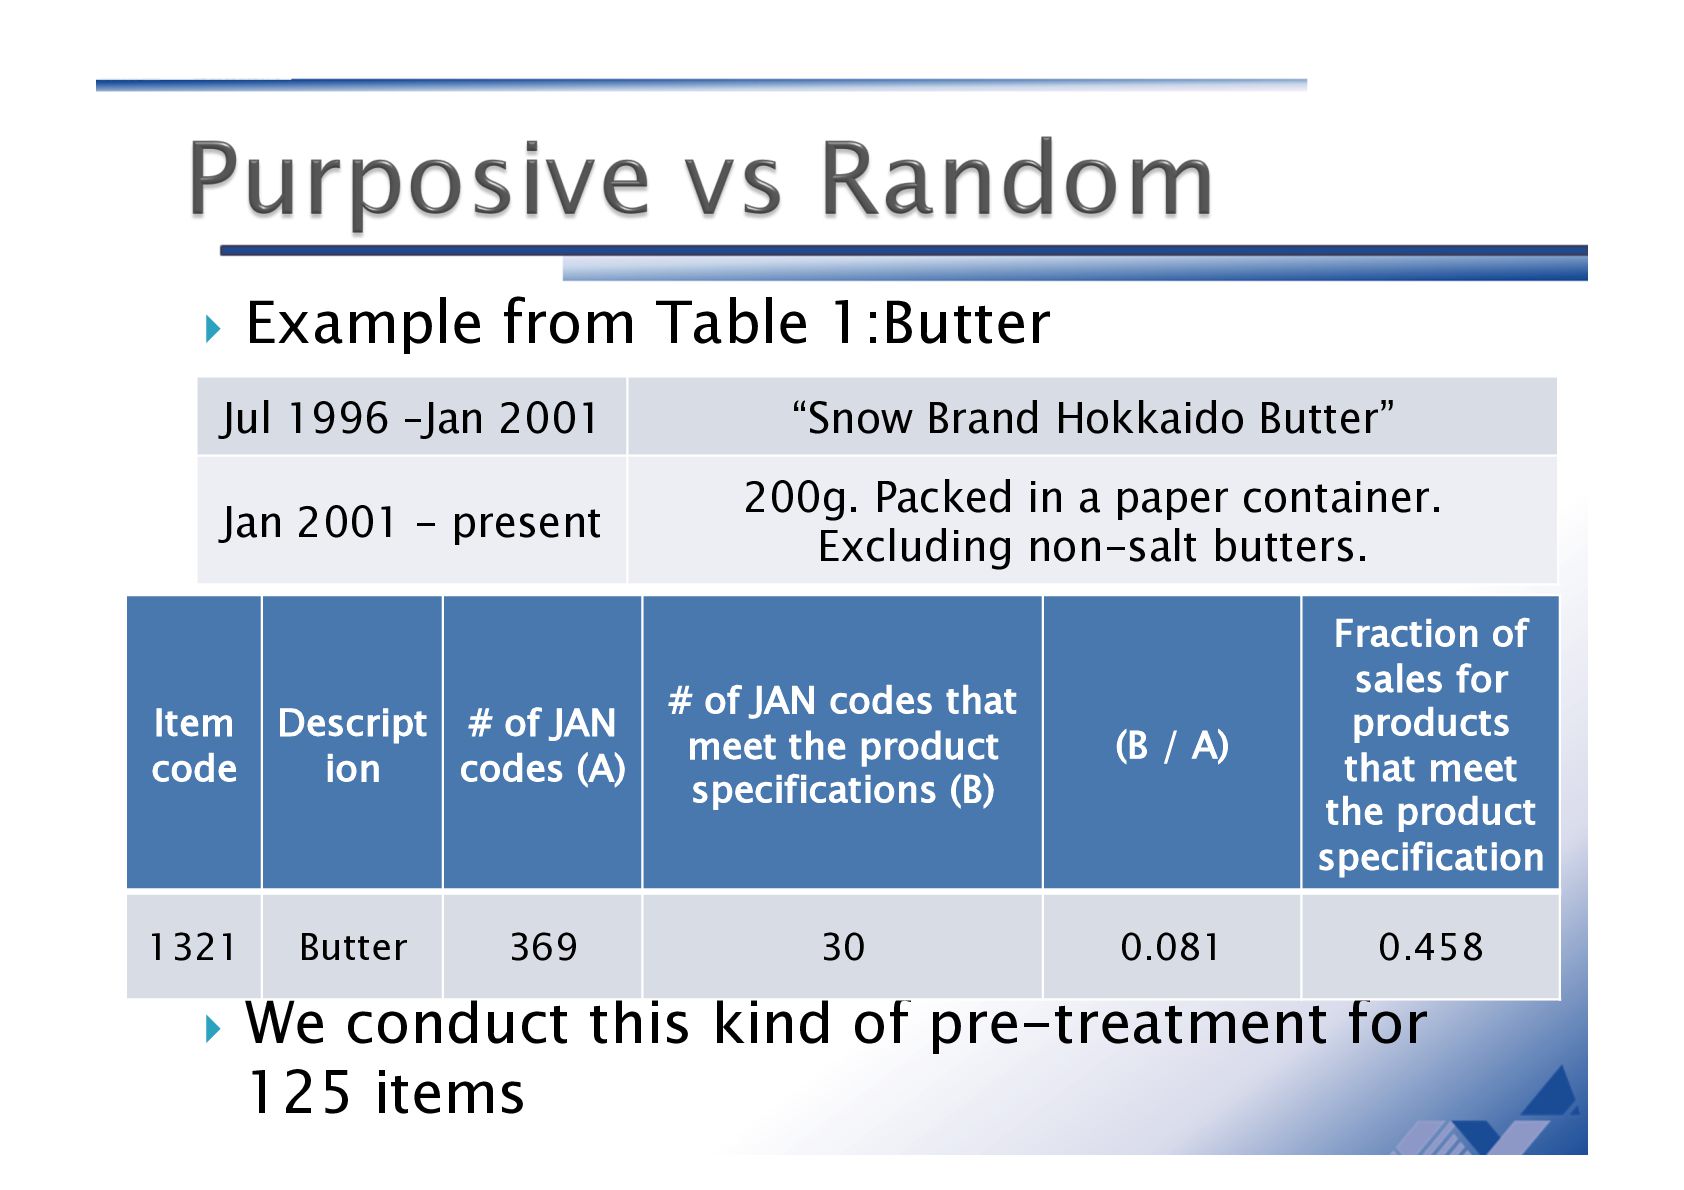
of pre-treatment for 125 items Jul 1996 –Jan 2001 “Snow Brand Hokkaido Butter” Jan 2001 - present 200g. Packed in a paper container. Excluding non-salt butters. Item code Descript ion # of JAN codes (A) # of JAN codes that meet the product specifications (B) (B / A) Fraction of sales for products that meet the product specification 1321 Butter 369 30 0.081 0.458
◦ Region : single region / six regions ◦ Outlet : customer visits (1 or 3 month(s)) quantity sold (1 or 3 month(s)) ◦ Products : quantity sold (1 or 3 month(s)) (purposive specification pre-treated) ◦ Specification :full list / positive only list ◦ Sale duration :3 days / 8 days ◦ Sale impute :backward / forward
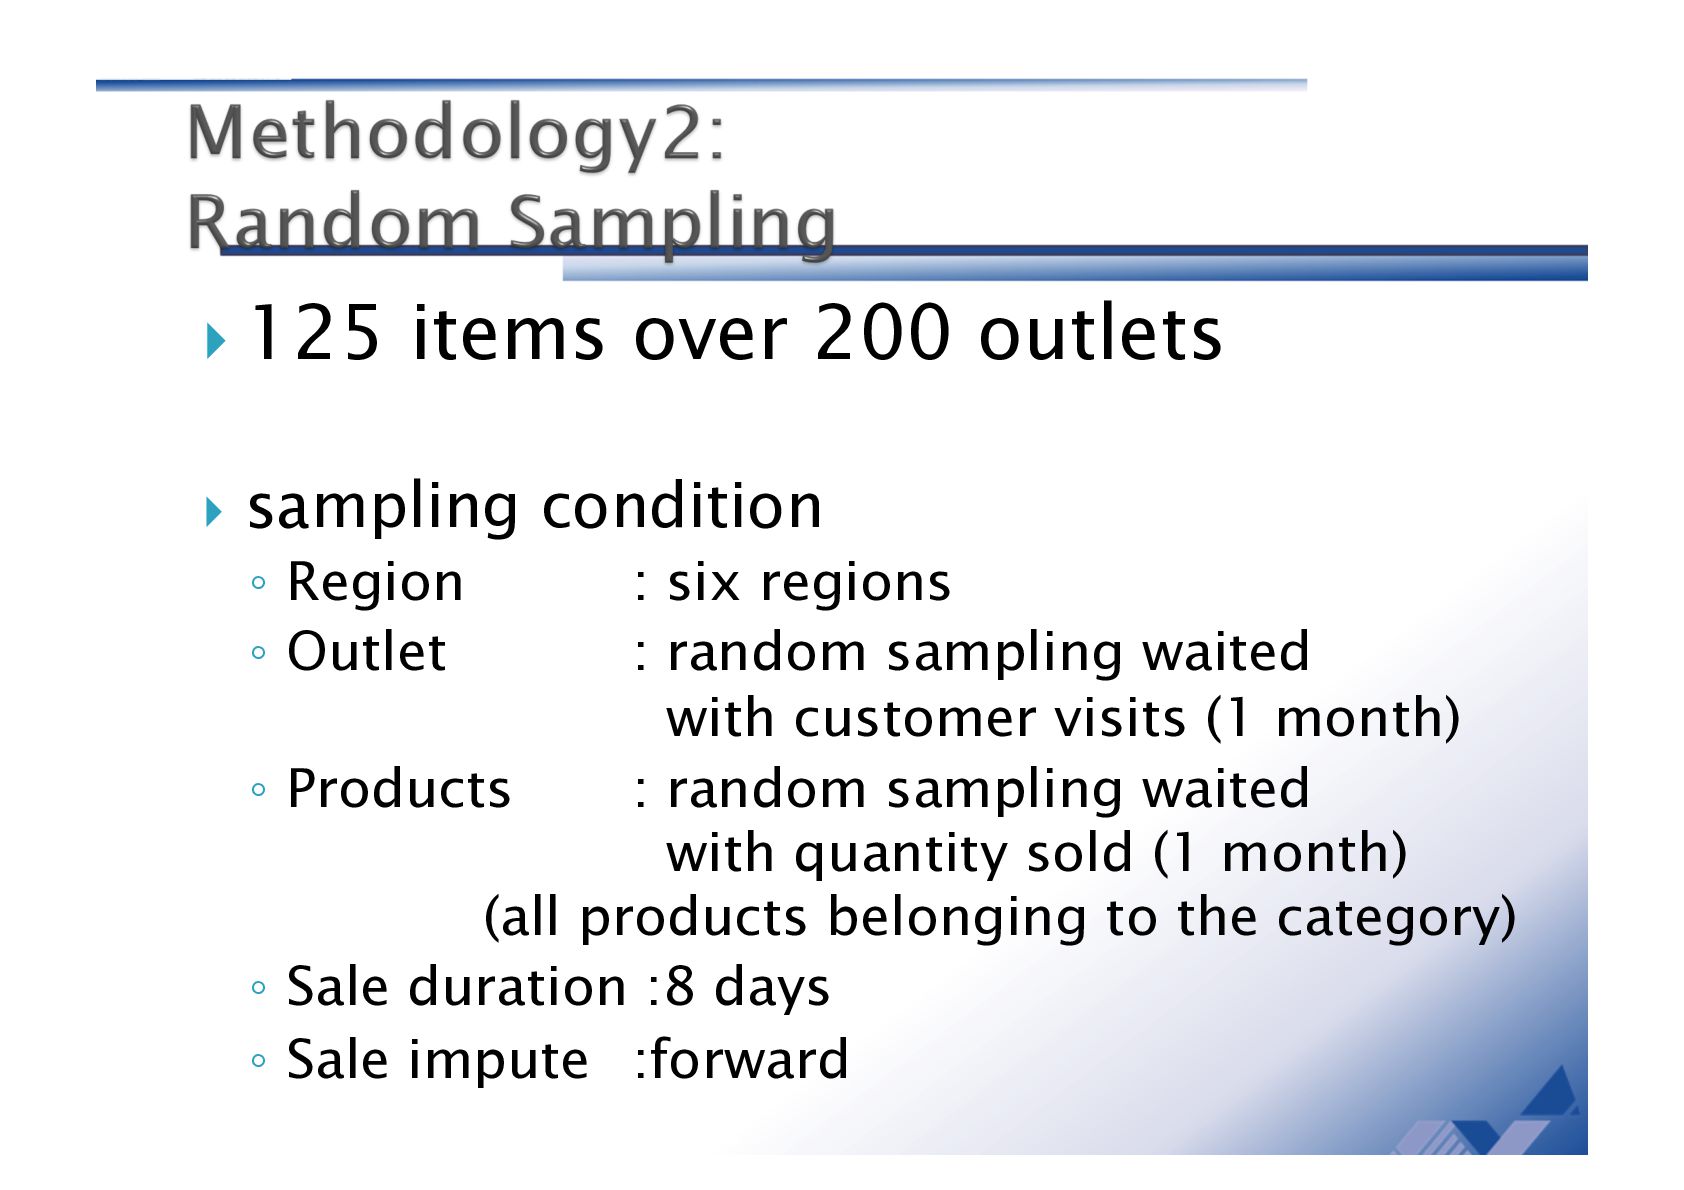
six regions ◦ Outlet : random sampling waited with customer visits (1 month) ◦ Products : random sampling waited with quantity sold (1 month) (all products belonging to the category) ◦ Sale duration :8 days ◦ Sale impute :forward
![Thank you for all your attention. Contact to: [email protected] Satoshi](https://files.speakerdeck.com/presentations/1327795184324295a57b894fe3065528/slide_14.jpg)