Upgrade to Pro — share decks privately, control downloads, hide ads and more …

Private Label Brands versus National Brands: So...

Sponsored · Your Podcast. Everywhere. Effortlessly. Share. Educate. Inspire. Entertain. You do you. We'll handle the rest.

Private Label Brands versus National Brands: Some Implications for the Construction of the CPI

https://unece.org/statistics/events/group-experts-consumer-price-indices

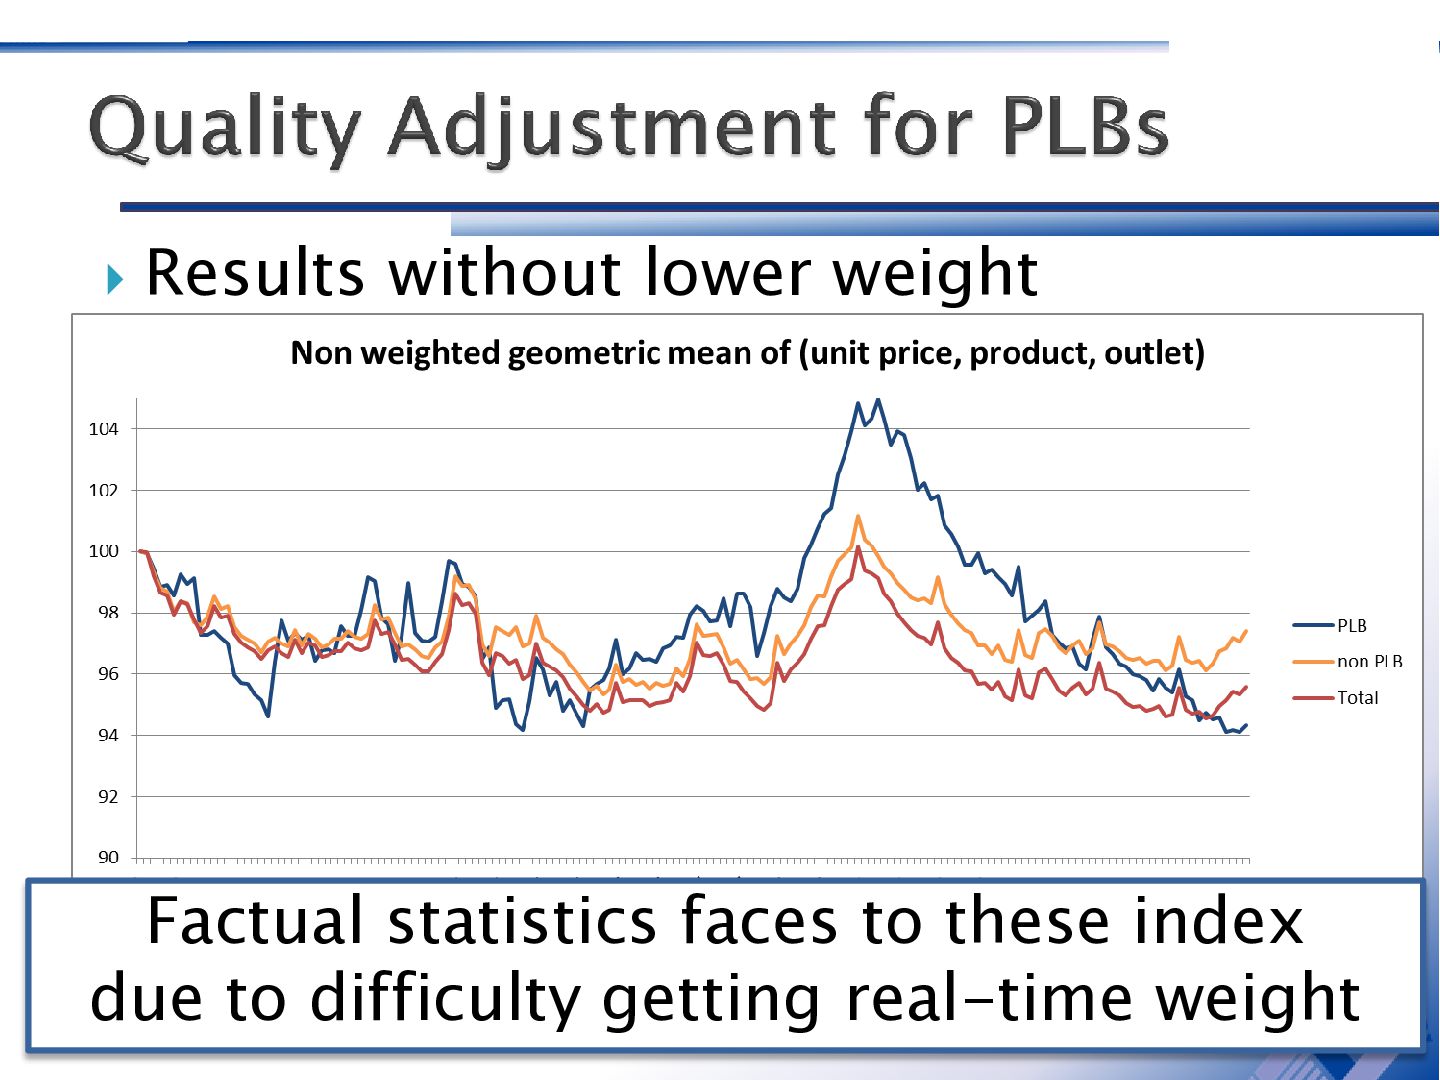
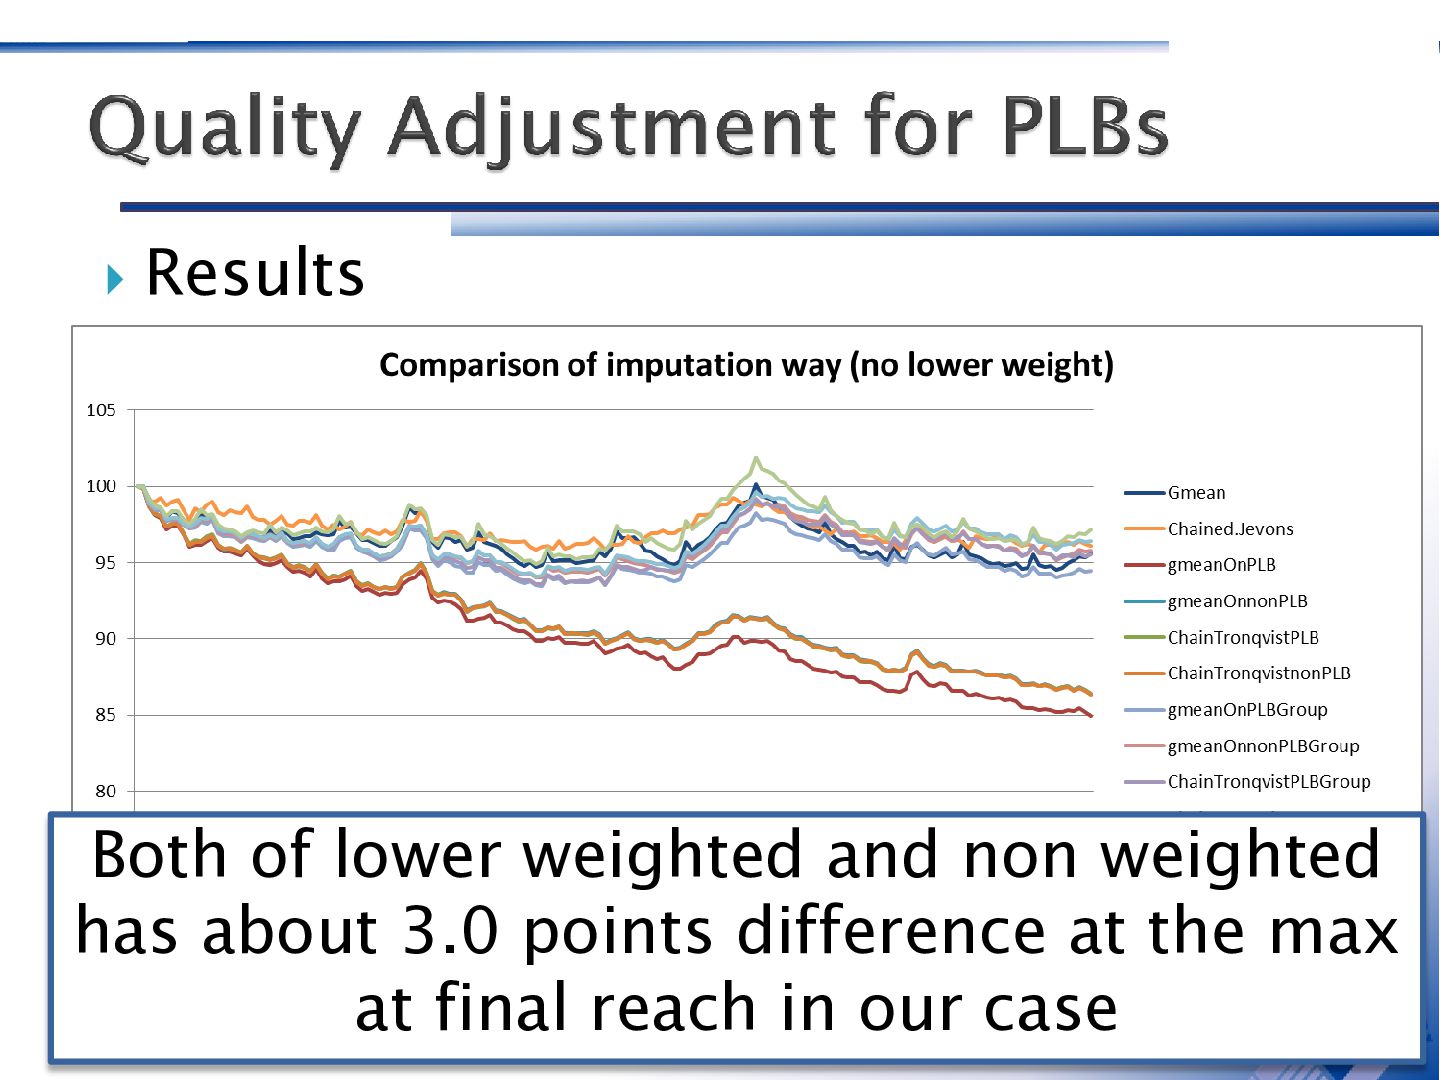
Private Label Brands versus National Brands: Some Implications for the Construction of the CPI. Satoshi Imai, Statistics Bureau of Japan, and Tsutomu Watanabe, University of Tokyo

Avatar for Satoshi Imai

Satoshi Imai

May 26, 2014
Tweet

More Decks by Satoshi Imai

Other Decks in Research

Transcript

  1.  Overview of the paper  Background  Data and

    Identifying PLBs  Aspect of PLB  Substitution effect  Quality Adjustment for PLBs  Conclusion
  2.  Compare private label brands (PLB) and national brands (NB)

    using Japanese scanner data.  Compare these two in terms of the following: (1) the length of product life; (2) the price change over the entire life; (3) the frequency of price adjustment; (4) the average size of price changes; (5) the frequency of temporary sales; (6) the size of sale discounts;
  3.  Examine to what extent different sampling methodologies regarding the

    treatment of PLBs would affect the CPI.  Specifically, we construct the CPI using three different product sampling methodologies: (1) sampling only from NBs; (2) sampling only from PLBs; (3) sampling both from NBs and PLBs.
  4.  We then compare 11 different quality adjustment methods to

    evaluate some lessons about the current practice employed by the Statistic Bureau of Japan regarding the PLBs (1) unit price method (2) subcategorized unit price (3) chained Jevons (4) existing products mean adjustment (4 branches) (5) existing products group adjustment (4 branches)
  5.  Main findings of the paper: ◦ Have PLBs any

    typical aspects?  Life cycle and life cycle price change are not so different  Band of price change is tighter..  Frequency of price change is higher.. ◦ Have PLBs impacts to Japanese CPI?  Yes. Especially substitution effect should be carefully evaluated ◦ What kind of quality adjustment is reasonable?  NB and PLBs should be treat as subcategory  We suggest “Quality adjustment by unit group”
  6.  Index in 2008 indicate the peak due to cost

    increase and downsizing (Imai, Watanabe, 2014) ◦ Also, In lots of categories, major retailers drop PLB products ◦ It seems PLB is going to hold an important place in Japanese market ◦ Can we treat PLBs as same as NBs? • Have PLBs any typical aspects? • Have PLBs impacts to Japanese CPI? • What kind of quality adjustment is reasonable?
  7.  PLBs possibly are surveyed ◦ 66 items (foods and

    drinks) ◦ 9 items (daily needs)  NBs definitely are specified ◦ 36 items (food (not flesh) and drinks) ◦ 25 items (daily needs) ※ Evaluable in scanner data, mainly in food (not flesh), drinks (not alcohol) and daily needs Some Private brand (PB) commodities that conform to the prescribed basic specifications established by considering their representativeness, marketability, continuity and other factors are surveyed. (Q&A about the Retail Price Survey, SBJ)
  8.  If some PLBs comply with basic specifications, ◦ SBJ

    consider those have “same quality” ◦ It means those prices are put into the functions directly (except for unit price adjustment) Some Private brand (PB) commodities that conform to the prescribed basic specifications established by considering their representativeness, marketability, continuity and other factors are surveyed. (Q&A about the Retail Price Survey, SBJ)
  9.  Identifying PLBs ◦ 570 six digit categories evaluable (1,797

    six digit categories in data) Ex) “Snow Brand Hokkaido Butter” 200g 49 03050 15598 9 (JAN) “AEON TopValu Hokkaido Butter” 200g 49 01810 39395 4 (JAN) Country Maker Product Check Products having retailer maker code are PLBs
  10.  570 categories aggregated indicators * This data calculated by

    only products which already exit from the market
  11.  Indicators Variety # of products Life Cycle length (days)

    Duration from the start date of sale to disappear date ΔP (entry - exit) (exit price – entry price) / entry price ΔP (max - min) (max price – min price) / max price ΔP (entry - exit) / Life Cycle length (exit price – entry price) / entry price / Life Cycle length Price change count (per 30 days) Price change count per 30 days Price decline count (per 30 days) Price decline count per 30 days Price change interval (days) Duration from last price change to next change Price decline interval (days) Duration from last price decline to next decline Price change ratio |(new price – last price) / last price| on price change Price decline ratio |(new price – last price) / last price| on price decline
  12.  Life cycle length and life cycle rate of price

    decline are not so different  Price change is more frequent More than two times frequency for sale and price back  Price change band is narrower PLB move within ±10% non PLB move within ±15%
  13.  Price mean change is divided to three factors ∆𝑙𝑛𝑃

    = 𝛼𝑡−1 ∙ ∆𝑙𝑛𝑃𝑃𝐿𝐵 + 1 − 𝛼𝑡−1 ∙ ∆𝑙𝑛𝑃𝑛𝑜𝑛𝑃𝐿𝐵 + 𝛼𝑡 − 𝛼𝑡−1 ∙ 𝑙𝑛𝑃𝑃𝐿𝐵 𝑡 + 𝛼𝑡−1 − 𝛼𝑡 ∙ ∆𝑙𝑛𝑃𝑛𝑜𝑛𝑃𝐿𝐵 𝑡 𝛼: 𝑠ℎ𝑎𝑟𝑒 𝑜𝑓 𝑃𝐿𝐵 PLB factor non PLB factor substitution factor
  14.  Variance ratio for substitution effect Variance ratio mean:0.0573 Variance

    ratio stdev.:0.104 Substitution PLB ⇔ non PLB is not so small
  15.  Time line of substitution effect Substitution effect is important

    as same as Price change of PLBs Consumers move to PLBs
  16.  Points ◦ PLBs’ price level are generally quite different

    from non PLB’s one ◦ Consumers’ transition between PLBs and non PLB should be fetched ◦ There is difference in quality between PLBs and non PLBs To consider COGI PLBs needs proper adjustment
  17.  Points detail ◦ There are two types of PLB

     Same product without brand label ⇒ Its spec is considerable as same with non PLB  Proprietary planed product for Reasonability ⇒ Some spec is depressed to cut cost Second PLBs needs adjustment
  18.  Strategies ◦ Impute mean price  Impute new PLB

    with PLB mean  Impute new PLB with non PLB mean ◦ Impute grouped mean price  Impute with weight/size grouped mean ◦ Intermediate index  Divide PLBs and non PLB to sub category index
  19.  Strategies detail ◦ Impute mean price  Impute mean

    price on existing PLB 𝑃 𝑃𝐿𝐵,𝑡 𝐴𝑑𝑗𝑢𝑠𝑡𝑒𝑑 = 𝑃𝑃𝐿𝐵,𝑡 ∙ 𝑚𝑒𝑎𝑛𝑖𝜖𝑃𝐿𝐵 𝑃𝑡𝑖 𝑃𝑃𝐿𝐵,𝑡  Impute mean price on existing non PLB 𝑃 𝑃𝐿𝐵,𝑡 𝐴𝑑𝑗𝑢𝑠𝑡𝑒𝑑 = 𝑃𝑃𝐿𝐵,𝑡 ∙ 𝑚𝑒𝑎𝑛𝑖𝜖𝑛𝑜𝑛 𝑃𝐿𝐵 𝑃𝑡𝑖 𝑃𝑃𝐿𝐵,𝑡  independently of way for PLB, non PLB products are imputed by own existing mean price
  20.  Strategies detail ◦ Impute grouped mean price  Impute

    types with PLB/non PLB are same  To calculate impute ratio, use same weight/size group’s existing mean If new PLB has 400g weight 𝑃 𝑃𝐿𝐵,𝑡 𝐺.𝐴𝑑𝑗𝑢𝑠𝑡𝑒𝑑 = 𝑃𝑃𝐿𝐵,𝑡 ∙ 𝑚𝑒𝑎𝑛𝑖𝜖𝑃𝐿𝐵,𝐺𝑟𝑜𝑢𝑝400𝑔 𝑃𝑡𝑖 𝑃𝑃𝐿𝐵,𝑡 Use mean price with same weight group If no same group exists on t, Liner adjusted mean price with group having most product variation 𝑃 𝑃𝐿𝐵,𝑡 𝐴𝑑𝑗𝑢𝑠𝑡𝑒𝑑 = 𝑃𝑃𝐿𝐵,𝑡 ∙ 𝑚𝑒𝑎𝑛𝑖𝜖𝑃𝐿𝐵,𝐺𝑟𝑜𝑢𝑝350𝑔 𝑃𝑡𝑖 ∙ 400 350 𝑃𝑃𝐿𝐵,𝑡
  21.  Strategies detail ◦ Intermediate index  PLB and non

    PLB as subcategory index  Aggregate PLB index and non PLB index to its category level index with amount of sale share
  22.  6 digits category index ◦ Weighted geometric mean of

    (unit price, quantity) ◦ Laspeyres index based on 01.2000 ◦ Chained Jevons index ◦ Chained Tronqvist index  Element as PLB index and non PLB index with amount of sale share  Upper level aggregate ◦ Aggregate with annual amount of share weight in 2000
  23.  Results with lower weight Using non grouped mean fails

    Using grouped mean and intermediate follows chained Jevons
  24.  Results without lower weight Factual statistics faces to these

    index due to difficulty getting real-time weight
  25.  Results Both of lower weighted and non weighted has

    about 3.0 points difference at the max at final reach in our case
  26.  Findings PLBs have tricky aspects ◦ Have PLBs any

    typical aspects?  Life cycle and life cycle price change are not so different  Band of price change is tighter; PLB move within ±10% non PLB move within ±15%  Frequency of price change is higher; More than two times frequency for sale and price back ◦ Have PLBs impacts to Japanese CPI?  Some consumers move to cheep PLBs. Especially substitution effect should be carefully evaluated Its means how PLBs get market share and how PLBs are different from non PLBs on quality are imprtant ◦ What kind of quality adjustment is reasonable?  NB and PLBs should be treat as subcategory  We suggest “Quality adjustment by unit group”
  27.  We face to needs getting real-time weight much more

    before ◦ Except for grouped mean method, we need real-time weight ◦ Without information how PLBs hold share in the market, we can get only imperfect price change ◦ PLBs is going to be typical property which needs proper quality adjustment way