2014 Christopher G. Healey Department of Computer Science North Carolina State University [email protected] http://www.csc.ncsu.edu/faculty/healey NC STATE UNIVERSITY sic parvis magna
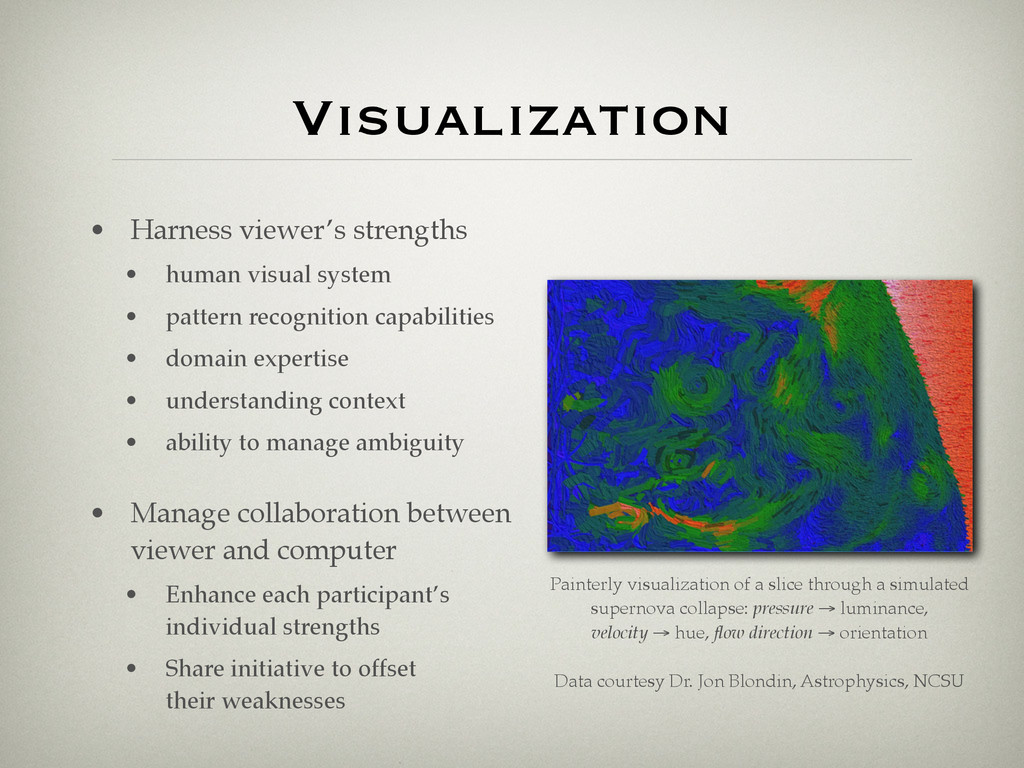
pattern recognition capabilities! • domain expertise! • understanding context! • ability to manage ambiguity! • Manage collaboration between viewer and computer! • Enhance each participant’s individual strengths! • Share initiative to offset their weaknesses Painterly visualization of a slice through a simulated! supernova collapse: pressure → luminance,! velocity → hue, flow direction → orientation! ! Data courtesy Dr. Jon Blondin, Astrophysics, NCSU
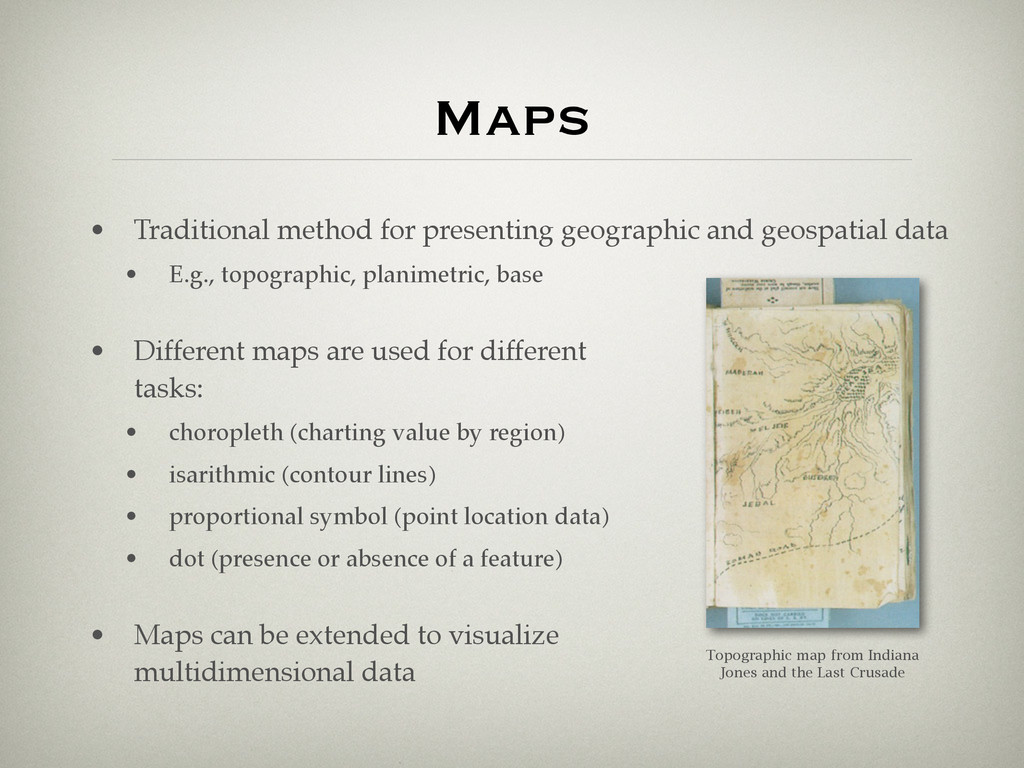
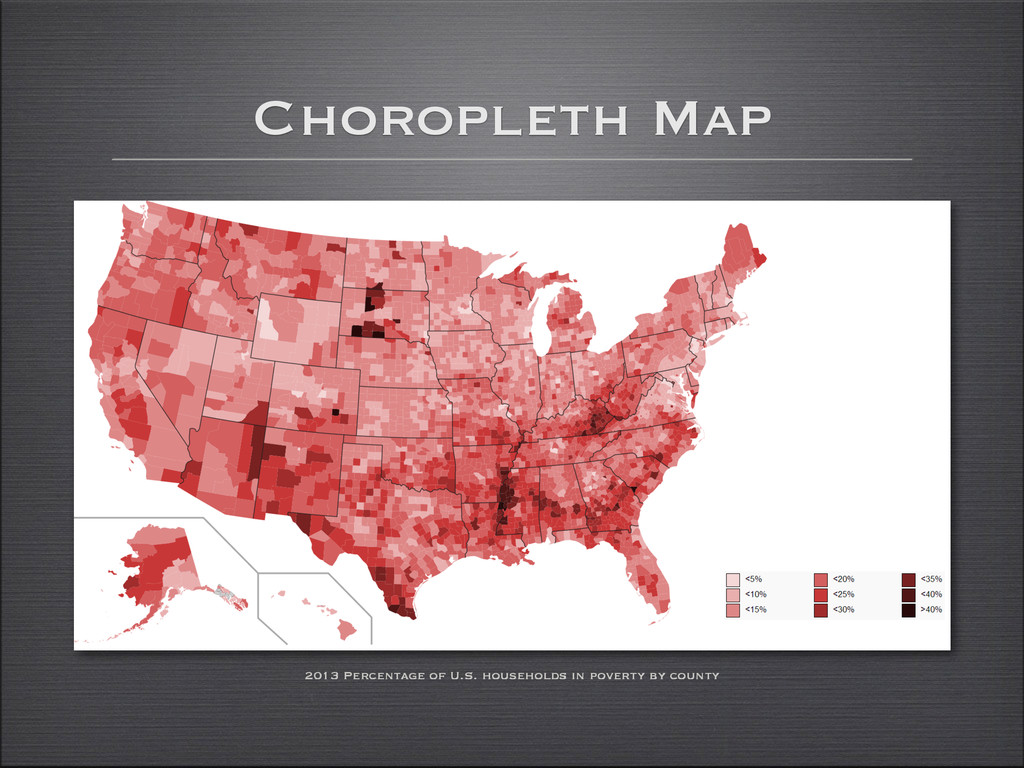
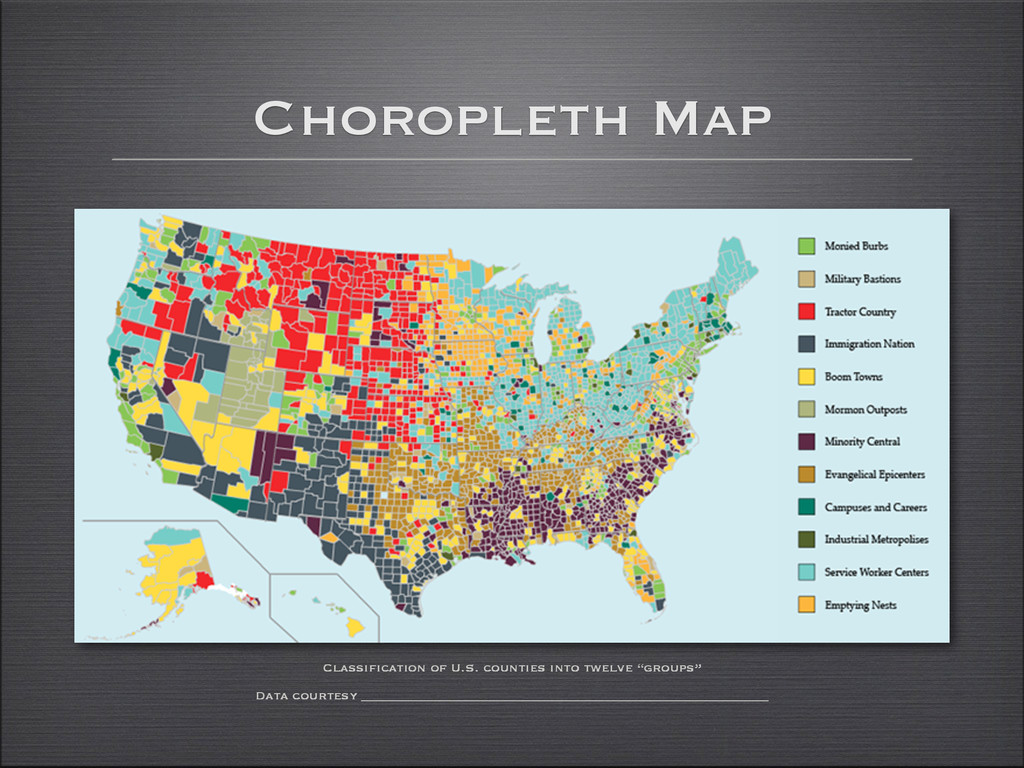
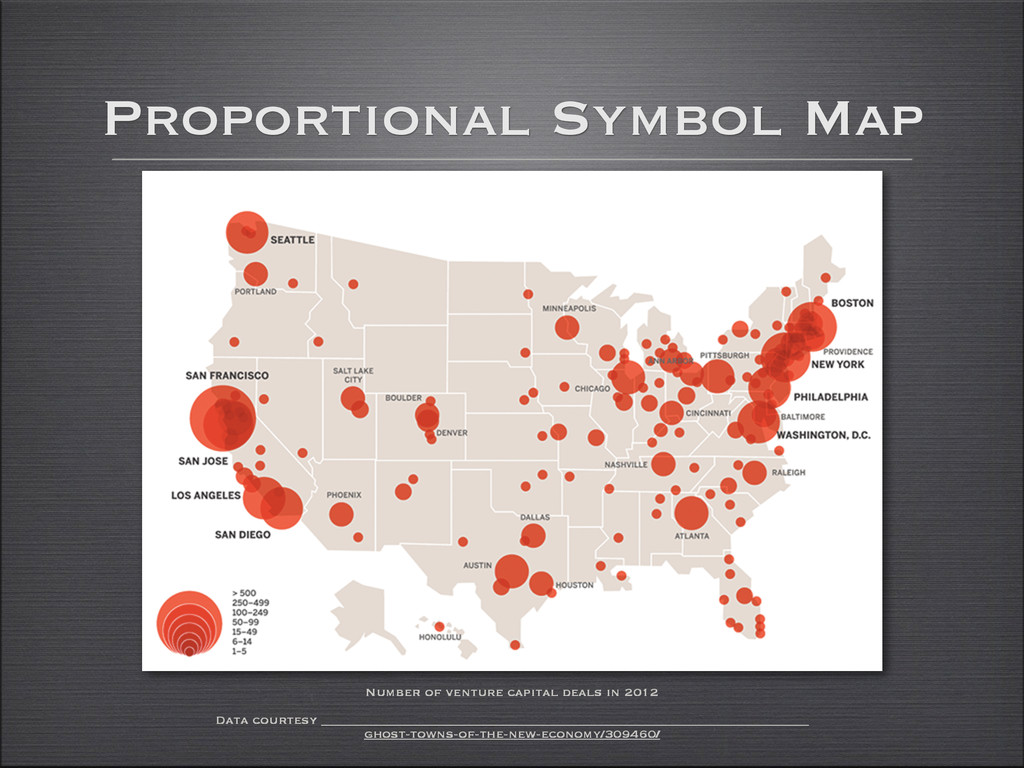
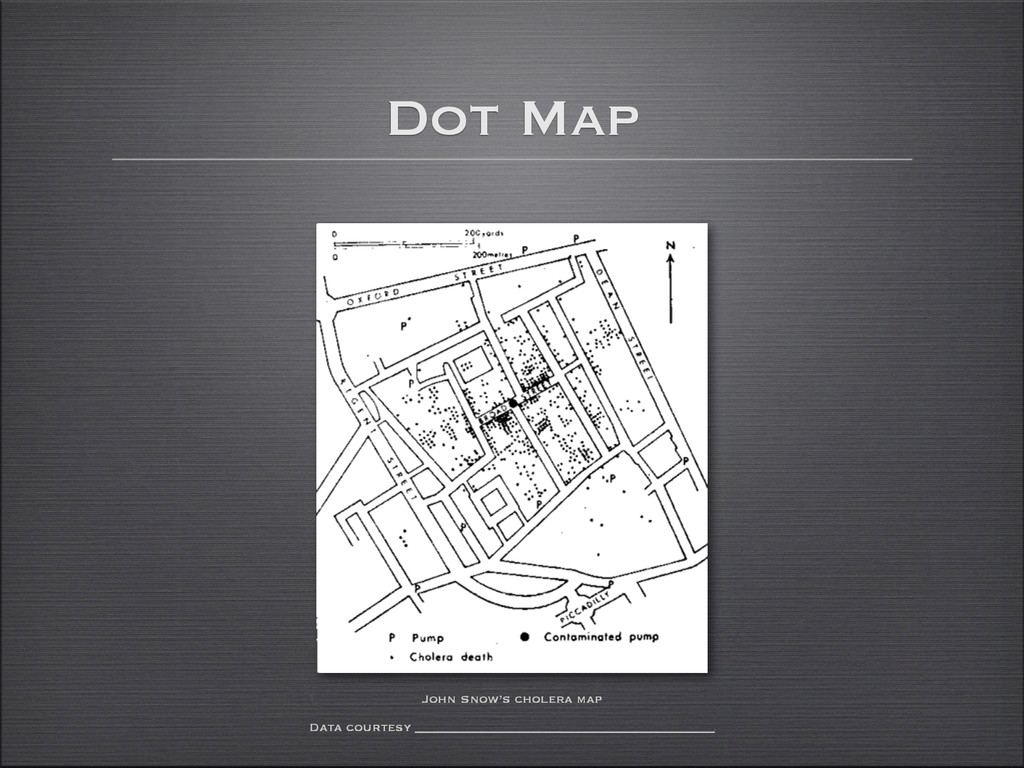
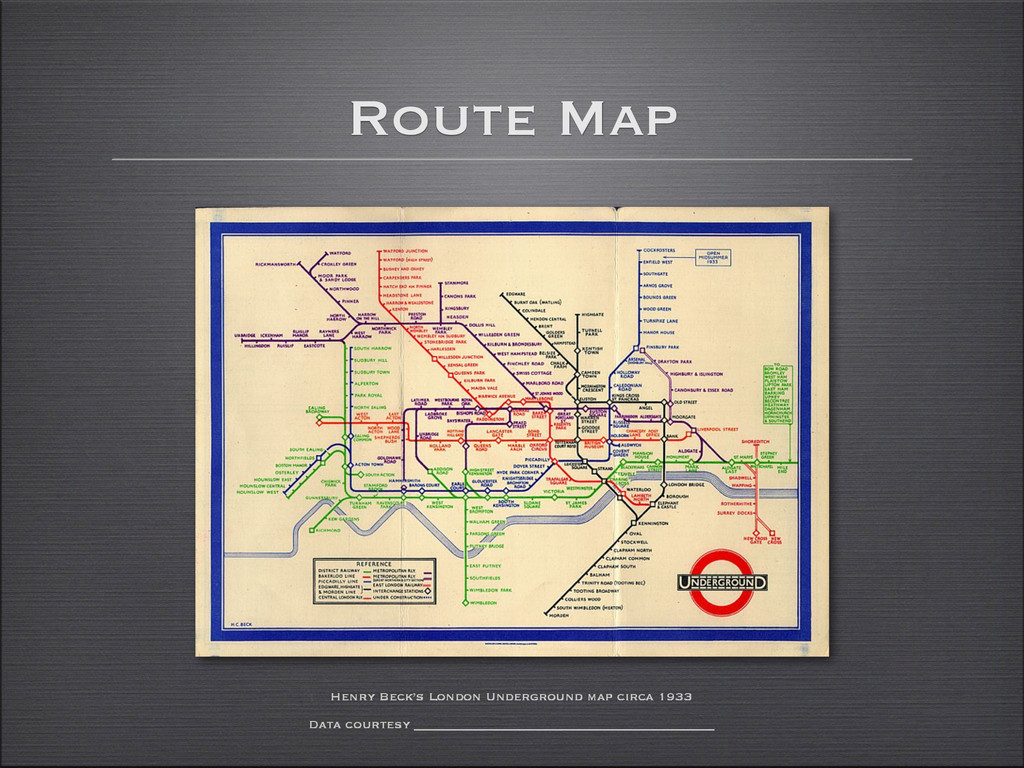
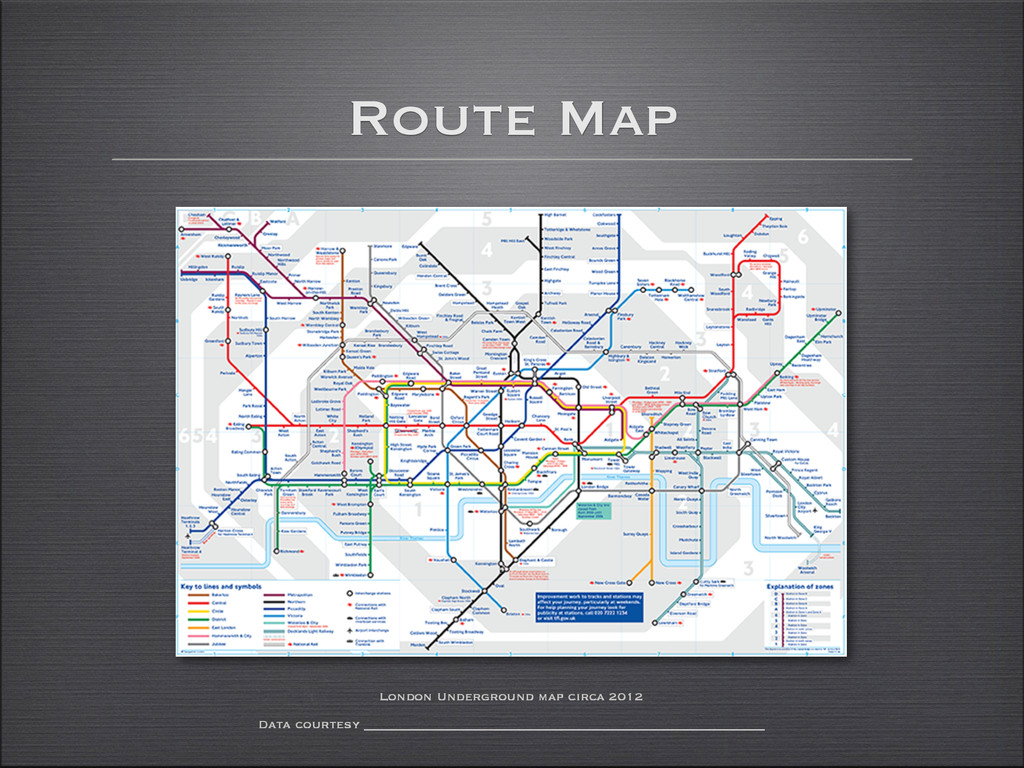
• E.g., topographic, planimetric, base • Different maps are used for different tasks:! • choropleth (charting value by region)! • isarithmic (contour lines)! • proportional symbol (point location data)! • dot (presence or absence of a feature) • Maps can be extended to visualize multidimensional data Topographic map from Indiana Jones and the Last Crusade
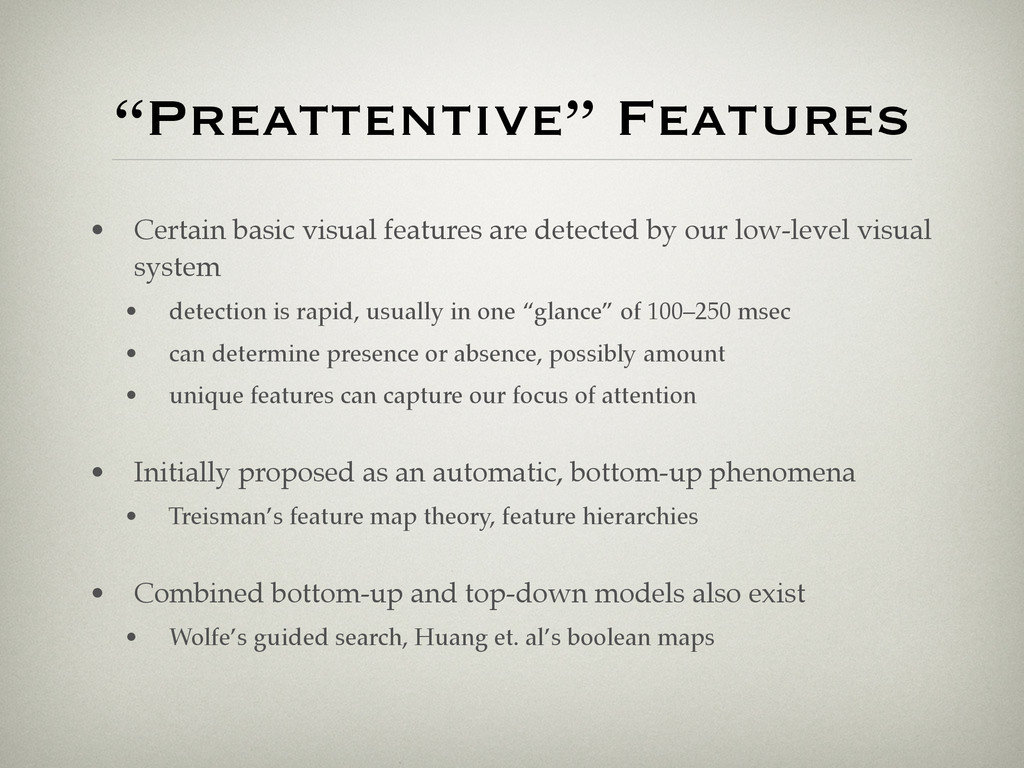
our low-level visual system! • detection is rapid, usually in one “glance” of 100–250 msec! • can determine presence or absence, possibly amount! • unique features can capture our focus of attention • Initially proposed as an automatic, bottom-up phenomena! • Treisman’s feature map theory, feature hierarchies • Combined bottom-up and top-down models also exist! • Wolfe’s guided search, Huang et. al’s boolean maps
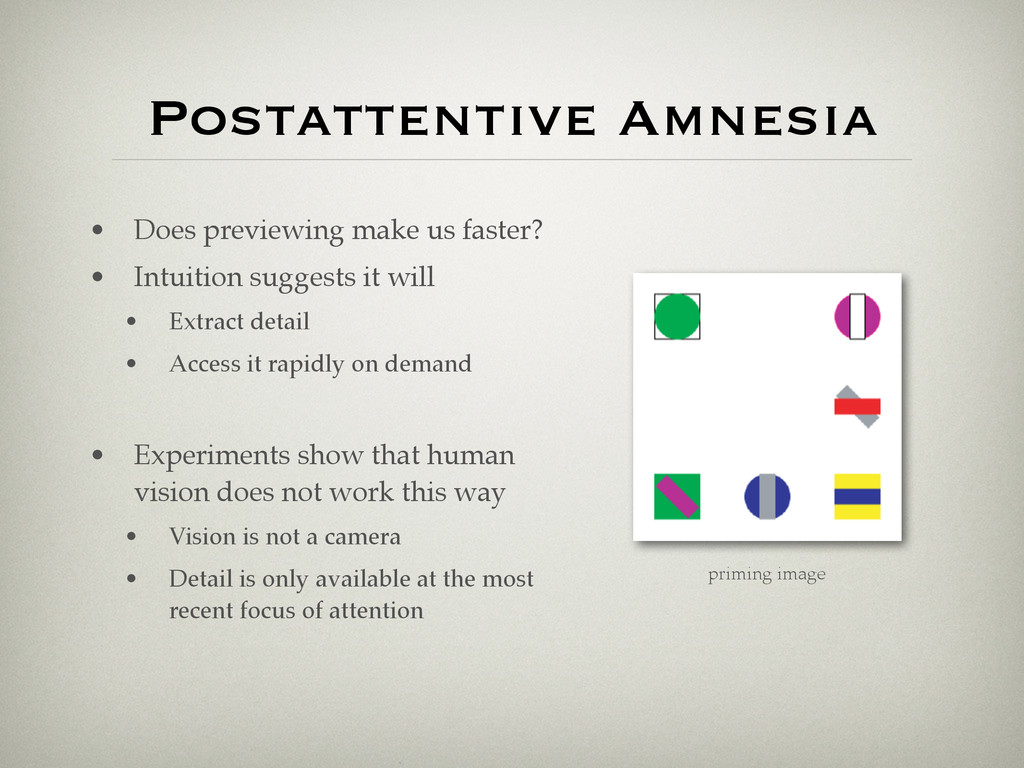
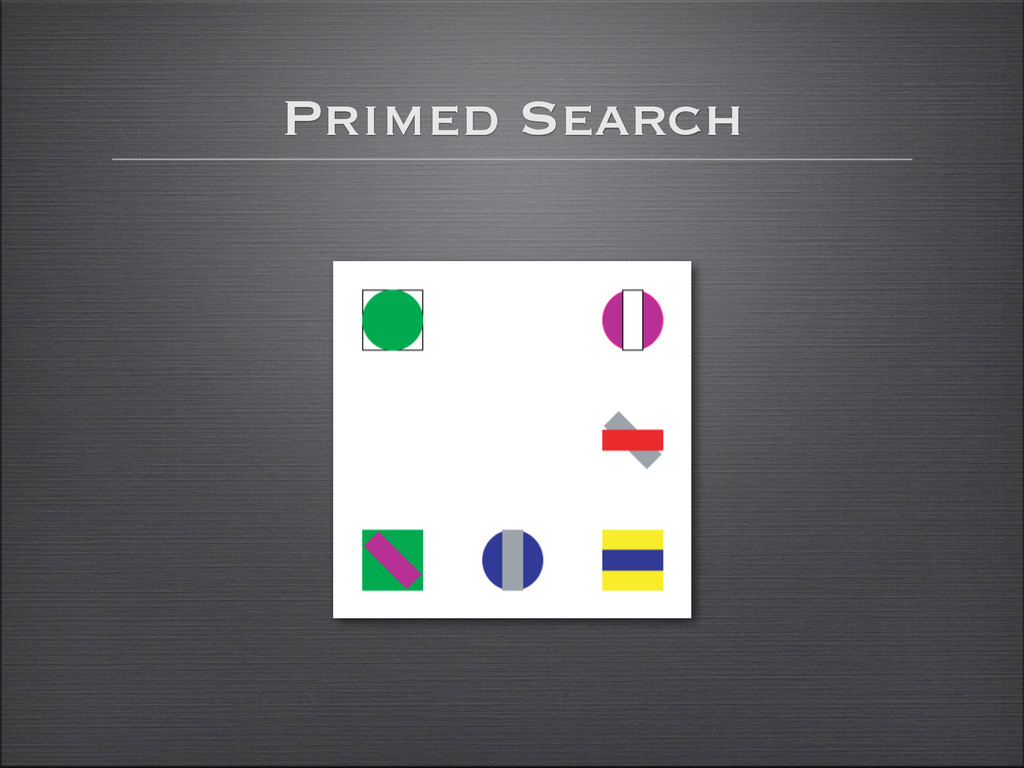
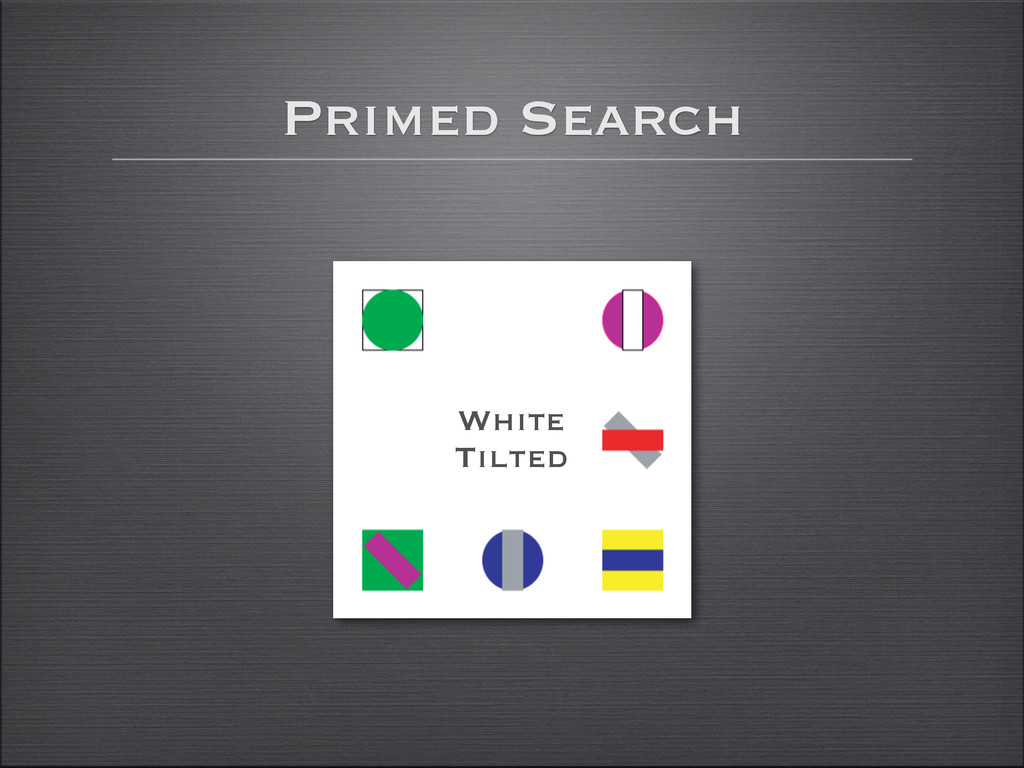
suggests it will! • Extract detail! • Access it rapidly on demand! ! • Experiments show that human vision does not work this way! • Vision is not a camera! • Detail is only available at the most recent focus of attention priming image
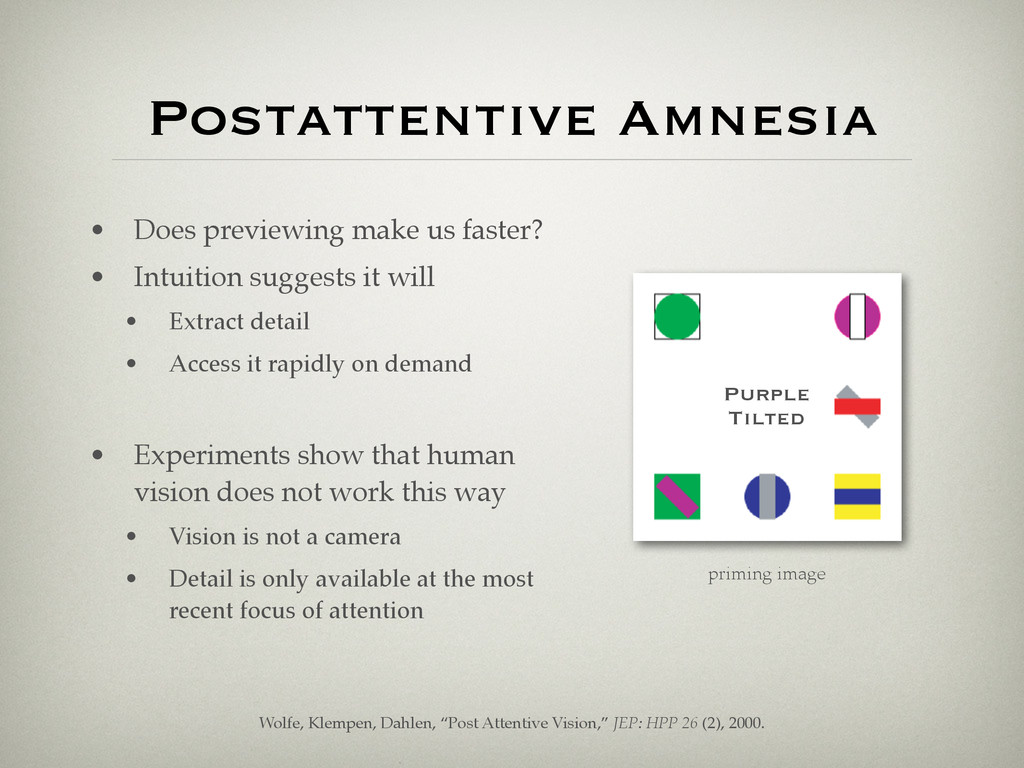
suggests it will! • Extract detail! • Access it rapidly on demand! ! • Experiments show that human vision does not work this way! • Vision is not a camera! • Detail is only available at the most recent focus of attention priming image Purple Tilted Wolfe, Klempen, Dahlen, “Post Attentive Vision,” JEP: HPP 26 (2), 2000.
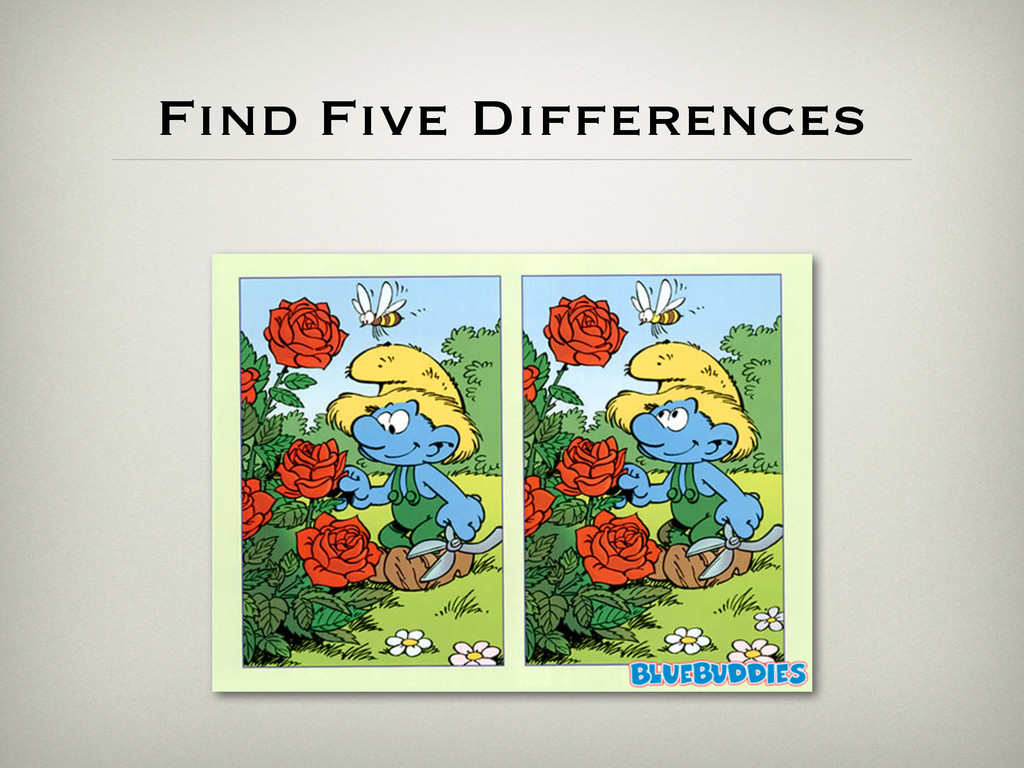
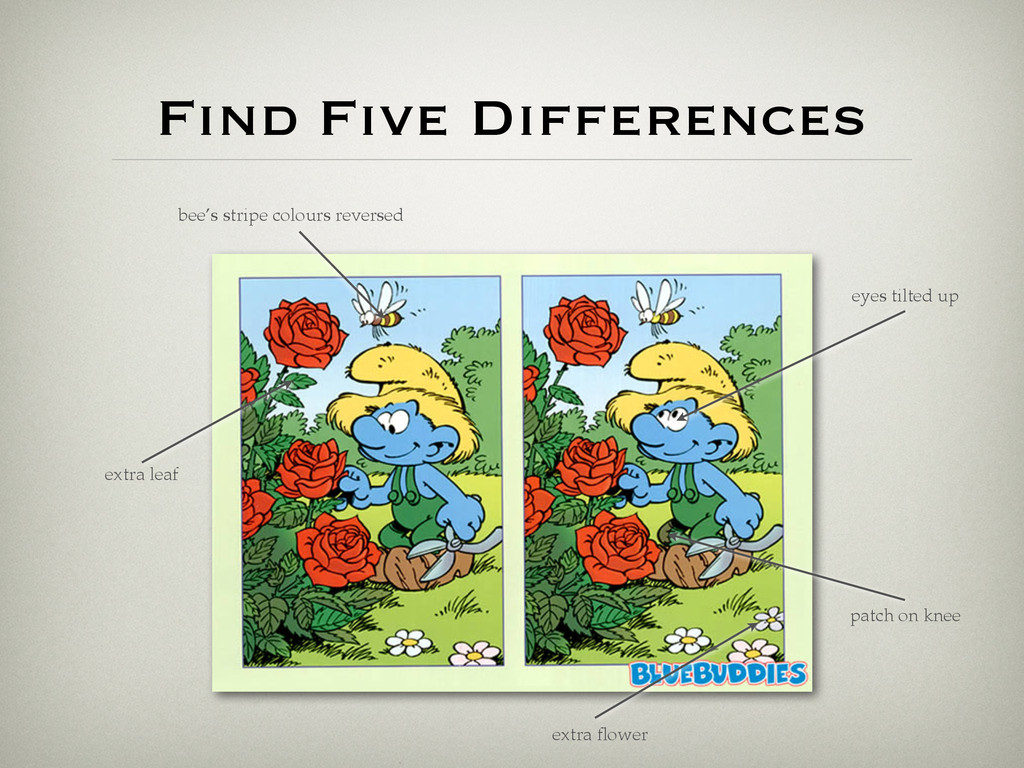
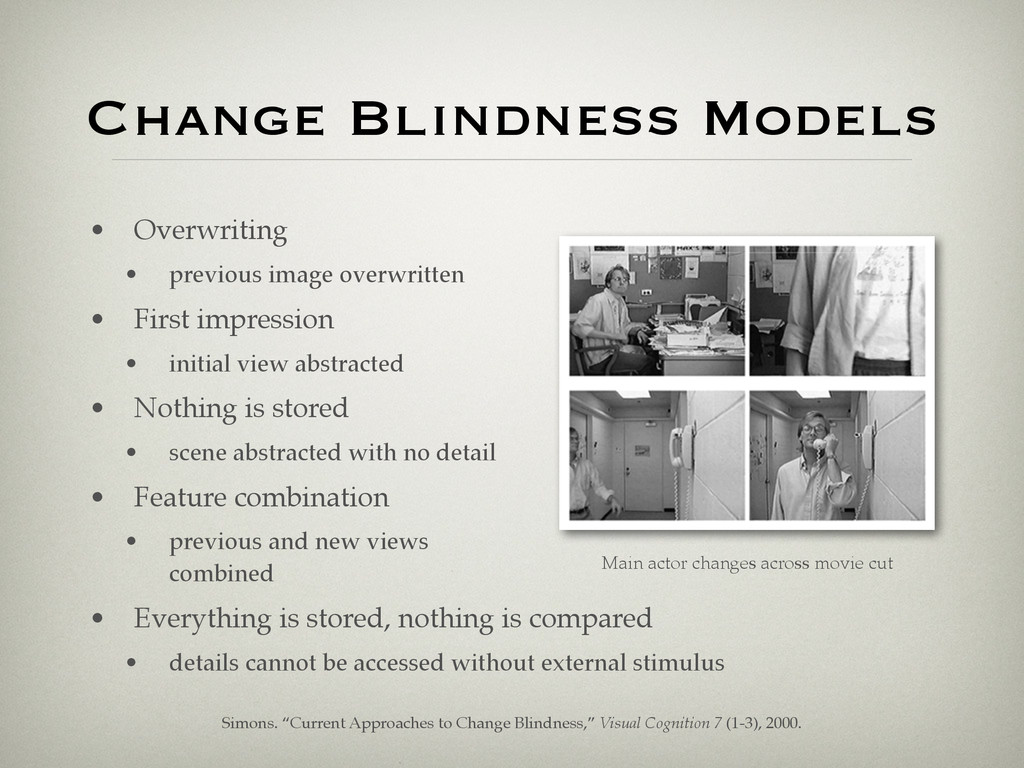
First impression! • initial view abstracted! • Nothing is stored! • scene abstracted with no detail! • Feature combination! • previous and new views combined! • Everything is stored, nothing is compared! • details cannot be accessed without external stimulus Main actor changes across movie cut Simons. “Current Approaches to Change Blindness,” Visual Cognition 7 (1-3), 2000.
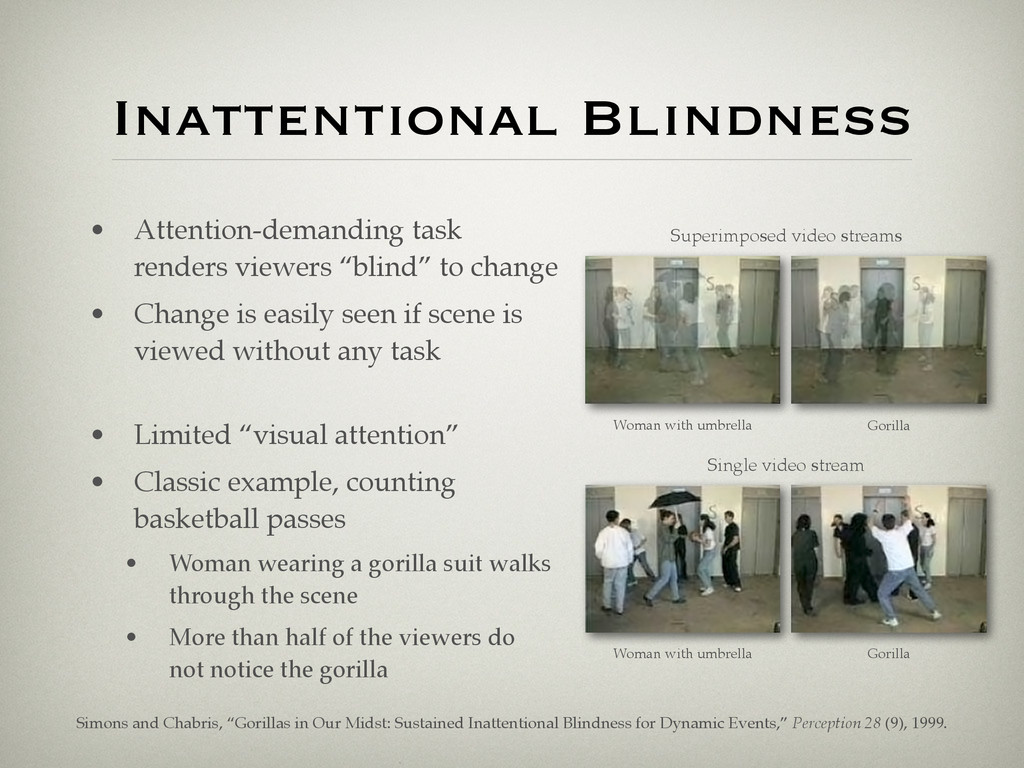
• Change is easily seen if scene is viewed without any task • Limited “visual attention”! • Classic example, counting basketball passes! • Woman wearing a gorilla suit walks through the scene! • More than half of the viewers do not notice the gorilla Superimposed video streams Single video stream Woman with umbrella Woman with umbrella Gorilla Gorilla Simons and Chabris, “Gorillas in Our Midst: Sustained Inattentional Blindness for Dynamic Events,” Perception 28 (9), 1999.
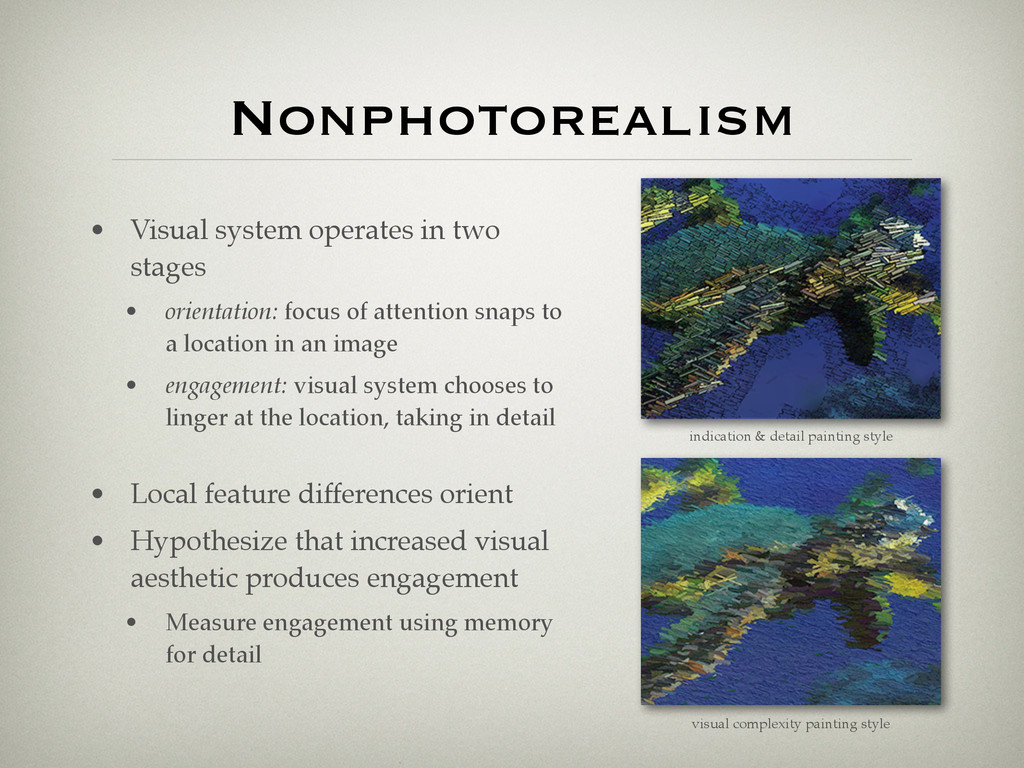
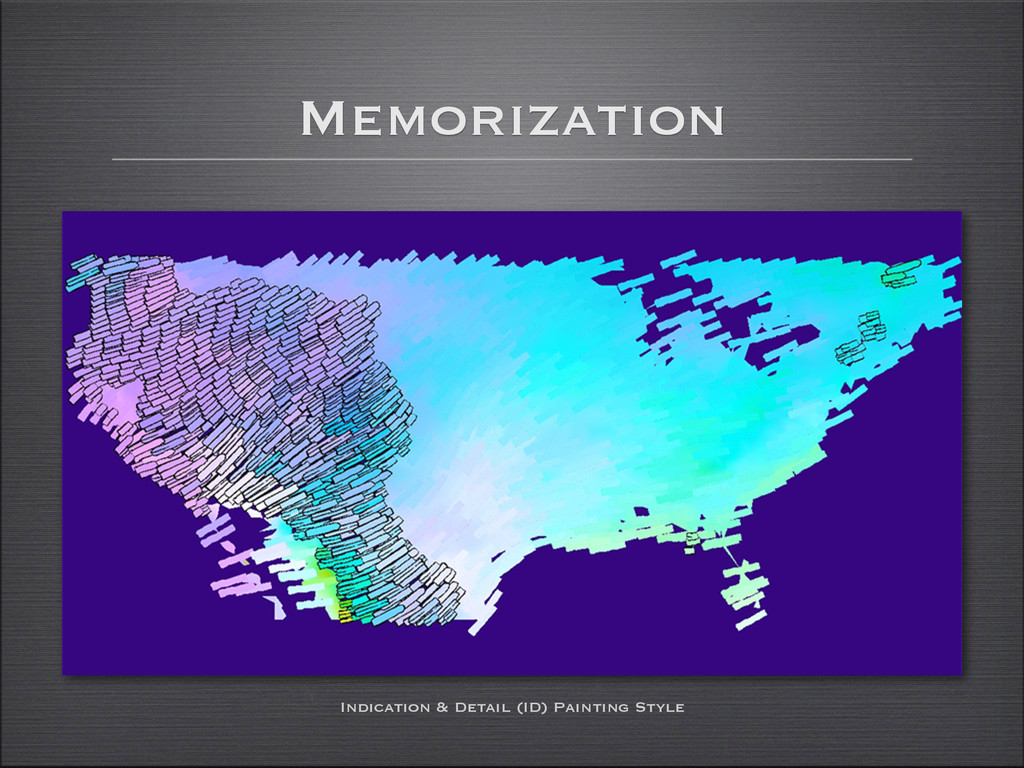
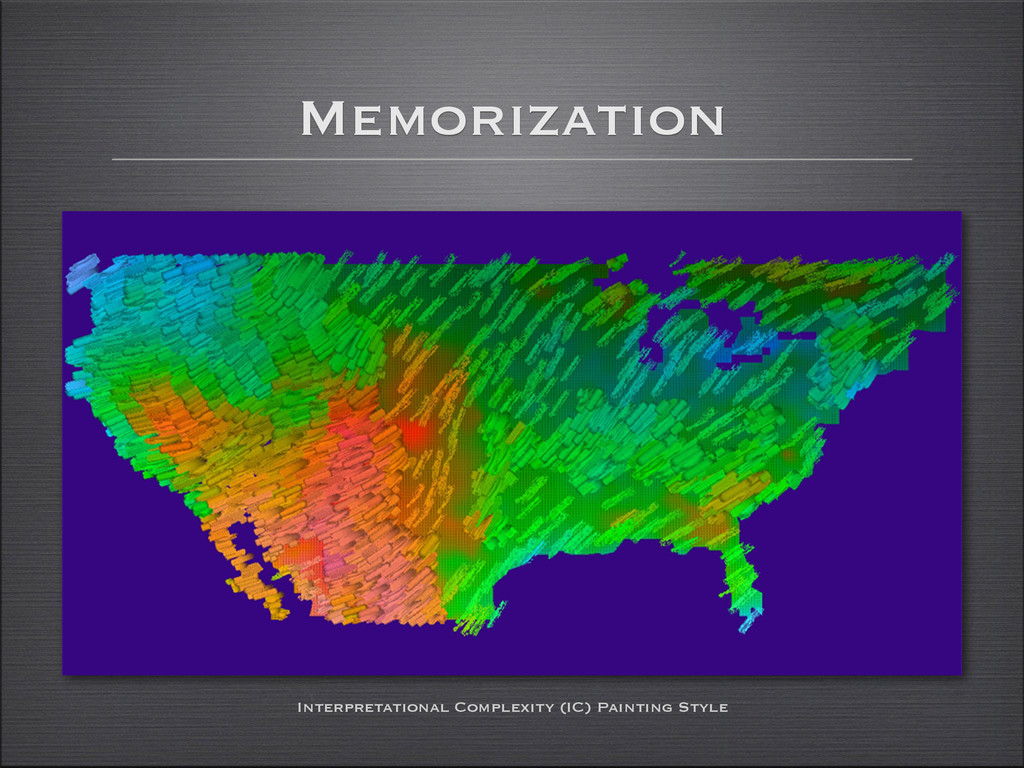
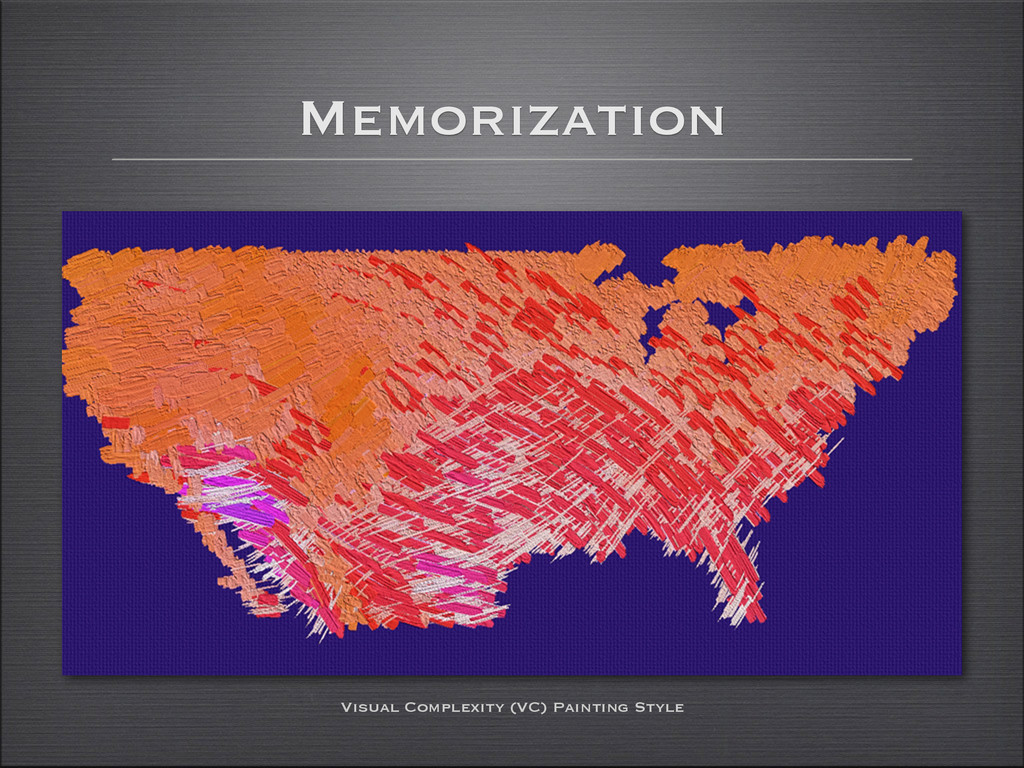
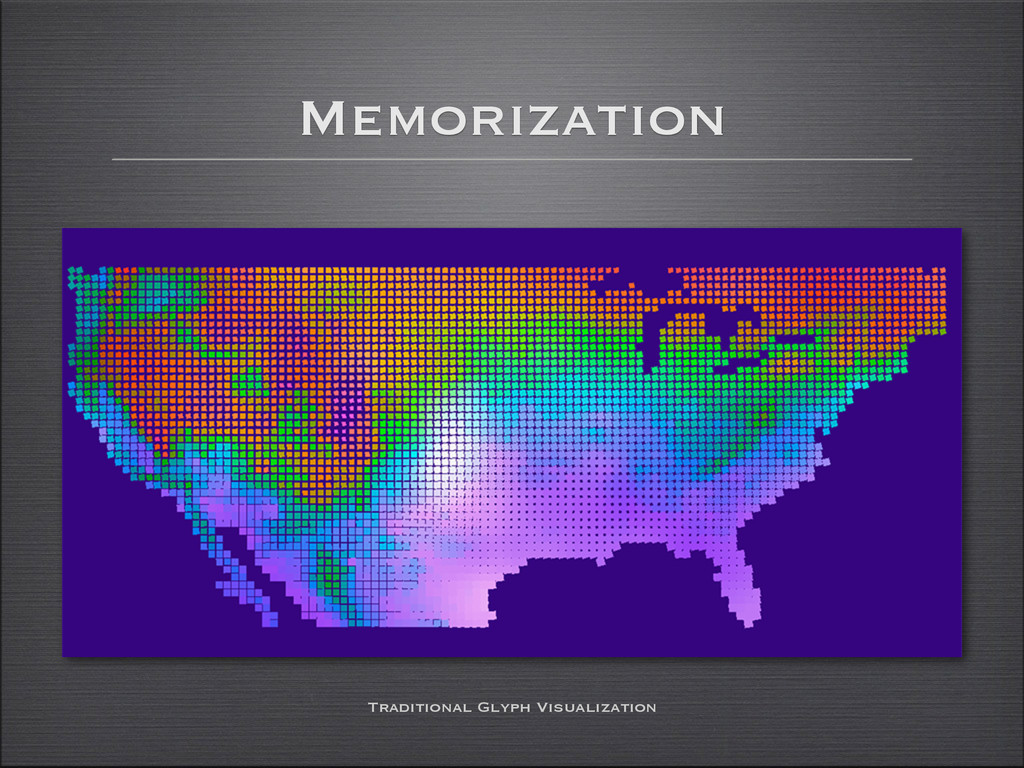
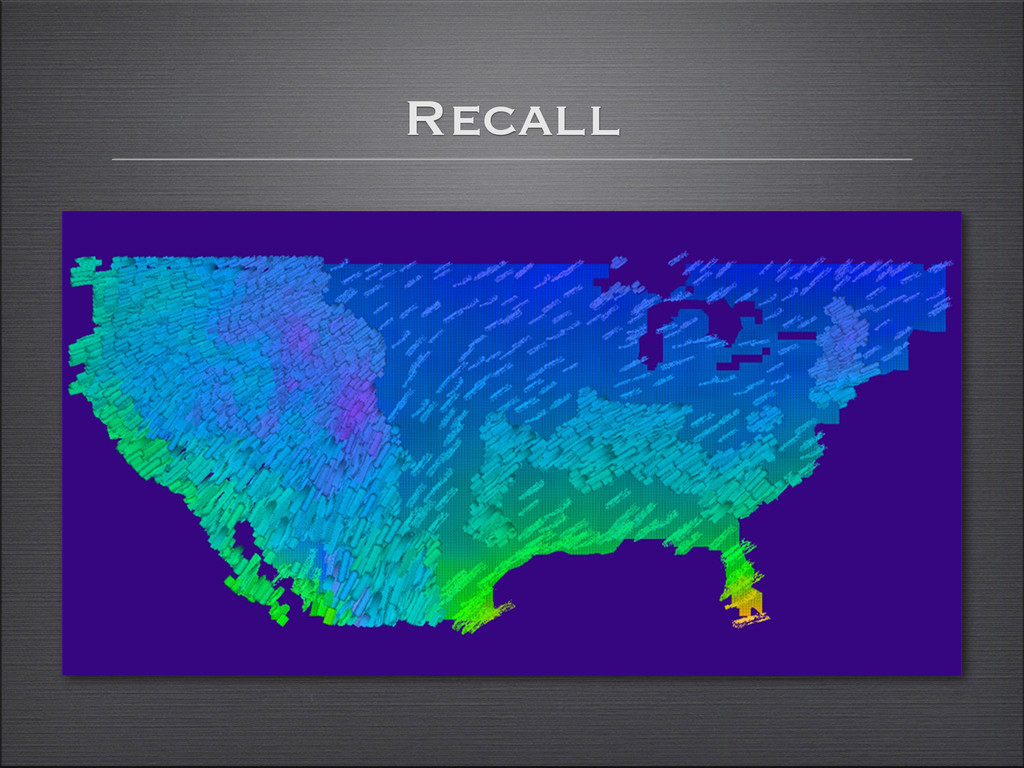
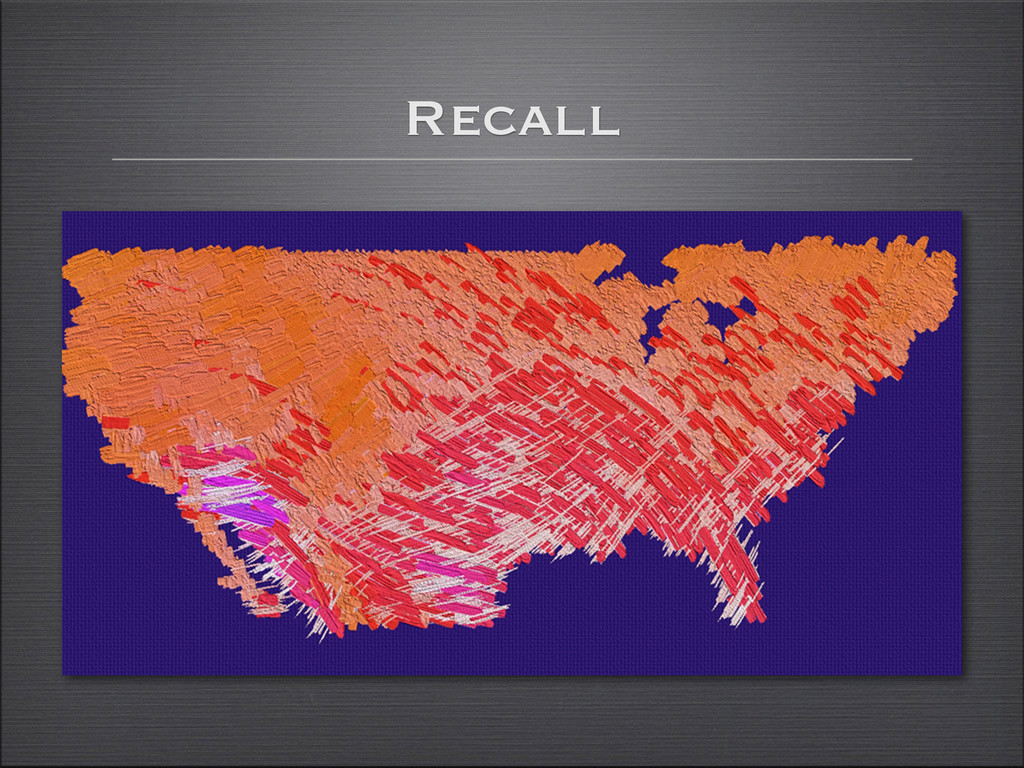
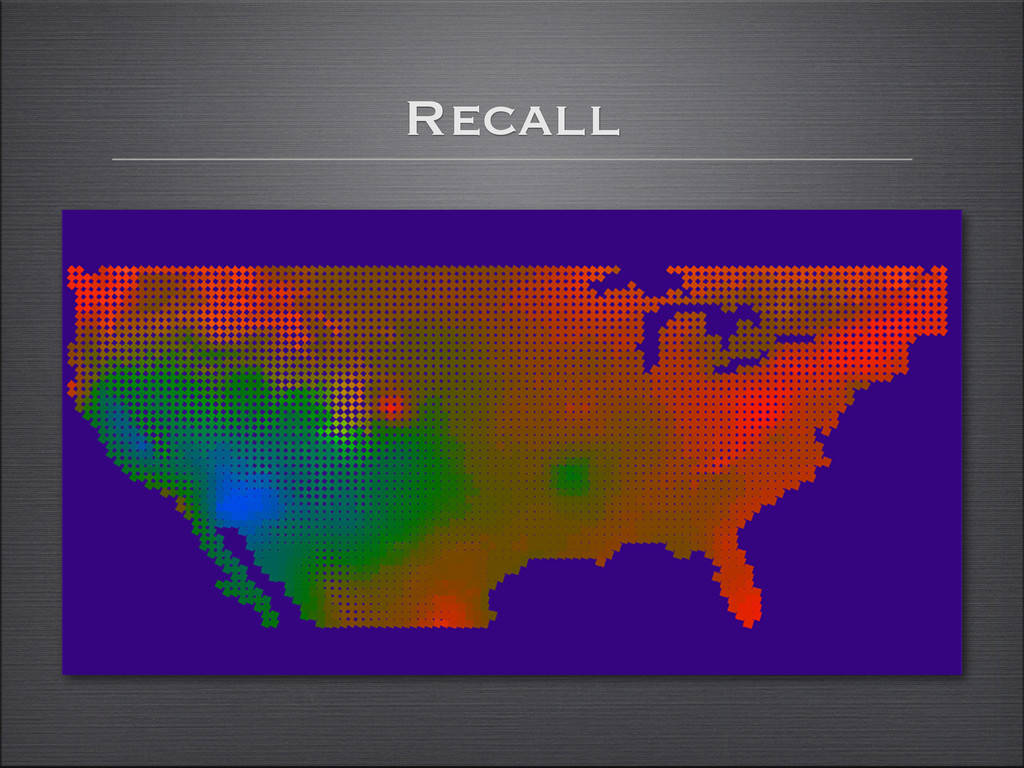
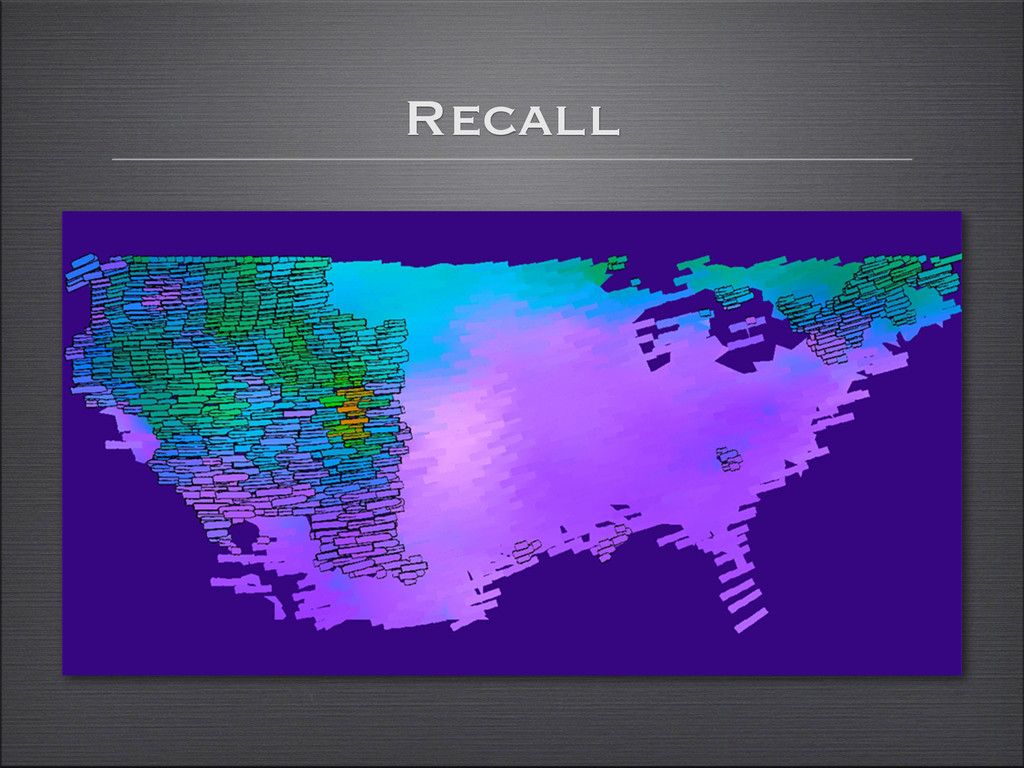
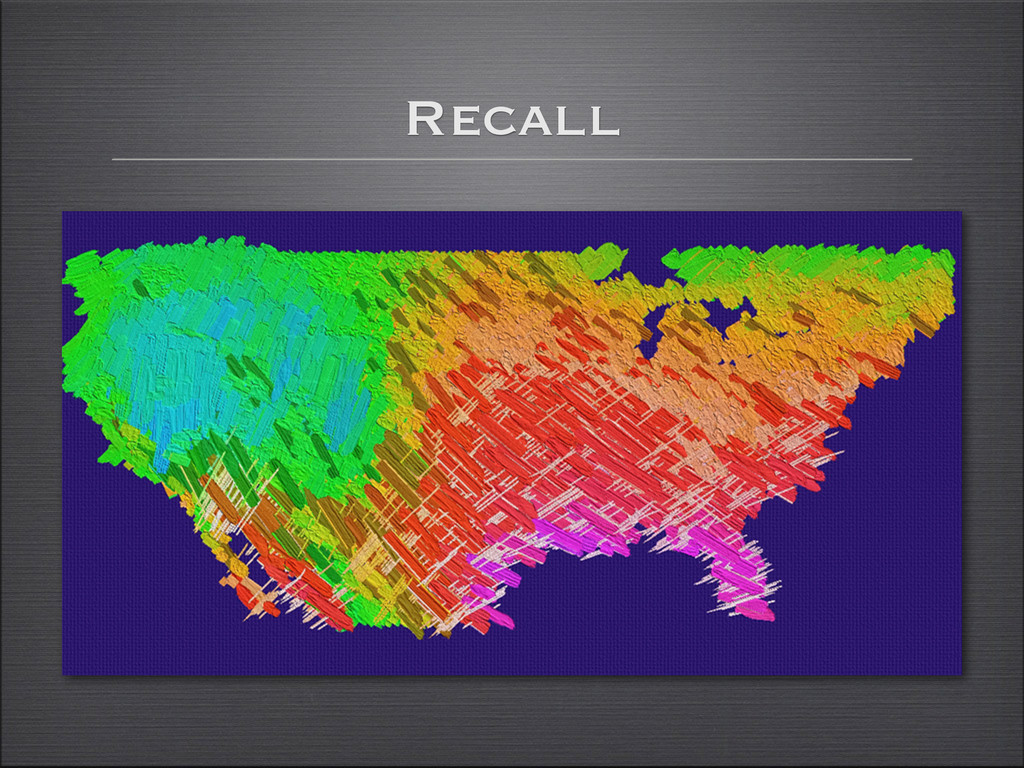
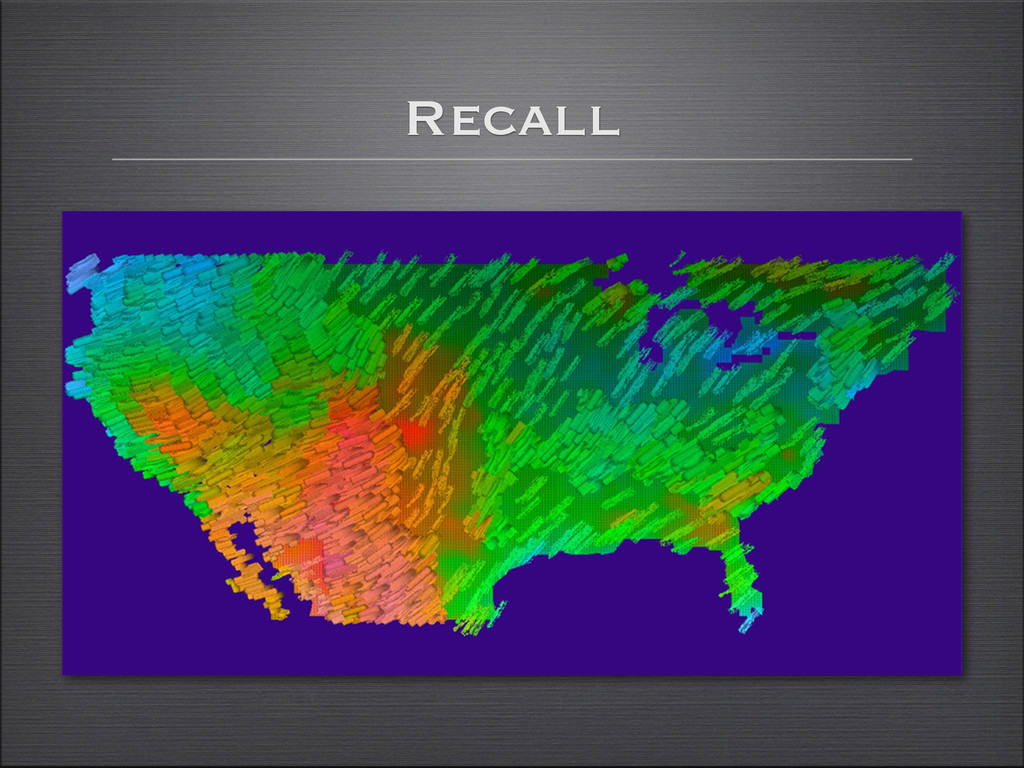
focus of attention snaps to a location in an image! • engagement: visual system chooses to linger at the location, taking in detail • Local feature differences orient! • Hypothesize that increased visual aesthetic produces engagement! • Measure engagement using memory for detail indication & detail painting style visual complexity painting style
visualization! ! • Increasing aesthetic improves memory for detail! • Viewers had recall accuracy of 80% or more, even 24 hours after exposure! ! • Accuracy for most aesthetic visualization no better than for traditional visualization! • Traditional visualizations are seen as aesthetic?! • More detailed models of engagement needed?! • Memory for detail is not an appropriate measure of engagement?
Special Thanks to: John Blondin (Astrophysics, NCSU) James Enns (Psychology, UBC) Ron Rensink (CS & Psychology, UBC) ! Geniva Liu, Mark Remple, Amit Sawant, Laura Tateosian
![Contact Information NC STATE UNIVERSITY [email protected] http://www.csc.ncsu.edu/faculty/healey ! !](https://files.speakerdeck.com/presentations/307ccaa0f3310131c21c4ebdb70fd364/slide_69.jpg)