experts This presentation is designed to be accessible to anyone interested in dataviz. You'll learn the basics, discover some tools and hopefully learn something new, whatever your level of expertise. Sharing Impressions I've become more and more interested in graph visualization, and wanted to share my impressions about what makes it a difficult (but very interesting) data visualization topic.
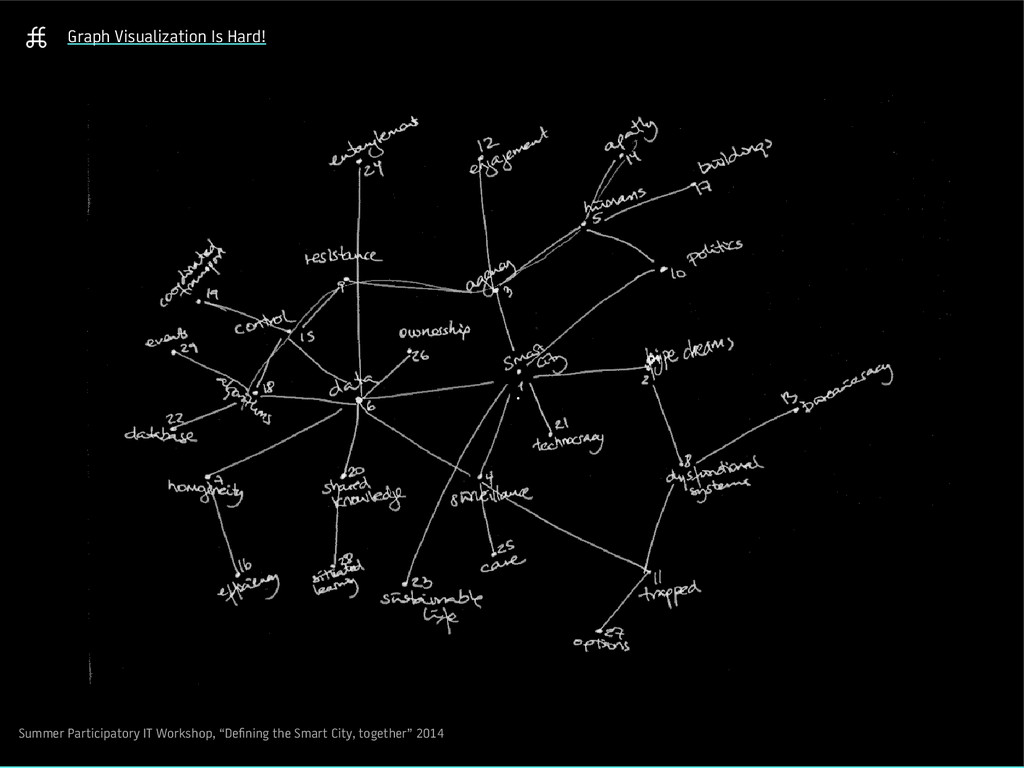
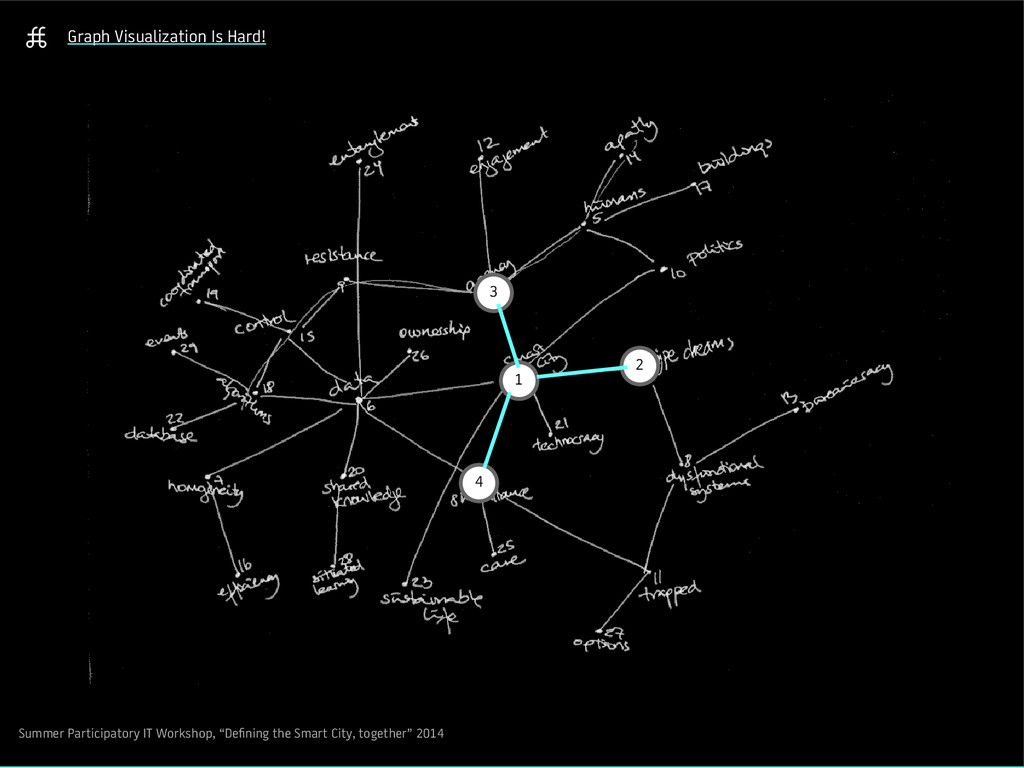
a workshop in August 2014, where participants were invited to collectively create concept maps on the theme of “Smart City”. Using a simple methodology, the resulting hand- drawn maps can be converted to CSV files and later visualized. Experimenting with these relatively small datasets reminded me of how challenging graph visualization can be!
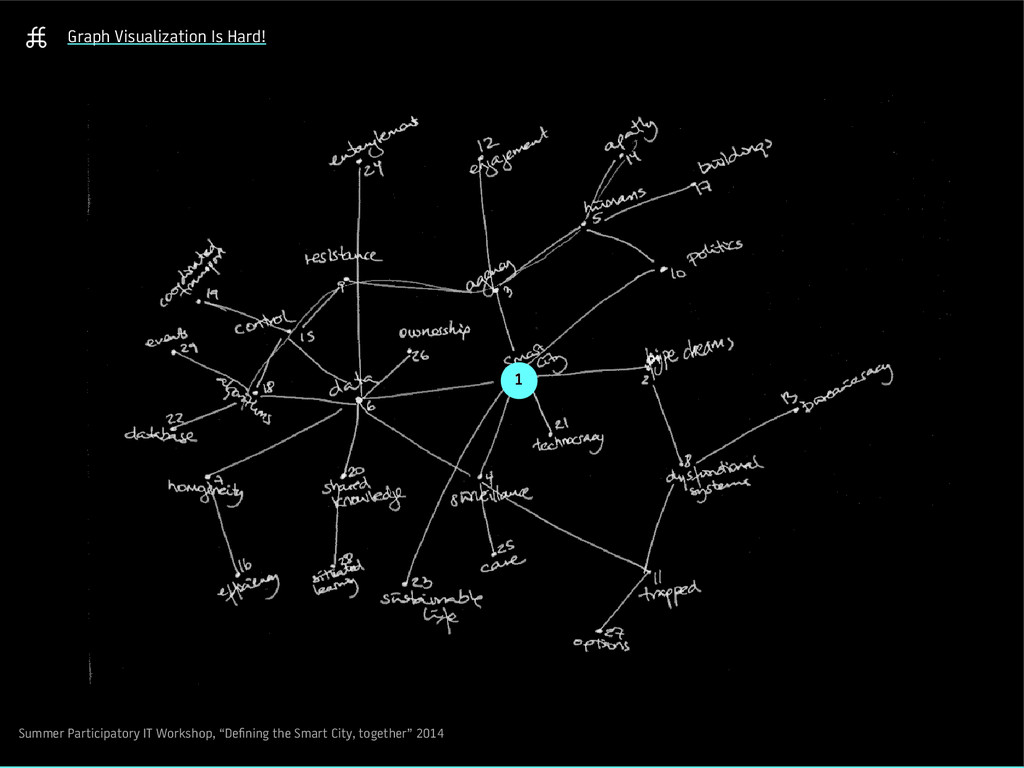
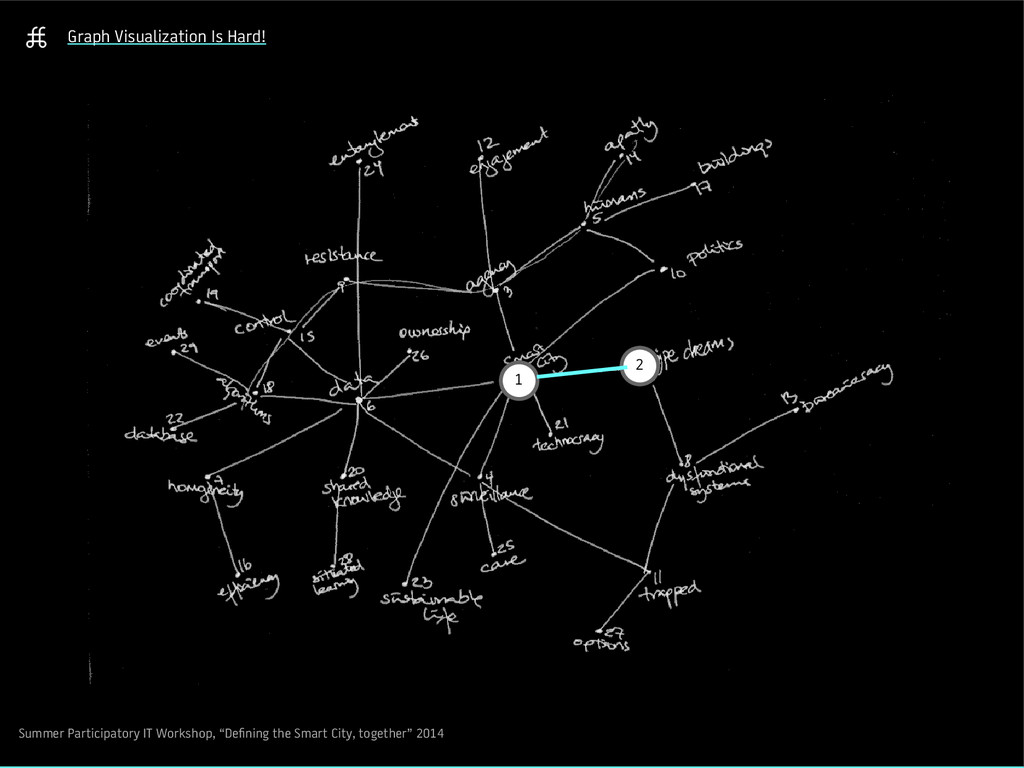
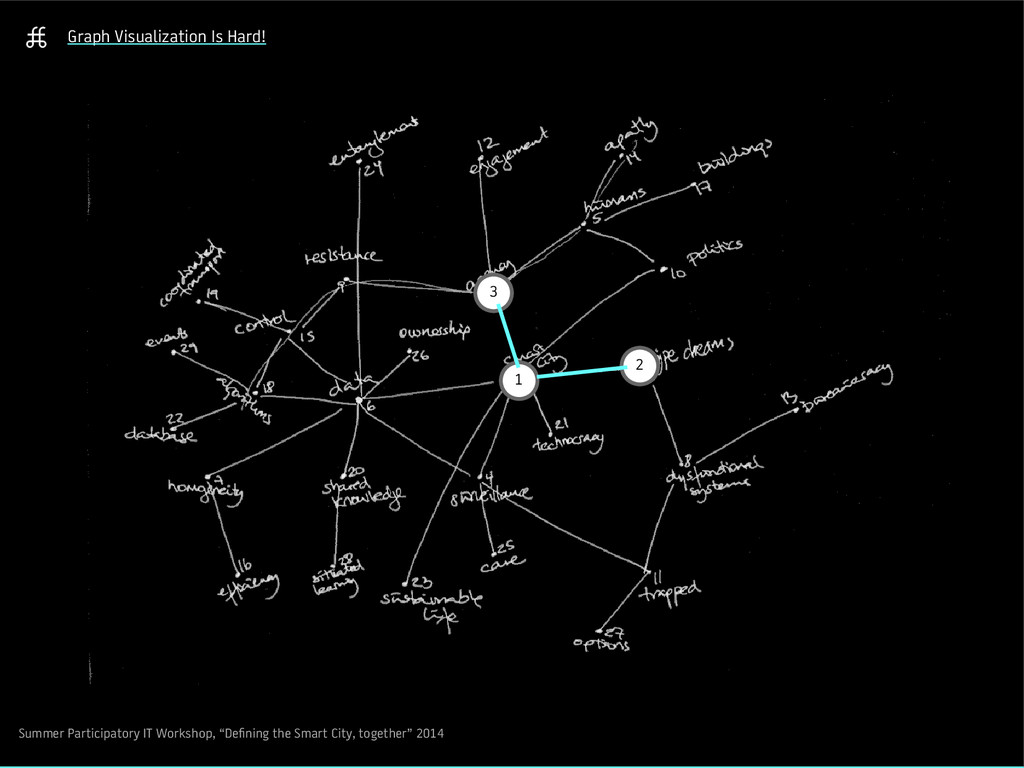
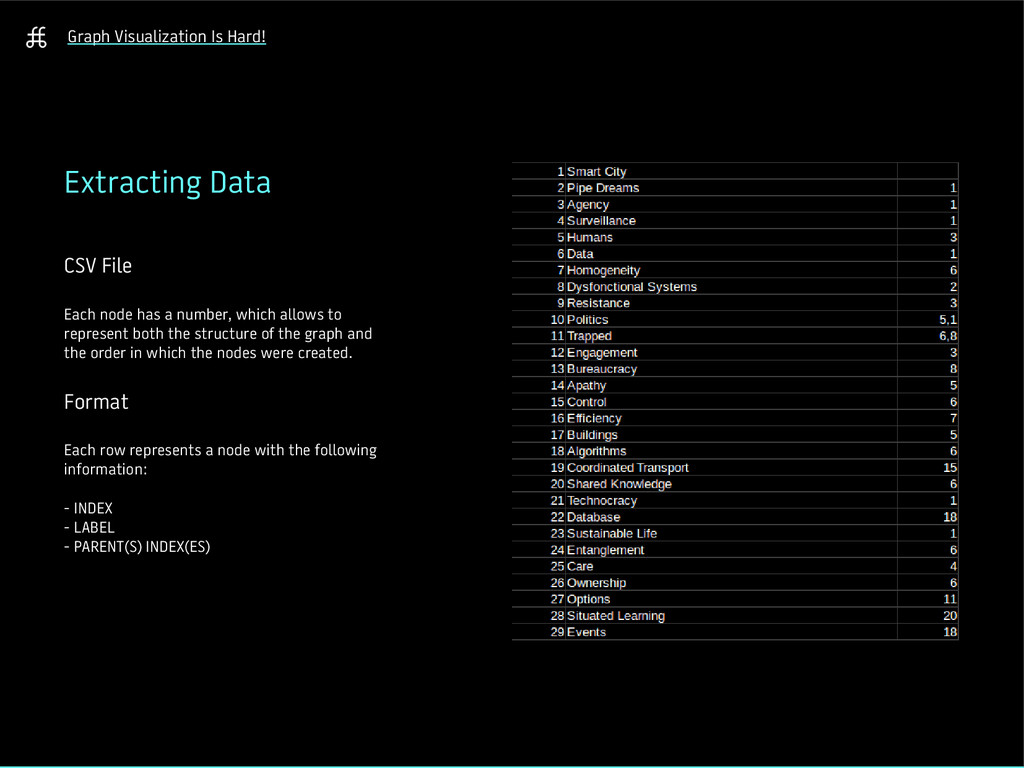
has a number, which allows to represent both the structure of the graph and the order in which the nodes were created. Format Each row represents a node with the following information: - INDEX - LABEL - PARENT(S) INDEX(ES)
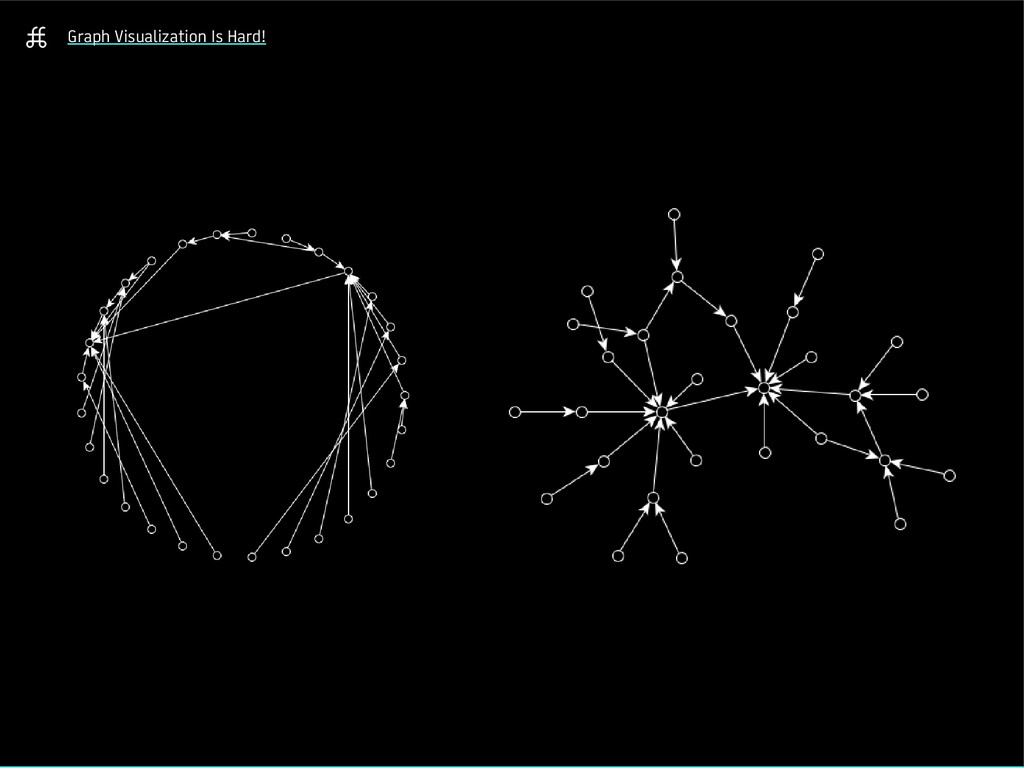
of the algorithm will yield a different graph, ie. there is no determinism. Each run of the algorithm will yield a different graph, ie. there is no determinism.
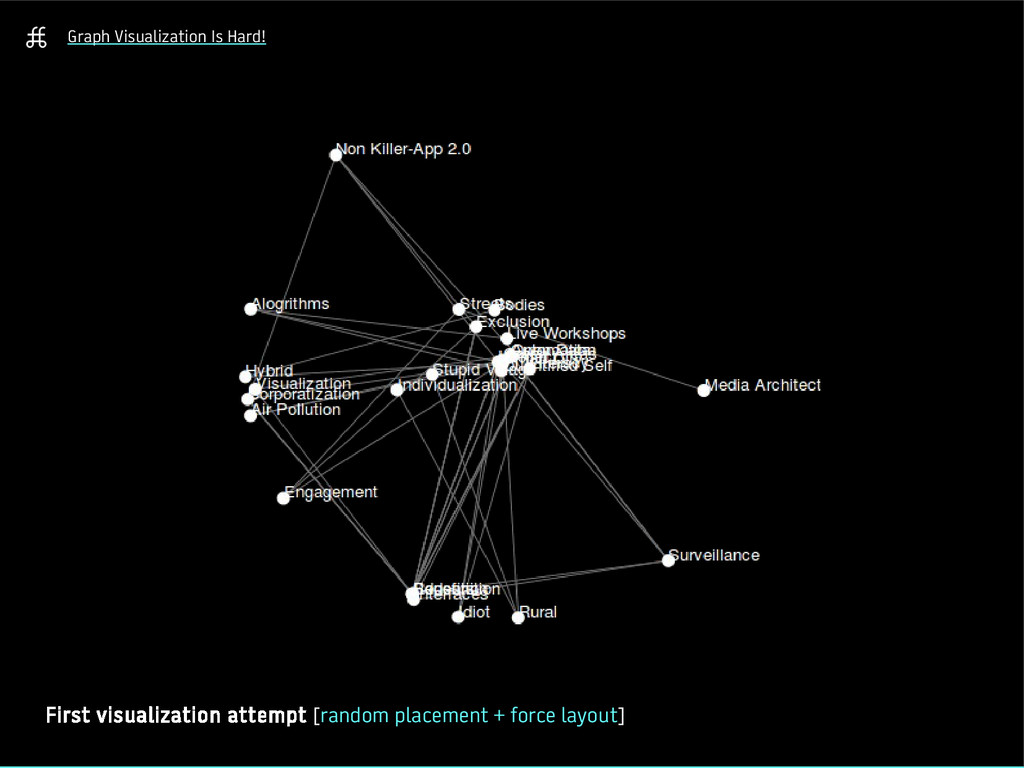
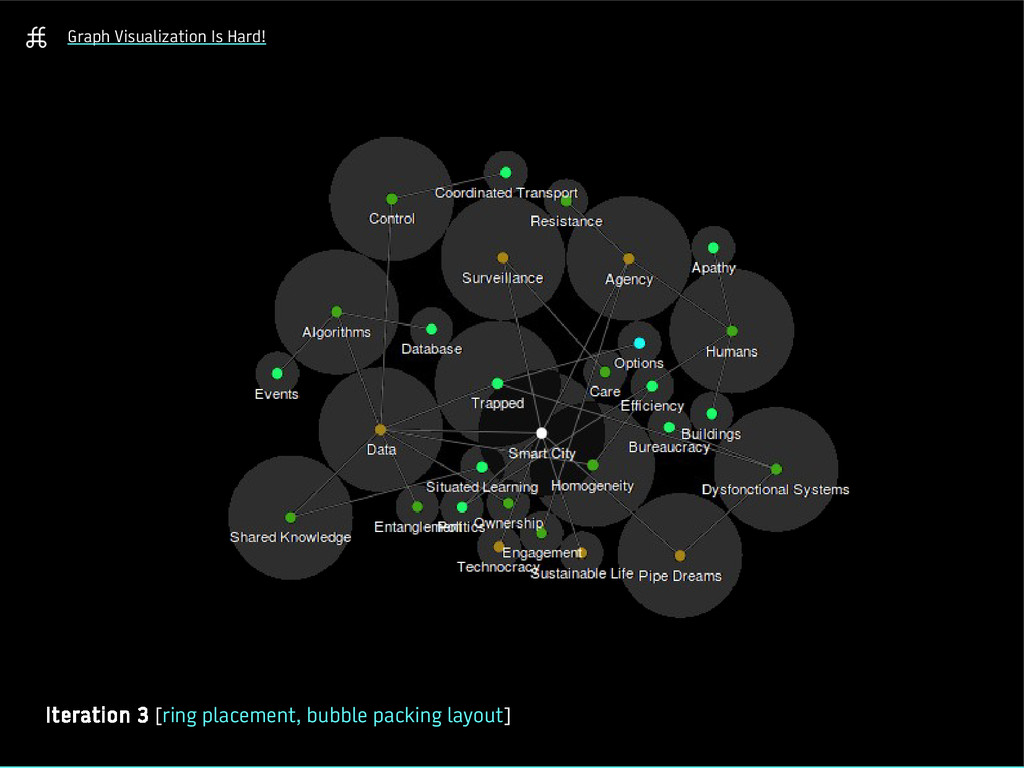
should also make structure more visible. If all nodes are displayed too regularily, it becomes hard to read the graph. When clusters & levels are apparent, the data's intrinsic structure becomes visible.
time I had to visualize a graph, I found the interaction to be as challenging as the layout. I'll show a couple of projects I've worked on that illustrate different ways of navigating through a graph.
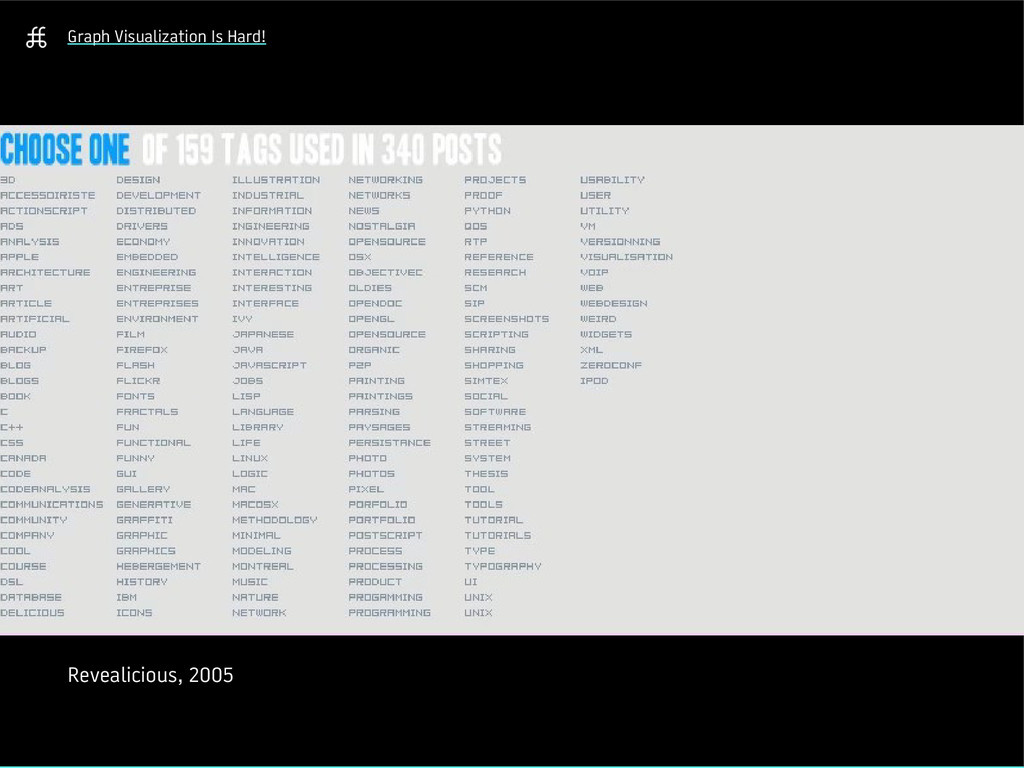
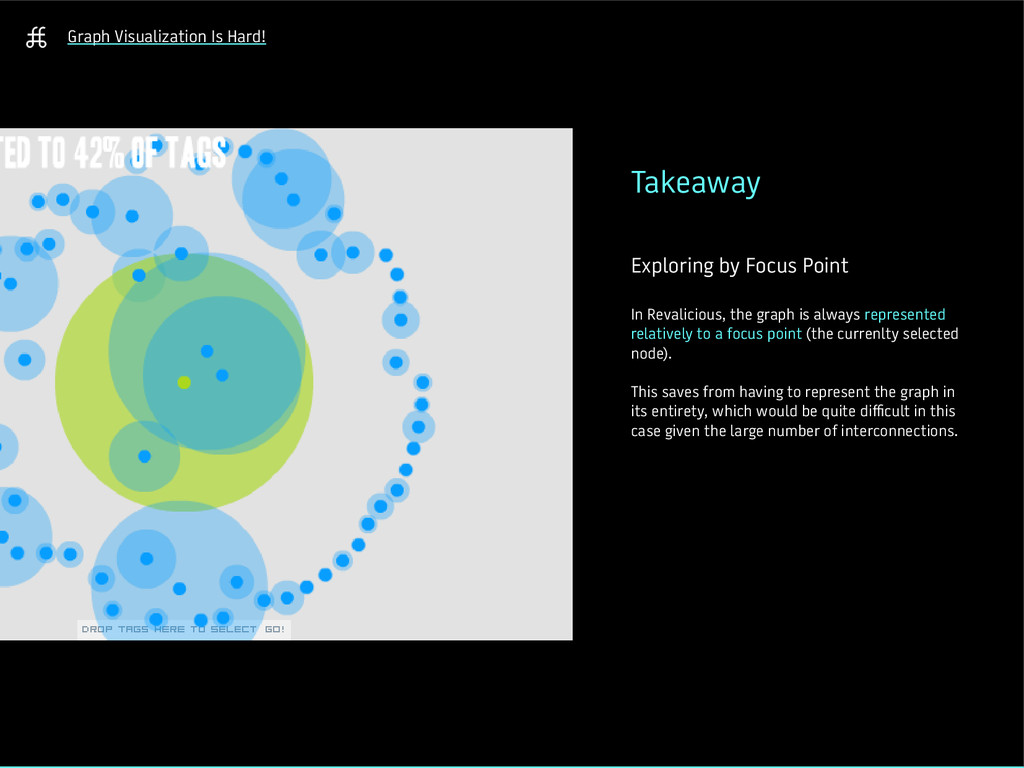
Revalicious, the graph is always represented relatively to a focus point (the currenlty selected node). This saves from having to represent the graph in its entirety, which would be quite difficult in this case given the large number of interconnections.
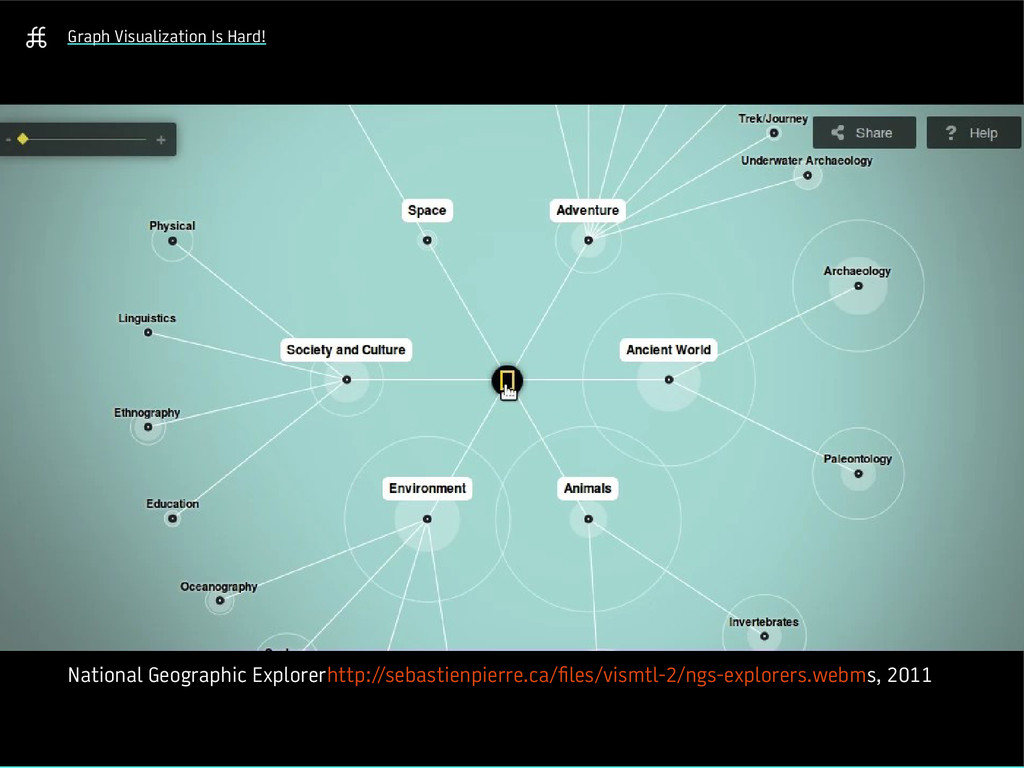
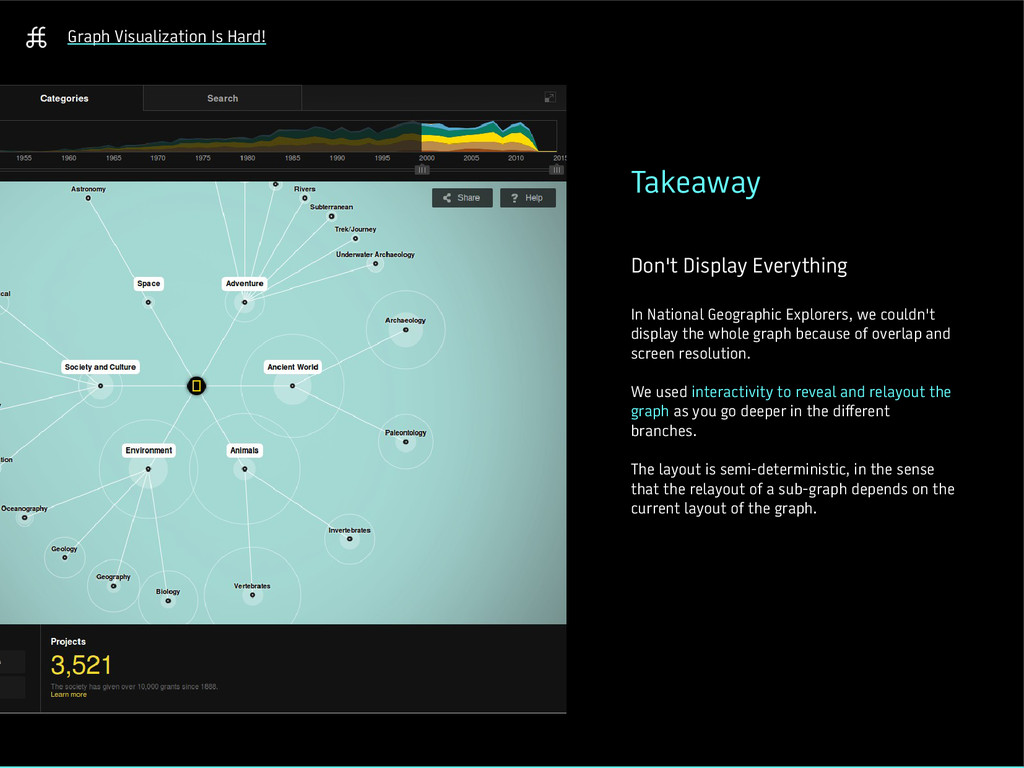
Geographic Explorers, we couldn't display the whole graph because of overlap and screen resolution. We used interactivity to reveal and relayout the graph as you go deeper in the different branches. The layout is semi-deterministic, in the sense that the relayout of a sub-graph depends on the current layout of the graph.
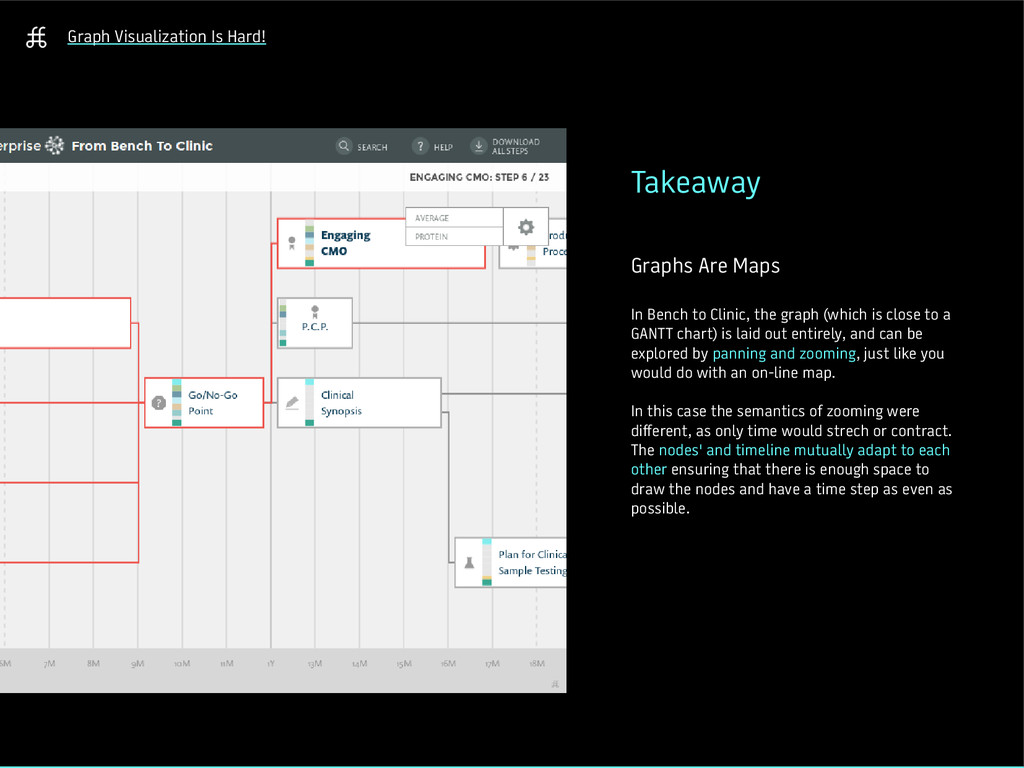
to Clinic, the graph (which is close to a GANTT chart) is laid out entirely, and can be explored by panning and zooming, just like you would do with an on-line map. In this case the semantics of zooming were different, as only time would strech or contract. The nodes' and timeline mutually adapt to each other ensuring that there is enough space to draw the nodes and have a time step as even as possible.
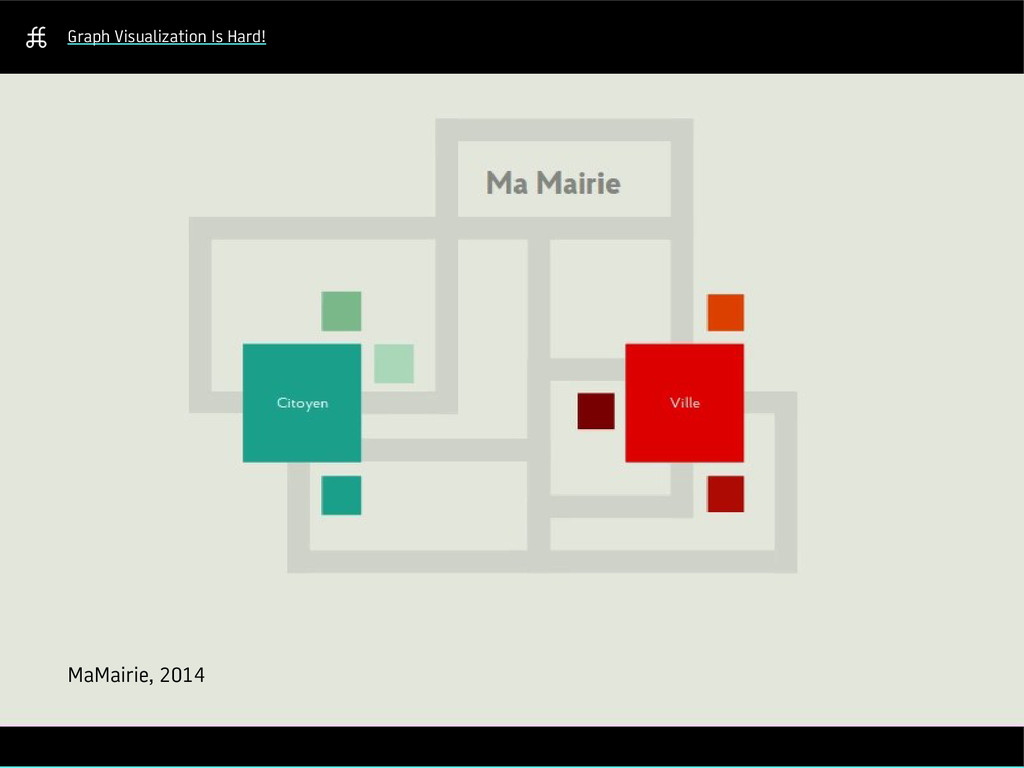
we found that displaying the whole organizational diagram was overwhelming. Instead, we chose to only represent the current pah of organizations and institutions that link the citizen to the city. We gave up the overview to reduce the complexity of discovering the structure.
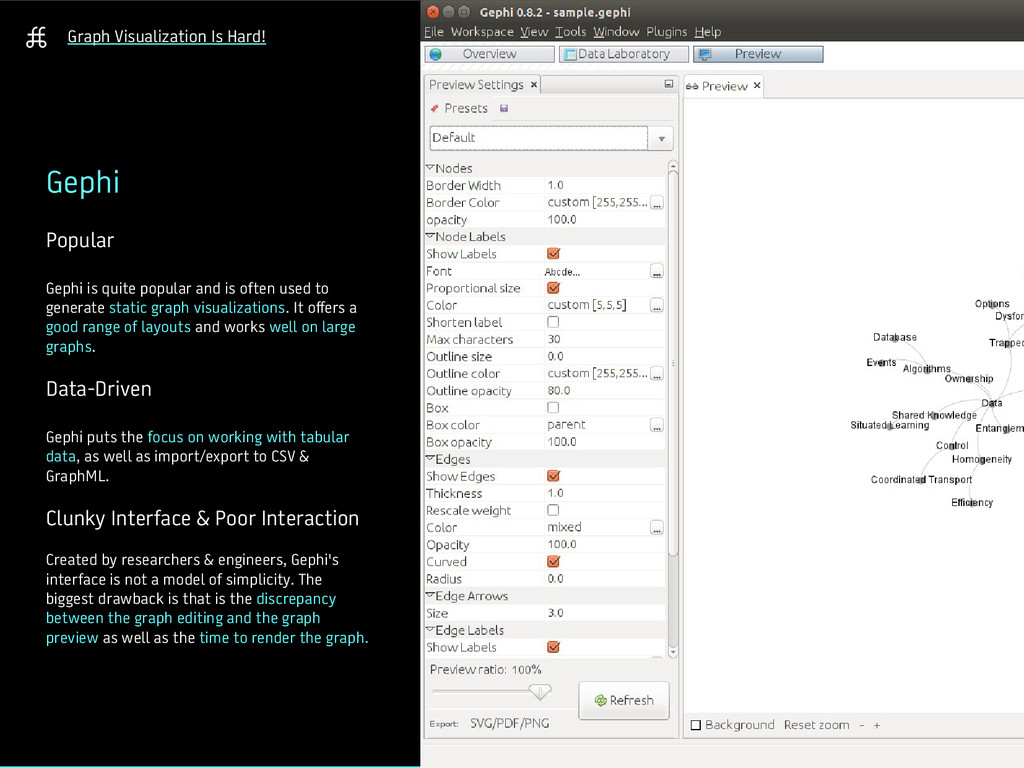
and is often used to generate static graph visualizations. It offers a good range of layouts and works well on large graphs. Data-Driven Gephi puts the focus on working with tabular data, as well as import/export to CSV & GraphML. Clunky Interface & Poor Interaction Created by researchers & engineers, Gephi's interface is not a model of simplicity. The biggest drawback is that is the discrepancy between the graph editing and the graph preview as well as the time to render the graph.
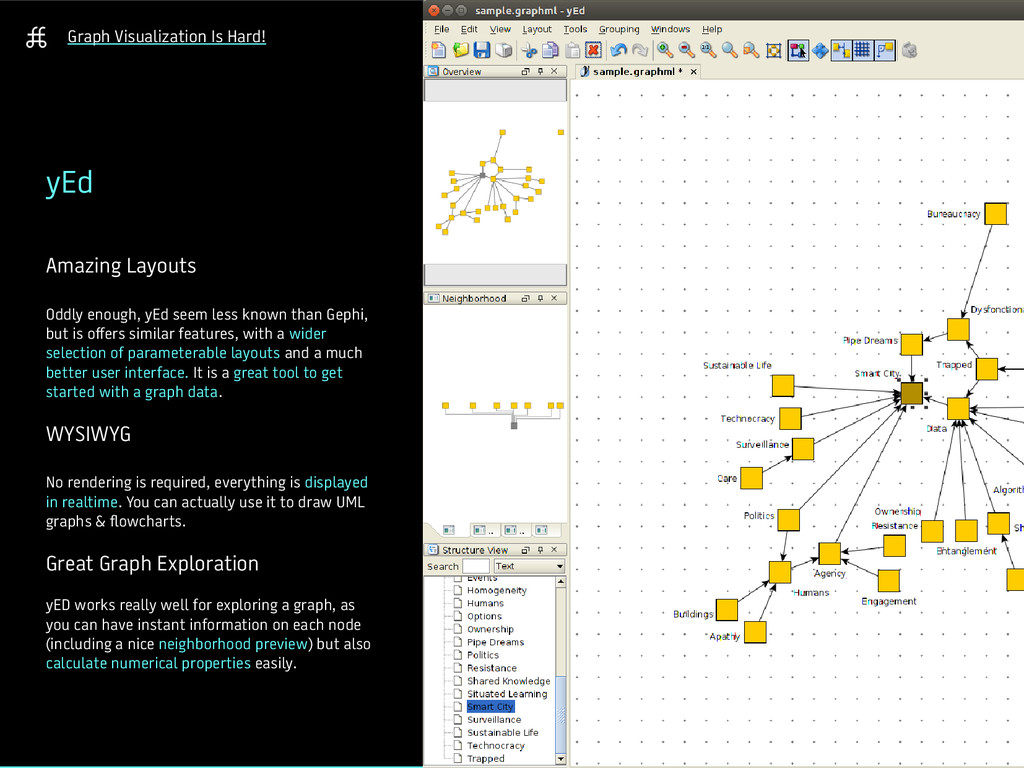
seem less known than Gephi, but is offers similar features, with a wider selection of parameterable layouts and a much better user interface. It is a great tool to get started with a graph data. WYSIWYG No rendering is required, everything is displayed in realtime. You can actually use it to draw UML graphs & flowcharts. Great Graph Exploration yED works really well for exploring a graph, as you can have instant information on each node (including a nice neighborhood preview) but also calculate numerical properties easily.
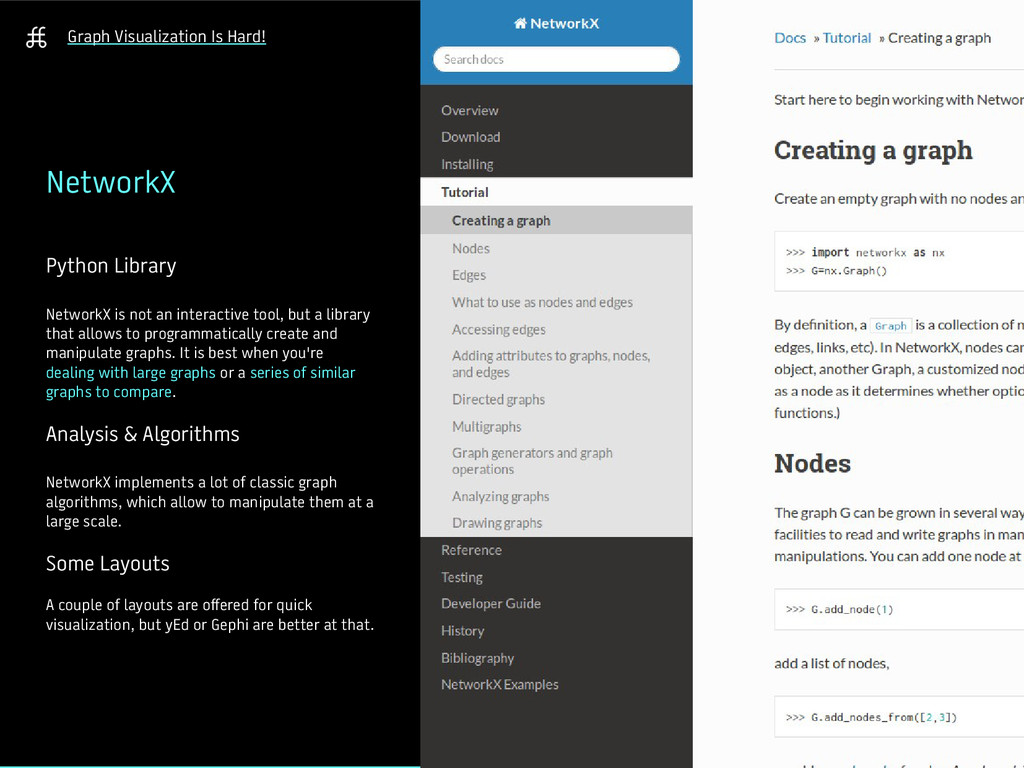
an interactive tool, but a library that allows to programmatically create and manipulate graphs. It is best when you're dealing with large graphs or a series of similar graphs to compare. Analysis & Algorithms NetworkX implements a lot of classic graph algorithms, which allow to manipulate them at a large scale. Some Layouts A couple of layouts are offered for quick visualization, but yEd or Gephi are better at that.
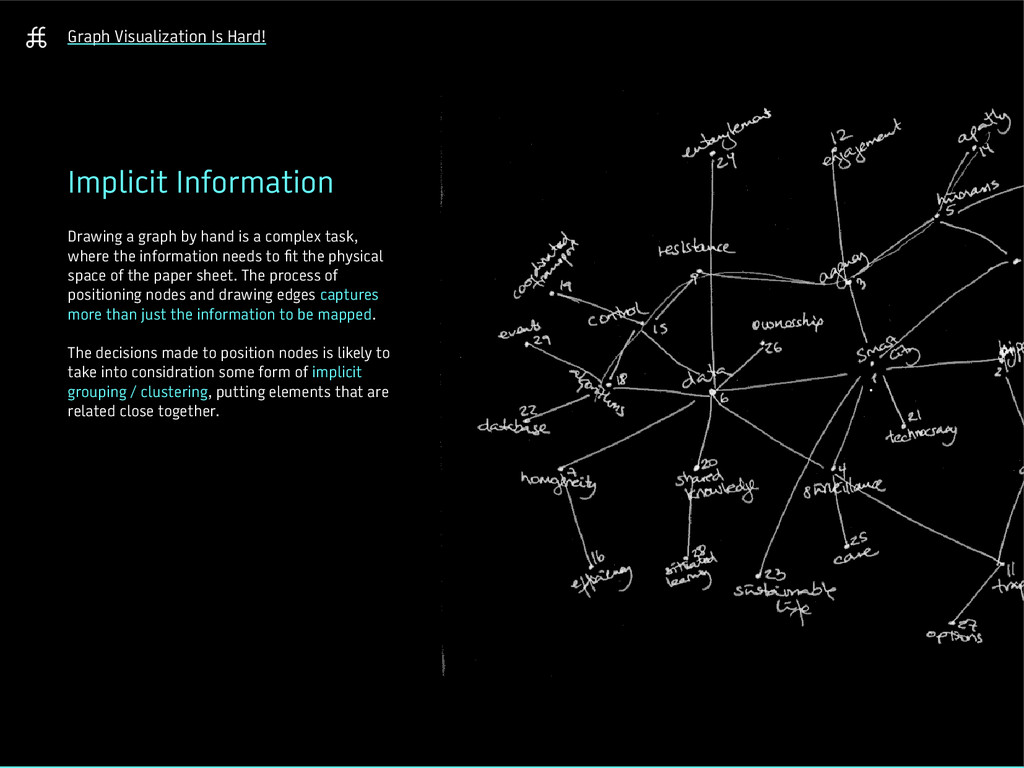
by hand is a complex task, where the information needs to fit the physical space of the paper sheet. The process of positioning nodes and drawing edges captures more than just the information to be mapped. The decisions made to position nodes is likely to take into considration some form of implicit grouping / clustering, putting elements that are related close together.
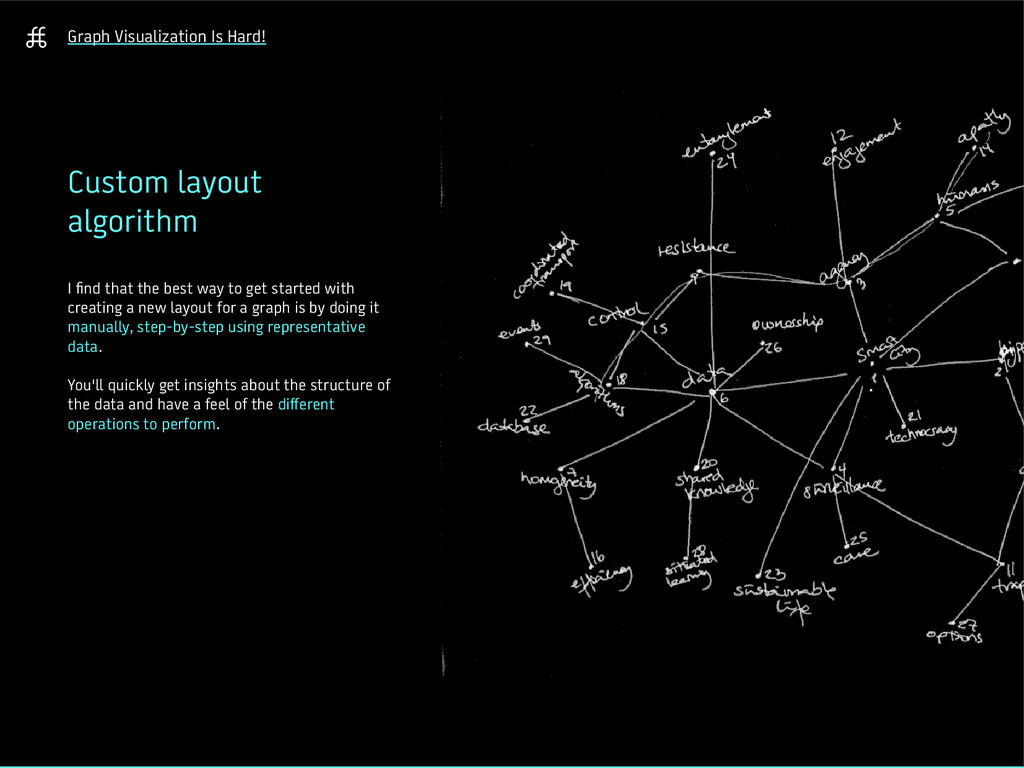
that the best way to get started with creating a new layout for a graph is by doing it manually, step-by-step using representative data. You'll quickly get insights about the structure of the data and have a feel of the different operations to perform.
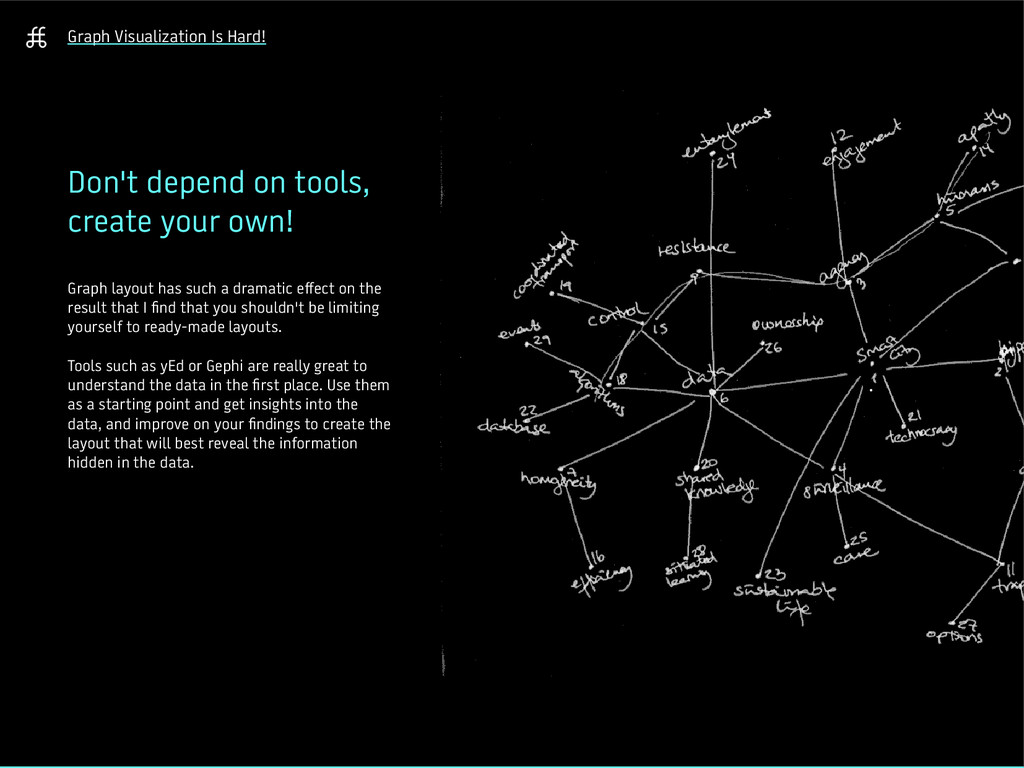
your own! Graph layout has such a dramatic effect on the result that I find that you shouldn't be limiting yourself to ready-made layouts. Tools such as yEd or Gephi are really great to understand the data in the first place. Use them as a starting point and get insights into the data, and improve on your findings to create the layout that will best reveal the information hidden in the data.
![Graph Visualization Is Hard! Iteration 2 [ring placement]](https://files.speakerdeck.com/presentations/85154710255901326e4a064769dcc1c7/slide_26.jpg)
![Graph Visualization Is Hard! Using Sigma.js [Atlas-2 layout]](https://files.speakerdeck.com/presentations/85154710255901326e4a064769dcc1c7/slide_28.jpg)
![Graph Visualization Is Hard! Using Sigma.js [Atlas-2 layout] Each run](https://files.speakerdeck.com/presentations/85154710255901326e4a064769dcc1c7/slide_29.jpg)
![Graph Visualization Is Hard! Using Graphviz [neato, no overlap]](https://files.speakerdeck.com/presentations/85154710255901326e4a064769dcc1c7/slide_30.jpg)
![Graph Visualization Is Hard! Using D3 [force-directed layout] Smart City](https://files.speakerdeck.com/presentations/85154710255901326e4a064769dcc1c7/slide_31.jpg)
![Graph Visualization Is Hard! Gephi [Fruchterman-Reingold layout] Smart City Pipe](https://files.speakerdeck.com/presentations/85154710255901326e4a064769dcc1c7/slide_32.jpg)
![Graph Visualization Is Hard! Gephi [Yifan Hu layout] Smart City](https://files.speakerdeck.com/presentations/85154710255901326e4a064769dcc1c7/slide_33.jpg)