Inform citizens on the performance of key services. For example, success or failure of IT project, hours of waiting at the ER, etc. Budget Visualization Help citizens know where the money given to the government is spent. For example: participatory budget, visual budget explorer.
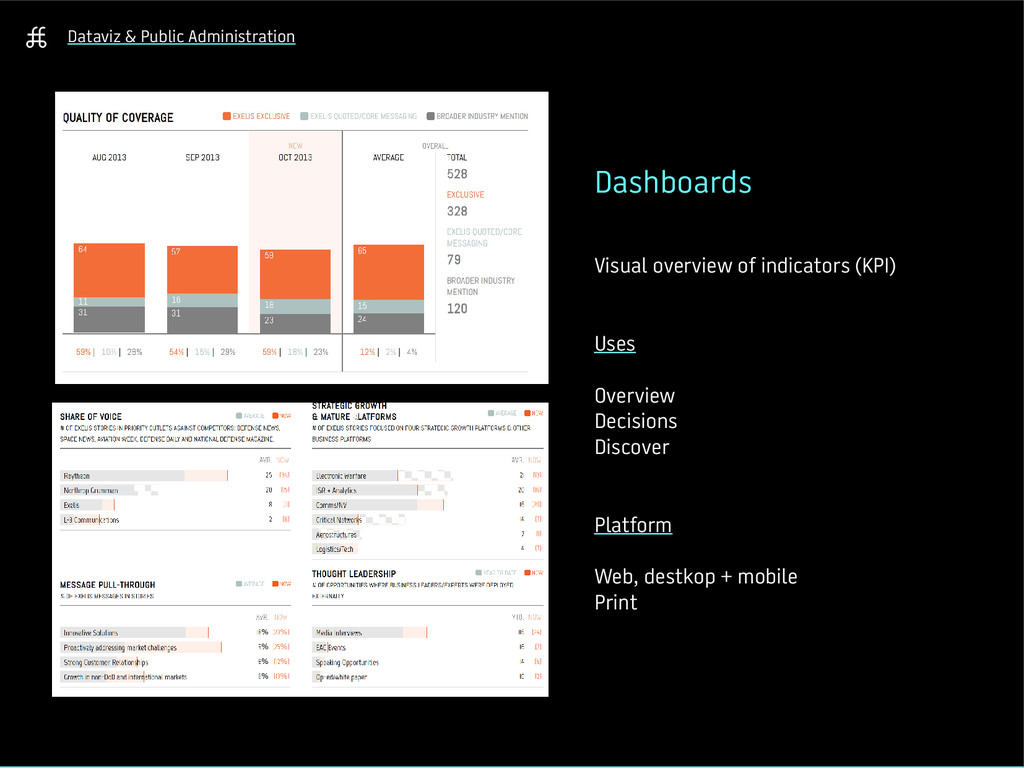
to support better understanding of territory-specific factors. Dashboards Track indicators and allow to have a visual snapshot of the situation. Put emphasis on allowing to compare between different periods and allow quantitative measurement of policies.
the data quality by making it visible. For instance, many datasets contain errors which go largerly unnoticed because the data is not visible. Visual Catalogue Make data more accessible by making it easy to browse and find. Information silos are common place, and even with open data it is hard to find the proper information.
not yet have a culture of considering producing and curating data as a core element of their activity. Knowledge Public servants are often not able to determine what is “good” and “bad” data – not only in terms of quality, but also in its ability to be used as a material for data visualization & online tools.
some data processing and visualization tools are being developed, most of them are still beyond the reach of someone with a good technical background, if not programming skills. Third-parties There are not many external resources for offering data-visualization services or training, which makes it difficult to implement projects.
open government and open data is still very young and not very mature. Public servants are working behind closed doors and very rarely collaborate with citizens, while collaborations are often required for data-viz projects. Innovation New paradigms such as open-government or using data visualization in communication require the ability to create innovation within the government. While institutions should primarily focus on delivering services to citizens, the government should allow for pilot projects to kickstart innovation.
non-profits are eager to use government data to change their environment. Hackathons have been organized in many countries from Europe to North-America, generating hundreds of new projects, some of which made a big impact on the citizens' life.
& creative industries is an important aspect of our modern economy. Startups and small groups of individuals need an ecosystem to grow and develop their ideas into actual projects. By encouraging and favouring working with smaller & local companies, the government would help sustain such an ecosystem, while also having opportunities to benefit from citizen's innovation.
much a plague to governments as low citizen participation. Governments are often perceived as black boxes that citizens' can't understand, which discourages citizens to get involved. Using data visualization and the Web, governments could not only give a better idea of how they work, but also engage citizens and allow them to participate. Publishing actual data would also help have informed debates, which would help discussion focus more on the facts than on the individual beliefs.
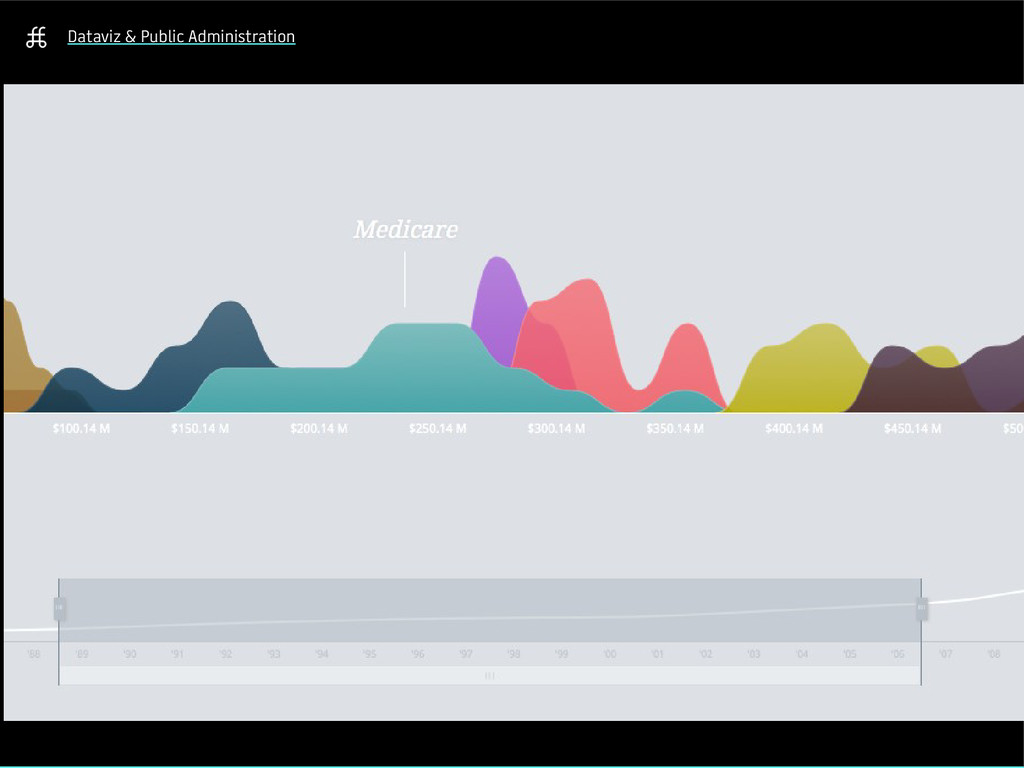
![Dataviz & Public Administration Million Dollar Gram Davic McCandless [link]](https://files.speakerdeck.com/presentations/6ad3f920fd6a01313e764e83437af169/slide_36.jpg)
![Dataviz & Public Administration Mapping America New York [link]](https://files.speakerdeck.com/presentations/6ad3f920fd6a01313e764e83437af169/slide_38.jpg)
![Dataviz & Public Administration Expense Visualizer FFunction [link]](https://files.speakerdeck.com/presentations/6ad3f920fd6a01313e764e83437af169/slide_40.jpg)
![Dataviz & Public Administration Code For America [link]](https://files.speakerdeck.com/presentations/6ad3f920fd6a01313e764e83437af169/slide_47.jpg)
![Dataviz & Public Administration Open Data Institute [link]](https://files.speakerdeck.com/presentations/6ad3f920fd6a01313e764e83437af169/slide_49.jpg)
![Dataviz & Public Administration Citizen Budget Open North [link]](https://files.speakerdeck.com/presentations/6ad3f920fd6a01313e764e83437af169/slide_51.jpg)