Upgrade to Pro — share decks privately, control downloads, hide ads and more …

A case study of Visualizing Government Data

sebastien
September 16, 2012

A case study of Visualizing Government Data

sebastien

September 16, 2012
Tweet

More Decks by sebastien

Other Decks in Technology

Transcript

  1. ffunction
    inc.
    © FFUNCTION INC, 2011
    A CASE STUDY OF
    VISUALIZING (NON-OPEN)
    GOVERNMENT DATA
    Sébastien Pierre, FFunction inc.
    @Data, Stories & Co., September 2012
    www.ffctn.com

    View Slide

  2. ffunction
    inc.
    © FFUNCTION INC, 2011
    GOALS

    SHARE
    our experience with visualizing gov't data

    SHOW
    how we built an interactive dataviz

    TELL
    why open-data is important

    View Slide

  3. ffunction
    inc.
    © FFUNCTION INC, 2011
    INFOGRAPHIC : SE7EN SUMMITS

    View Slide

  4. ffunction
    inc.
    © FFUNCTION INC, 2011
    GOOGE DATAVIZ CHALLENGE 2010 (FINALIST)

    View Slide

  5. ffunction
    inc.
    © FFUNCTION INC, 2011
    NATIONAL GEOGRAPHIC SOCIETY'S PROJECTS

    View Slide

  6. ffunction
    inc.
    © FFUNCTION INC, 2011
    2008
    Canadian Federal
    Travel & Hospitality
    Expenses
    2010
    US
    Federal
    Budget
    2012
    Call for tender
    Montréal &
    Québec
    FFUNCTION'S GOV-DATA VISUALIZATIONS

    View Slide

  7. ffunction
    inc.
    © FFUNCTION INC, 2011
    2008
    Canadian Federal
    Travel & Hospitality
    Expenses

    View Slide

  8. ffunction
    inc.
    © FFUNCTION INC, 2011
    SOME THINGS HAVEN'T CHANGED SINCE 2008

    SCRAPING DATA
    in the absence of open-data, journalists will
    often be in the same context, having to spend
    time to collect, explore and assess the quality of
    the data.
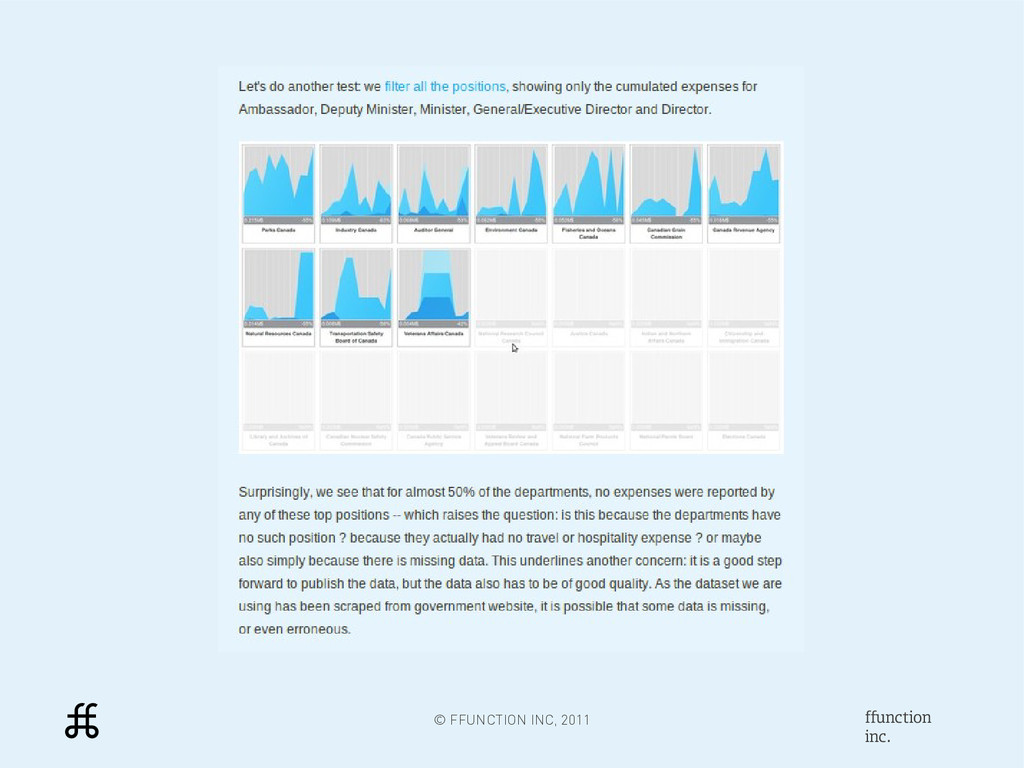
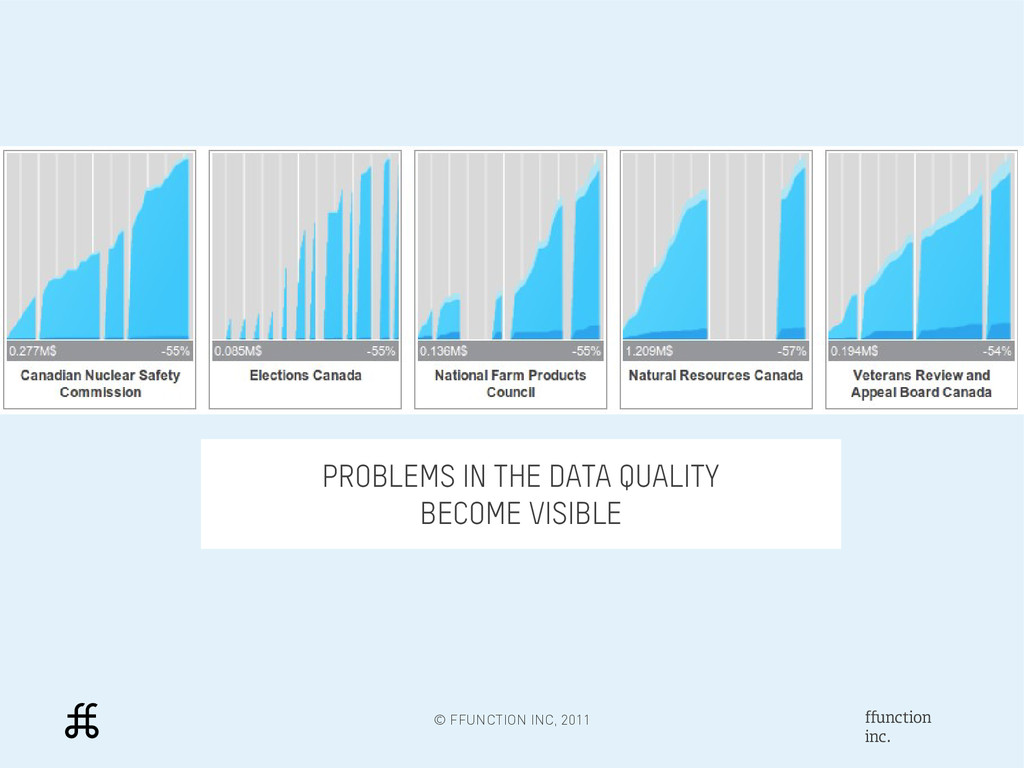
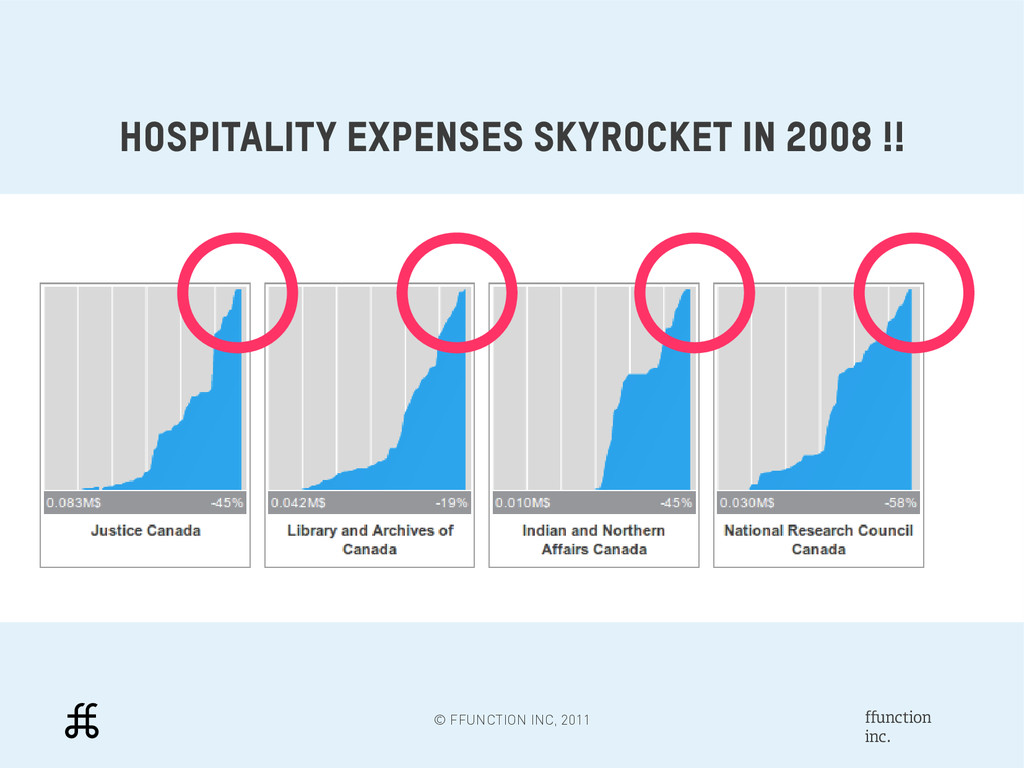
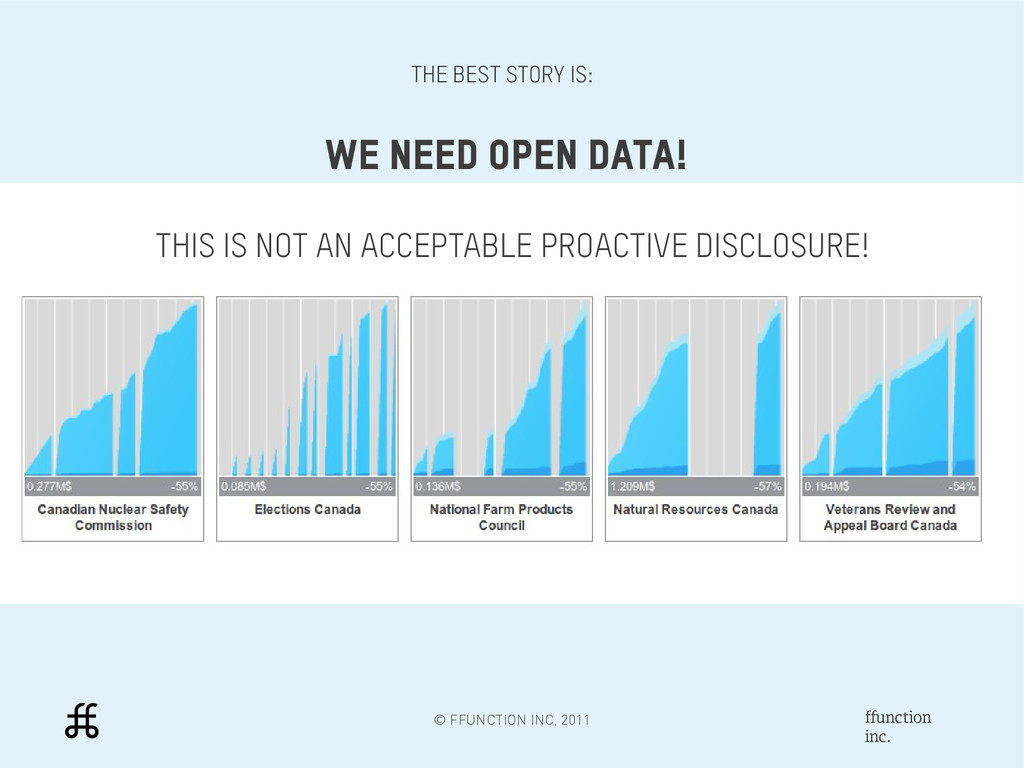
    View Slide

  9. ffunction
    inc.
    © FFUNCTION INC, 2011
    SOME THINGS HAVEN'T CHANGED SINCE 2008

    FROM DATA TO STORY
    Each dataset is a discovery, getting a
    (compelling) story out of it is still a major
    challenge.

    View Slide

  10. ffunction
    inc.
    © FFUNCTION INC, 2011
    THE DATA

    View Slide

  11. ffunction
    inc.
    © FFUNCTION INC, 2011
    As the result of a federal government directive*,
    Travel and Hospitality Expenses have been
    published on the web in Canada since 2004
    * Called “proactive disclosure”

    View Slide

  12. ffunction
    inc.
    © FFUNCTION INC, 2011
    http://www.tbs-sct.gc.ca/pd-dp/gr-rg/index-eng.asp

    View Slide

  13. ffunction
    inc.
    © FFUNCTION INC, 2011
    Data is (still) not
    directly accessible,
    and hosted on each
    specific ministry
    website, in a
    specific format.

    View Slide

  14. ffunction
    inc.
    © FFUNCTION INC, 2011

    View Slide

  15. ffunction
    inc.
    © FFUNCTION INC, 2011
    NON-OPEN DATA
    ACCURACY PROBLEMS
    DATA MAY BE MISSING
    DATA NOT UP TO DATE

    View Slide

  16. ffunction
    inc.
    © FFUNCTION INC, 2011
    22Mb SQL file
    scraped by citizens
    (available on Github)

    View Slide

  17. ffunction
    inc.
    © FFUNCTION INC, 2011
    A DATASET WHICH TURNS OUT TO BE A BIT OPAQUE...

    View Slide

  18. ffunction
    inc.
    © FFUNCTION INC, 2011
    BUILDING A TOOL TO EXPLORE THE DATA

    View Slide

  19. ffunction
    inc.
    © FFUNCTION INC, 2011
    Basic analysis of the data

    View Slide

  20. ffunction
    inc.
    © FFUNCTION INC, 2011
    Thinking about how to represent the data

    View Slide

  21. ffunction
    inc.
    © FFUNCTION INC, 2011
    Thinking about the flow of interaction

    View Slide

  22. ffunction
    inc.
    © FFUNCTION INC, 2011
    Importing and visualizing the data

    View Slide

  23. ffunction
    inc.
    © FFUNCTION INC, 2011
    Mapping out the different types of expenses (travel, hospitality & guidelines)

    View Slide

  24. ffunction
    inc.
    © FFUNCTION INC, 2011
    Simplifying the representation (expenses vs guidelines, over guidelines is in red)

    View Slide

  25. ffunction
    inc.
    © FFUNCTION INC, 2011
    Changing the focus (under/over guidelines instead of total spending)

    View Slide

  26. ffunction
    inc.
    © FFUNCTION INC, 2011
    Adding guides to improve reading the information

    View Slide

  27. ffunction
    inc.
    © FFUNCTION INC, 2011
    Adding filtering to narrow down to subsets of the data

    View Slide

  28. ffunction
    inc.
    © FFUNCTION INC, 2011
    Trying alternative representations on the data

    View Slide

  29. ffunction
    inc.
    © FFUNCTION INC, 2011
    Trying even more alternative representations on the data

    View Slide

  30. ffunction
    inc.
    © FFUNCTION INC, 2011
    THE RESULT
    http://ffctn.com/a/expensevisualizer

    View Slide

  31. ffunction
    inc.
    © FFUNCTION INC, 2011

    View Slide

  32. ffunction
    inc.
    © FFUNCTION INC, 2011

    View Slide

  33. ffunction
    inc.
    © FFUNCTION INC, 2011
    I just found out the 5 top spending
    Federal depts, check it out at
    http://ur1.ca/a3spt

    View Slide

  34. ffunction
    inc.
    © FFUNCTION INC, 2011

    View Slide

  35. ffunction
    inc.
    © FFUNCTION INC, 2011

    View Slide

  36. ffunction
    inc.
    © FFUNCTION INC, 2011
    1
    FINDINGS

    View Slide

  37. ffunction
    inc.
    © FFUNCTION INC, 2011
    TRENDS ONLY BECOME APPARENT
    WITH THE PROPER MODE OF REPRESENTATION
    Cumulative spending
    Monthly spending

    View Slide

  38. ffunction
    inc.
    © FFUNCTION INC, 2011
    PROBLEMS IN THE DATA QUALITY
    BECOME VISIBLE

    View Slide

  39. ffunction
    inc.
    © FFUNCTION INC, 2011
    Spending of ministers for all departments
    THINGS YOU WOULD EXPECT
    ARE NOT NECESSARILY THERE

    View Slide

  40. ffunction
    inc.
    © FFUNCTION INC, 2011
    DATA TO STORY: CHALLENGES

    NON-OPEN DATA
    – Missing or incomplete data: is the problem in the
    scraper or in the actual data?
    – At least you now have a tool to assess (and improve)
    the data quality
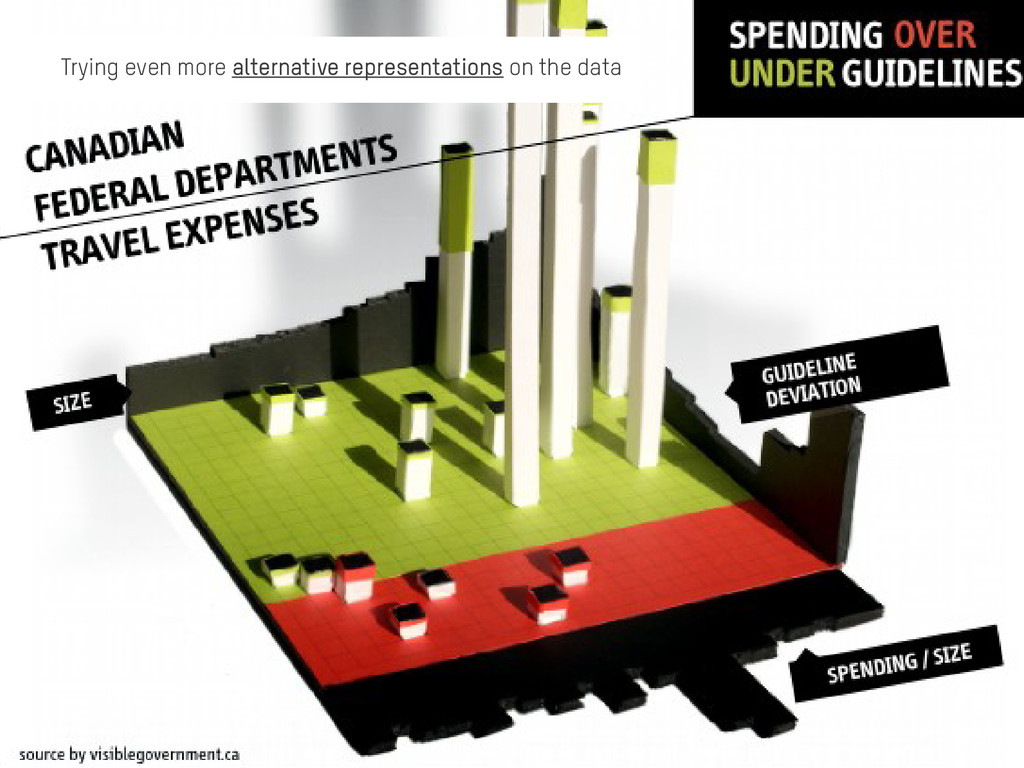
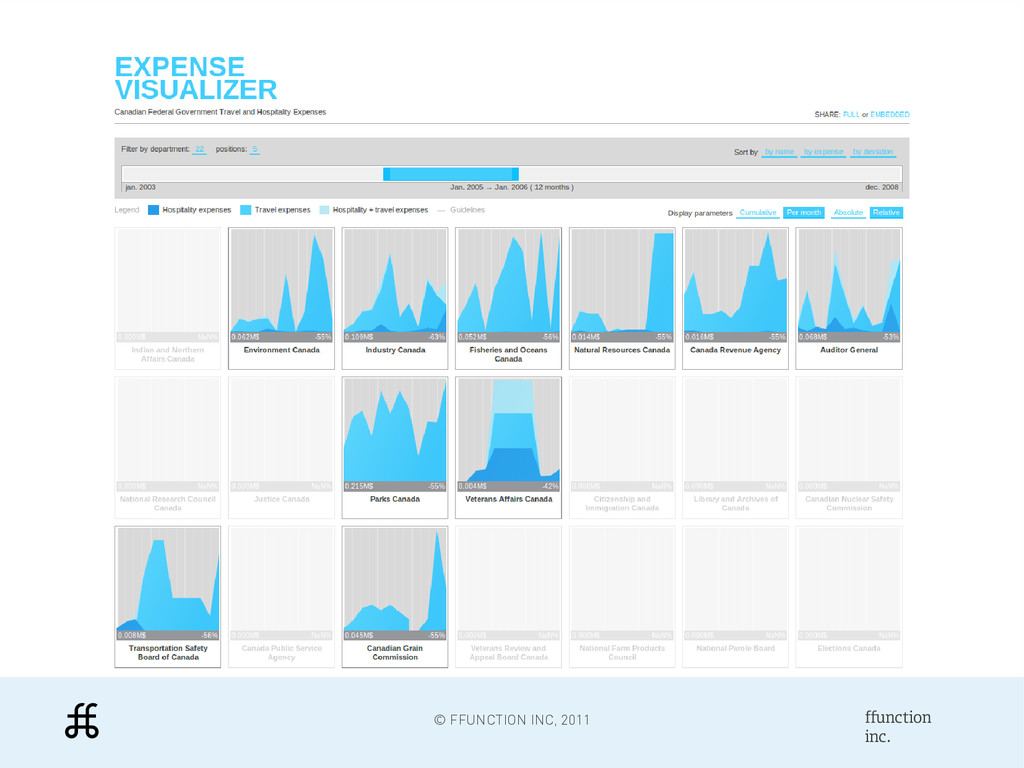
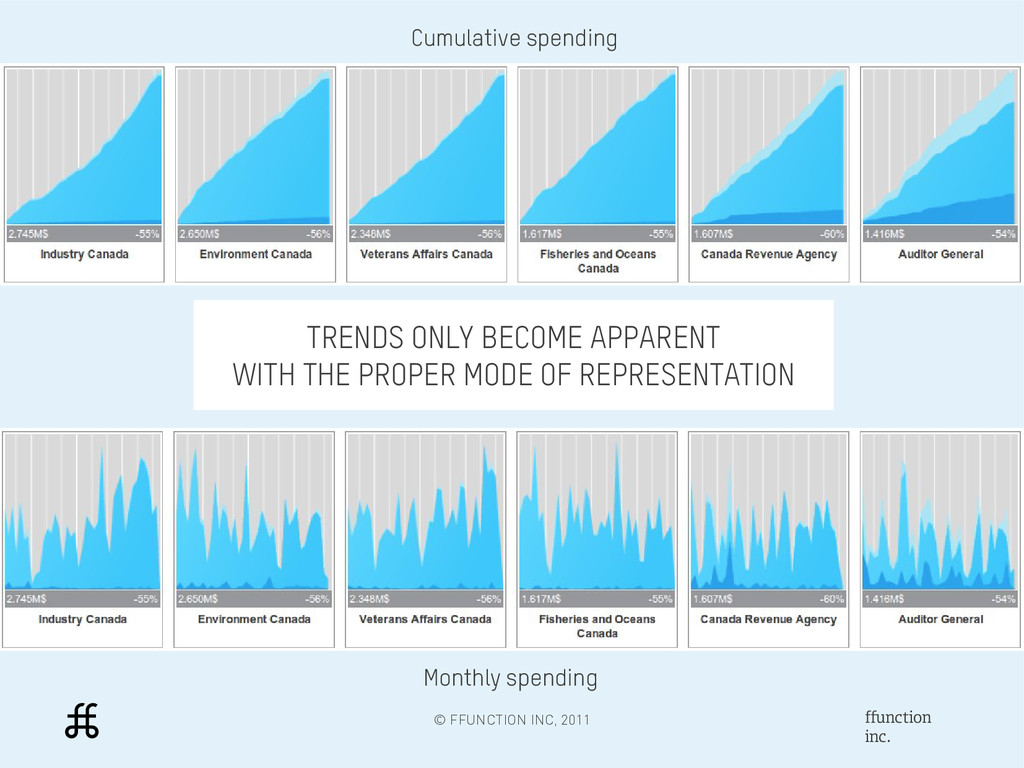
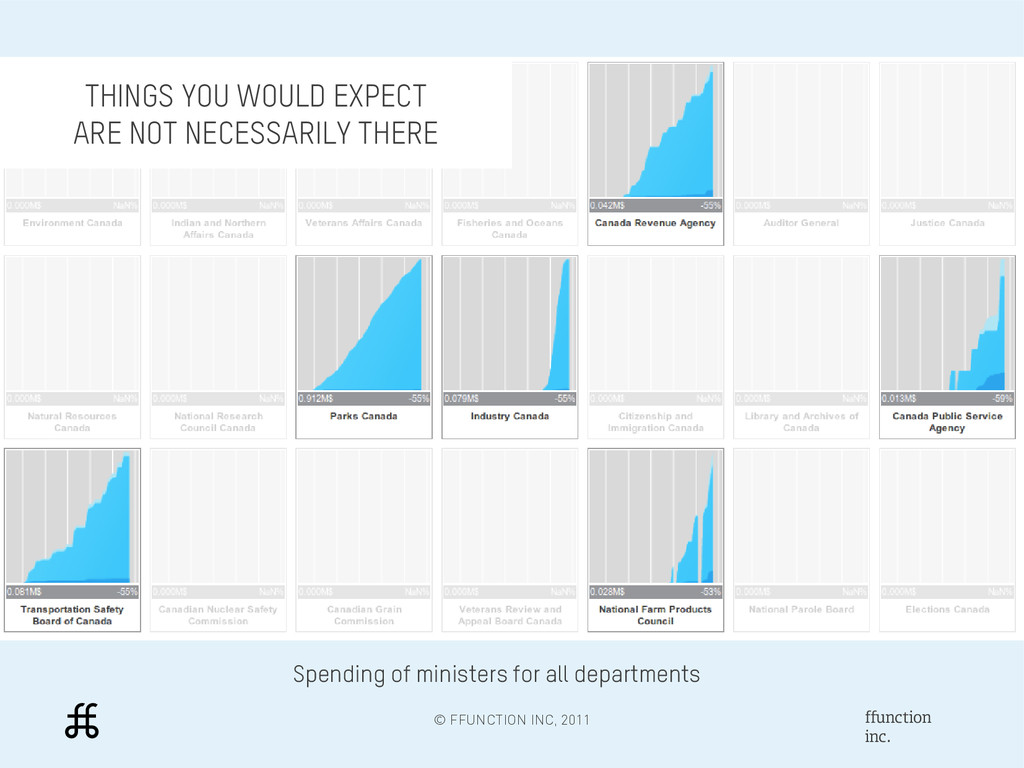
    View Slide

  41. ffunction
    inc.
    © FFUNCTION INC, 2011
    DATA TO STORY: CHALLENGES

    NOT WHAT I THOUGHT
    – You might expect something about the data,
    but the visualization might prove your wrong
    – You might have been looking for something specific
    but you cannot see it in the visualization
    See my “30 min of data visualization”
    workshop for more on this...

    View Slide

  42. ffunction
    inc.
    © FFUNCTION INC, 2011
    DATA TO STORY: CHALLENGES

    DID I TRY HARD ENOUGH?
    – There's no secret: you'll find something interesting if
    you explore your data enough.
    – If everything fails, you can at least get fun facts or
    controversial examples out of it.

    View Slide

  43. ffunction
    inc.
    © FFUNCTION INC, 2011
    HOSPITALITY EXPENSES SKYROCKET IN 2008 !!

    View Slide

  44. ffunction
    inc.
    © FFUNCTION INC, 2011
    2.5x
    As much
    INDUSTRY CANADA'S BIG SPENDER
    MINISTER DIRECTOR

    View Slide

  45. ffunction
    inc.
    © FFUNCTION INC, 2011
    WAR IS COSTING CANADA AN ARM AND A LEG!
    3 MILLIONS!
    (over a period of five years)

    View Slide

  46. ffunction
    inc.
    © FFUNCTION INC, 2011
    WE NEED OPEN DATA!
    THIS IS NOT AN ACCEPTABLE PROACTIVE DISCLOSURE!
    THE BEST STORY IS:

    View Slide

  47. ffunction
    inc.
    © FFUNCTION INC, 2011

    View Slide

  48. ffunction
    inc.
    © FFUNCTION INC, 2011
    Hacking Corruption
    Montréal
    10-11 Novembre 2012
    http://quebecouvert.org/events/hackonslacorruption/

    View Slide

  49. ffunction
    inc.
    © FFUNCTION INC, 2011
    THANK
    YOU!
    [email protected] / @ffunction
    WWW.FFCTN.COM

    View Slide