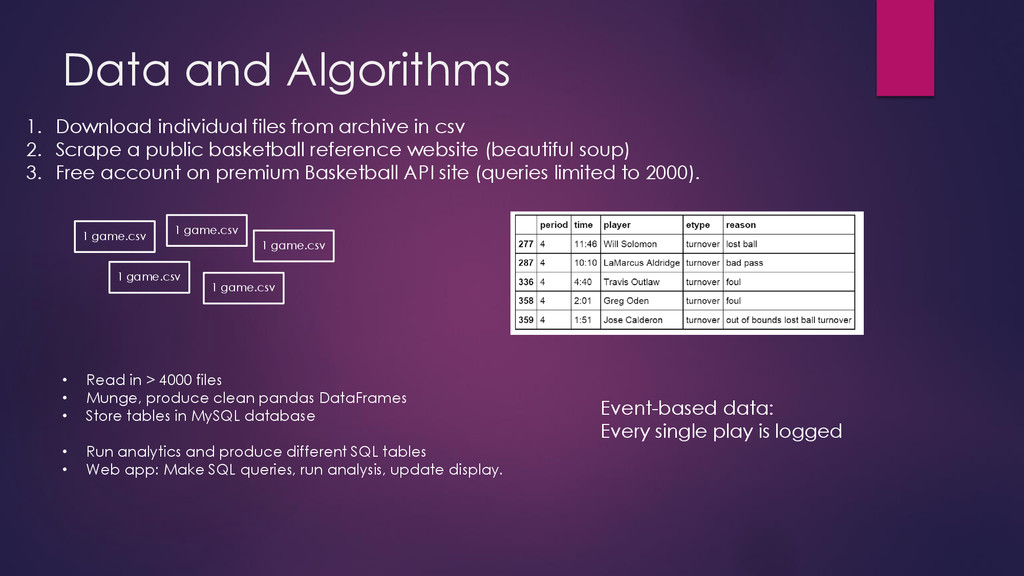
csv 2. Scrape a public basketball reference website (beautiful soup) 3. Free account on premium Basketball API site (queries limited to 2000). 1 game.csv 1 game.csv 1 game.csv • Read in > 4000 files • Munge, produce clean pandas DataFrames • Store tables in MySQL database • Run analytics and produce different SQL tables • Web app: Make SQL queries, run analysis, update display. 1 game.csv 1 game.csv Event-based data: Every single play is logged
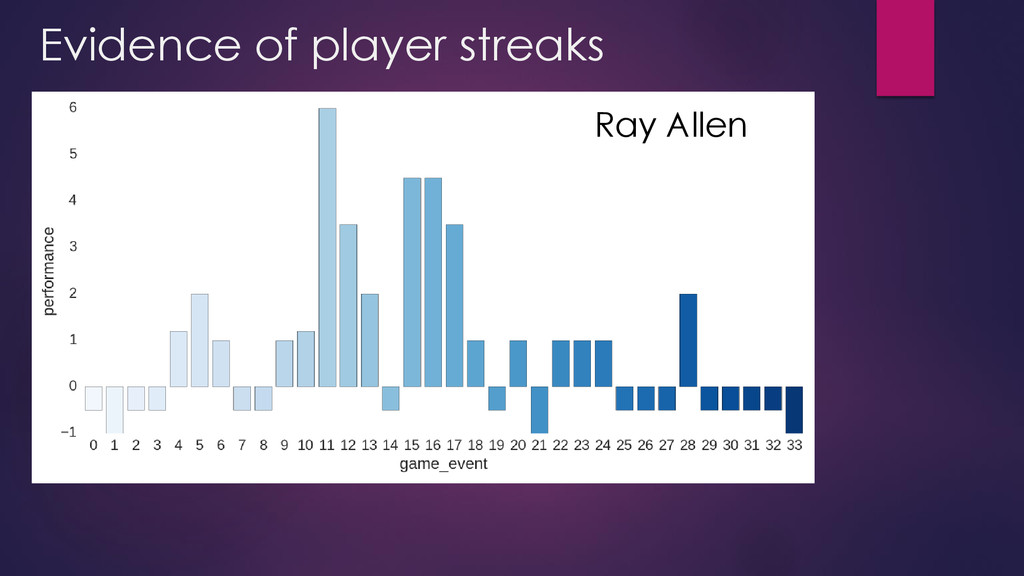
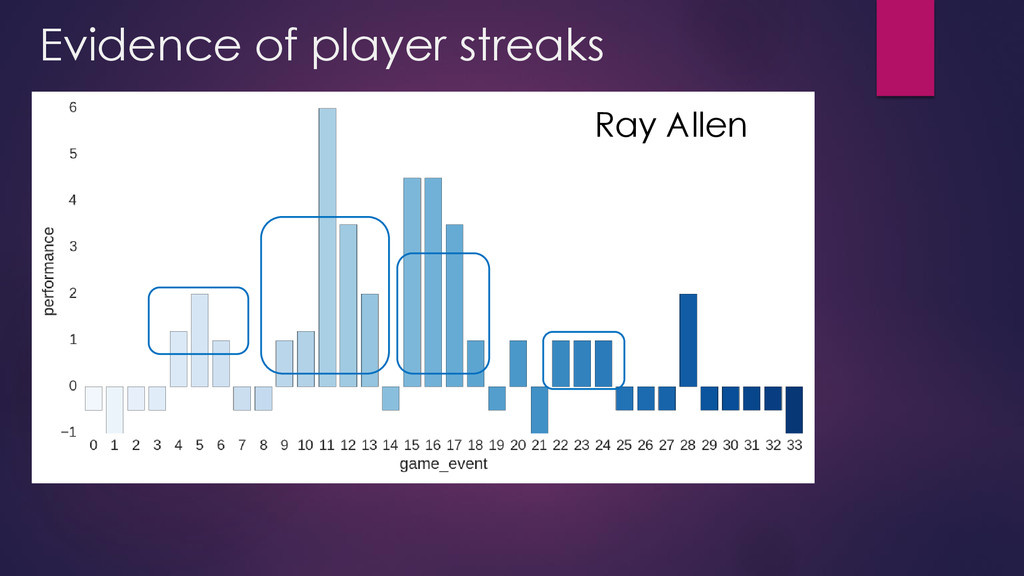
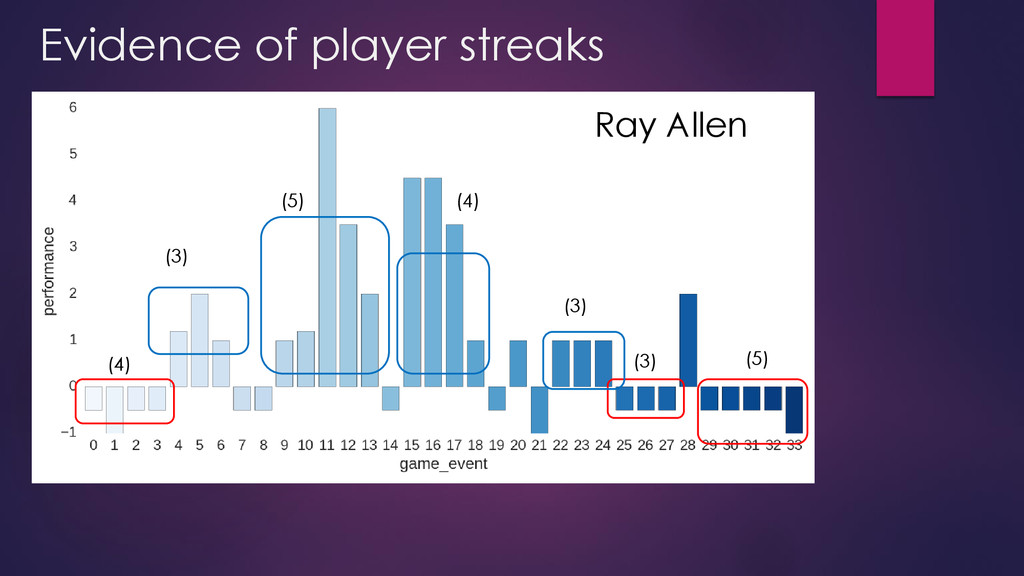
there are patterns in basketball games. Exploit these patterns. When a player has been performing well, or performing poorly, it affects their next few plays. Feedback loop for positive performance: • Positive gain: Momentum, increased confidence, team-mates will pas • Negative gain: opponents play better defence
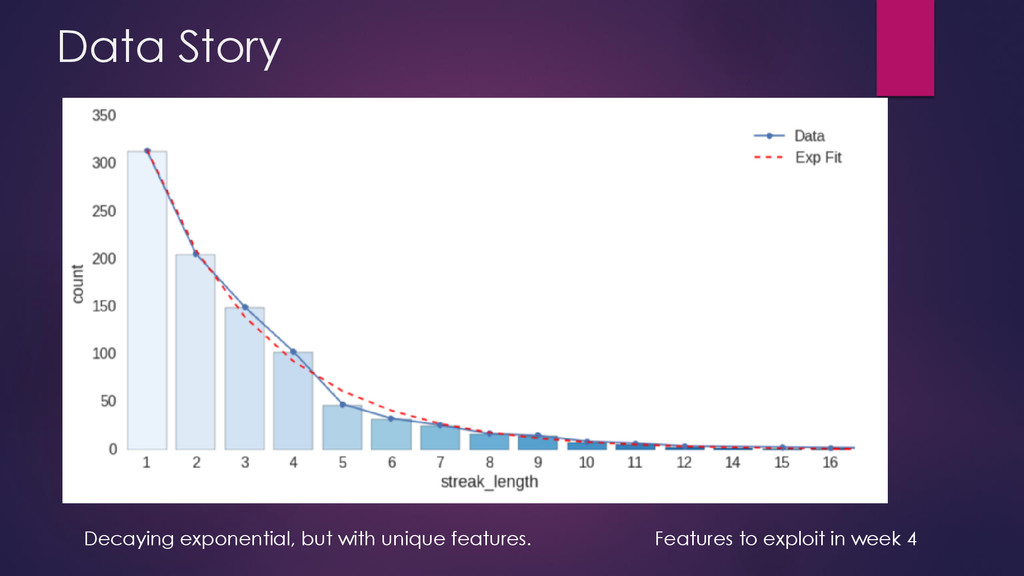
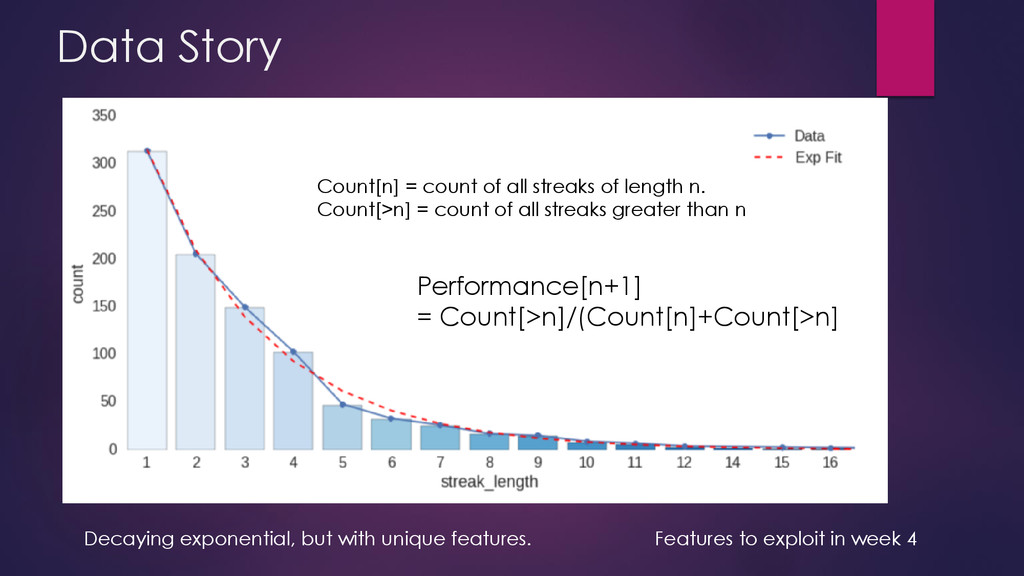
exploit in week 4 Count[n] = count of all streaks of length n. Count[>n] = count of all streaks greater than n Performance[n+1] = Count[>n]/(Count[n]+Count[>n]