Upgrade to Pro — share decks privately, control downloads, hide ads and more …

Seeing Through Serverless: Observability for A...

Sponsored · Your Podcast. Everywhere. Effortlessly. Share. Educate. Inspire. Entertain. You do you. We'll handle the rest.

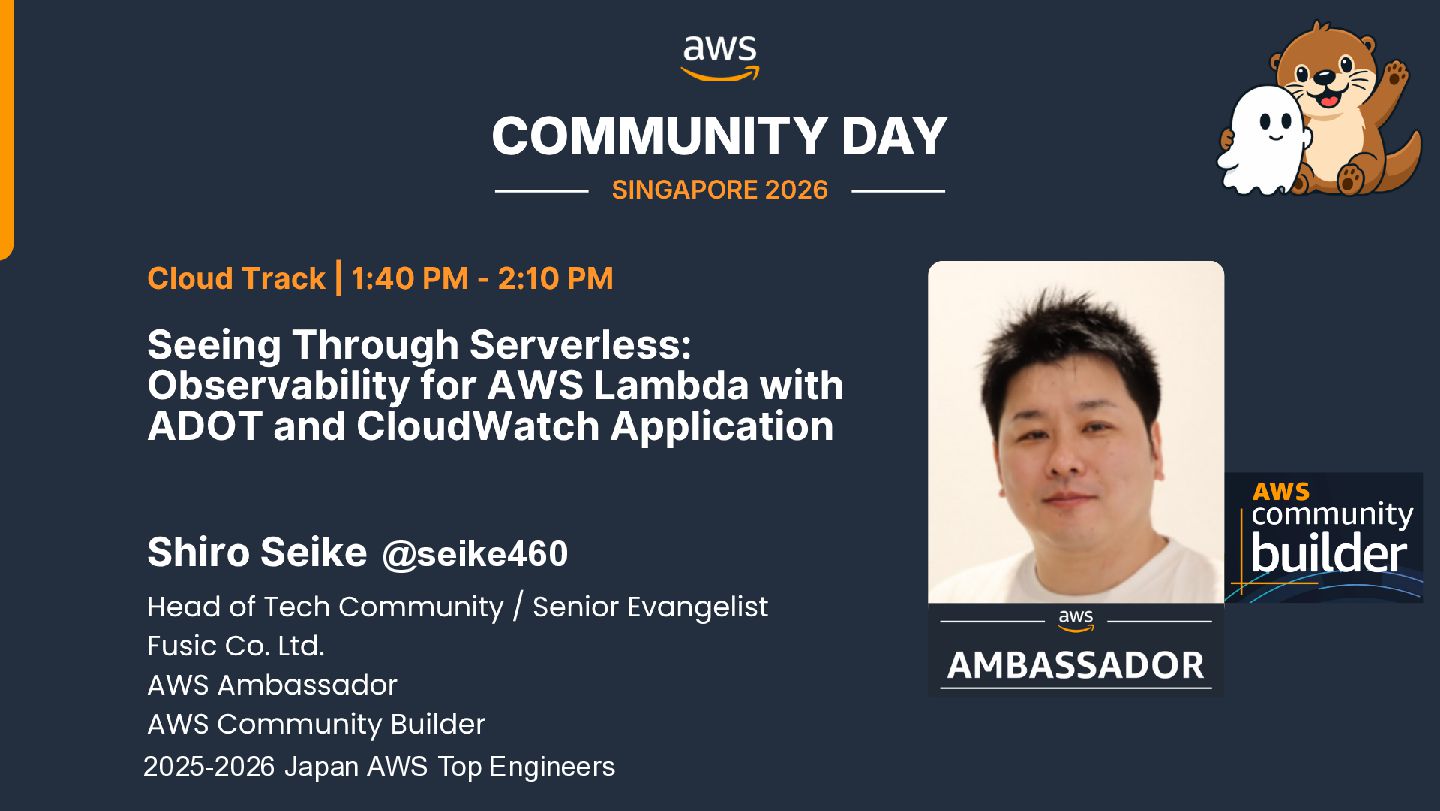
Seeing Through Serverless: Observability for AWS Lambda with ADOT and CloudWatch Application Signals

AWS Community Day 2026 Singapore

https://www.awsugsg.dev

Serverless lets you ship fast—until something breaks and you're staring into a black box. On AWS Lambda, traces scatter across async invocations and cold starts hide in aggregates. This talk makes every invocation observable with AWS-native tooling: the ADOT Lambda Layer for zero-code instrumentation, CloudWatch Application Signals for RED metrics and SLOs, and X-Ray for end-to-end traces. Best part—it's all OpenTelemetry underneath, so your telemetry stays portable with no lock-in.

Avatar for shiro seike

shiro seike PRO

August 22, 2026

More Decks by shiro seike

Other Decks in Programming

Transcript

  1. Seeing Through Serverless Observability for AWS Lambda with ADOT and

    CloudWatch Application Signals SHIRO SEIKE (@SEIKE460),@seike460 FUSIC | 22 AUG 2026 2025-2026 Japan AWS Top Engineers
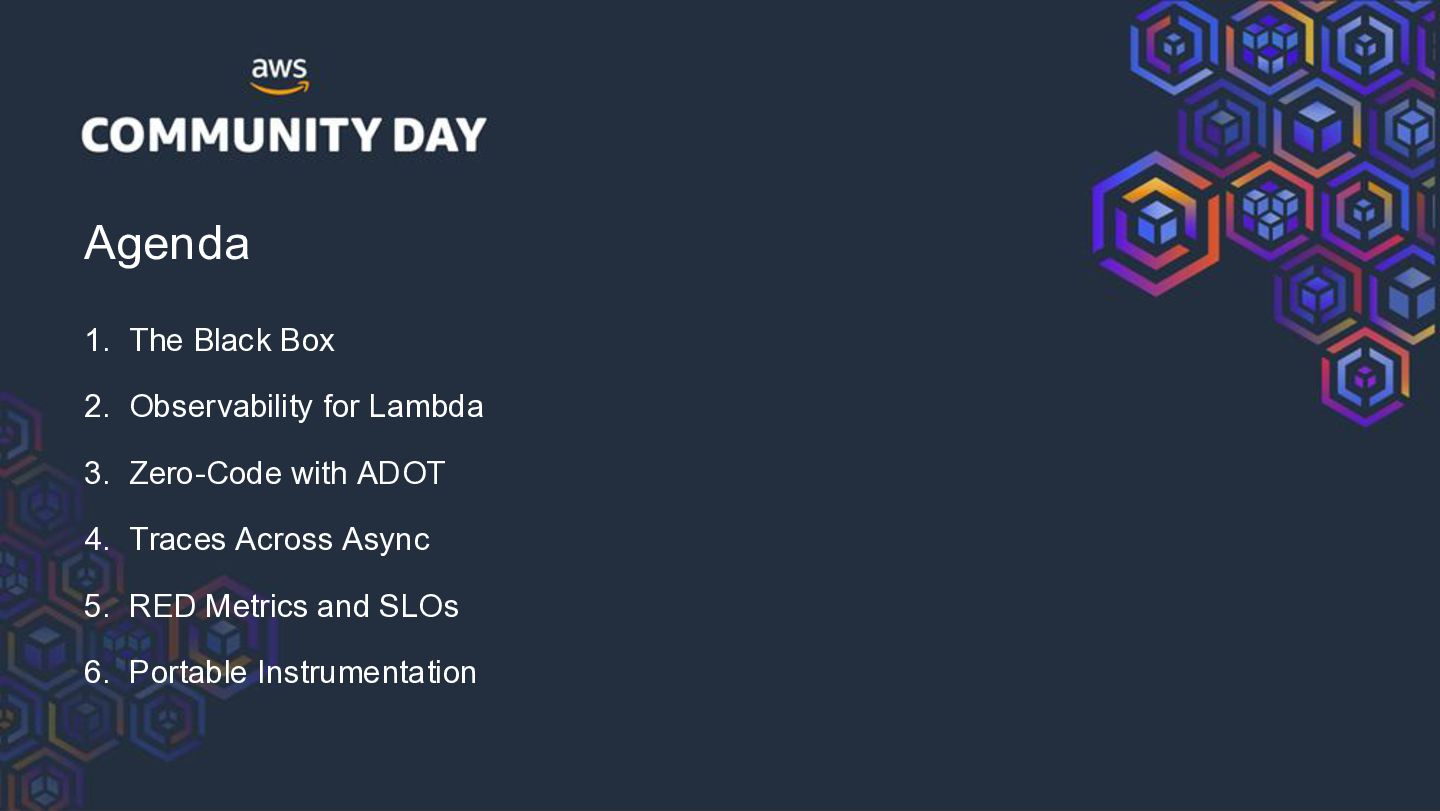
  2. Agenda 1. The Black Box 2. Observability for Lambda 3.

    Zero-Code with ADOT 4. Traces Across Async 5. RED Metrics and SLOs 6. Portable Instrumentation
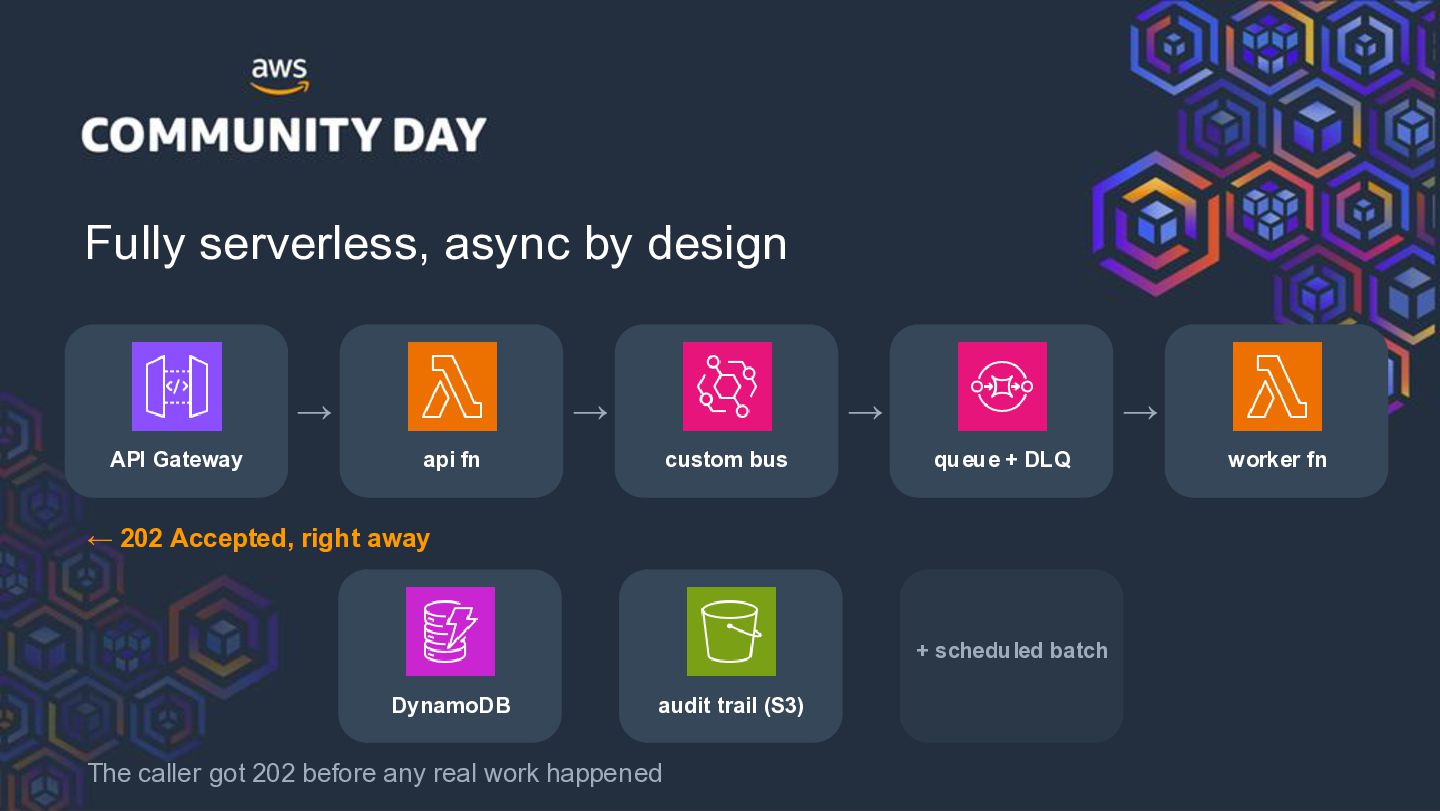
  3. Fully serverless, async by design → API Gateway → →

    api fn custom bus → queue + DLQ ← 202 Accepted, right away + scheduled batch DynamoDB audit trail (S3) The caller got 202 before any real work happened worker fn
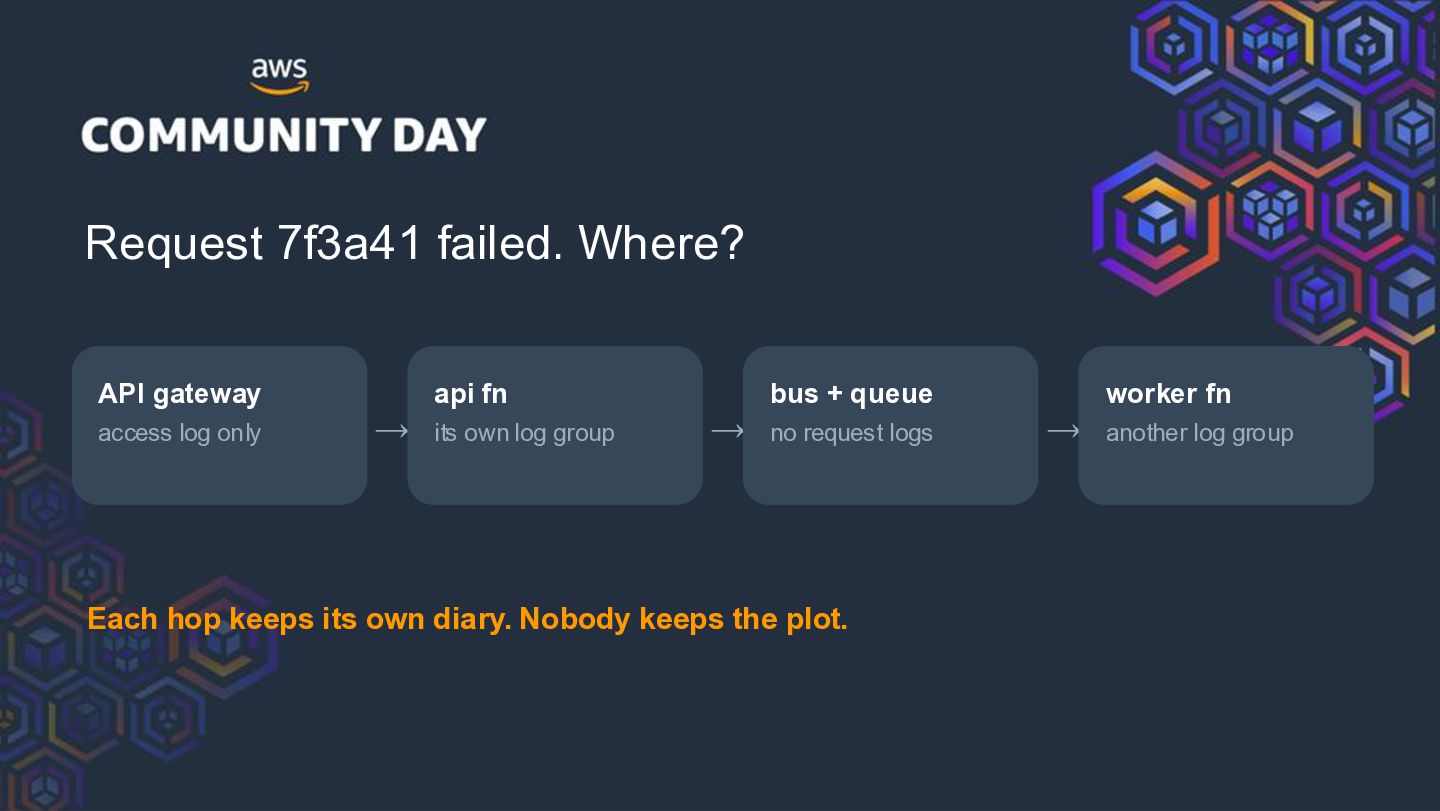
  4. Request 7f3a41 failed. Where? API gateway access log only api

    fn → its own log group bus + queue → no request logs Each hop keeps its own diary. Nobody keeps the plot. worker fn → another log group
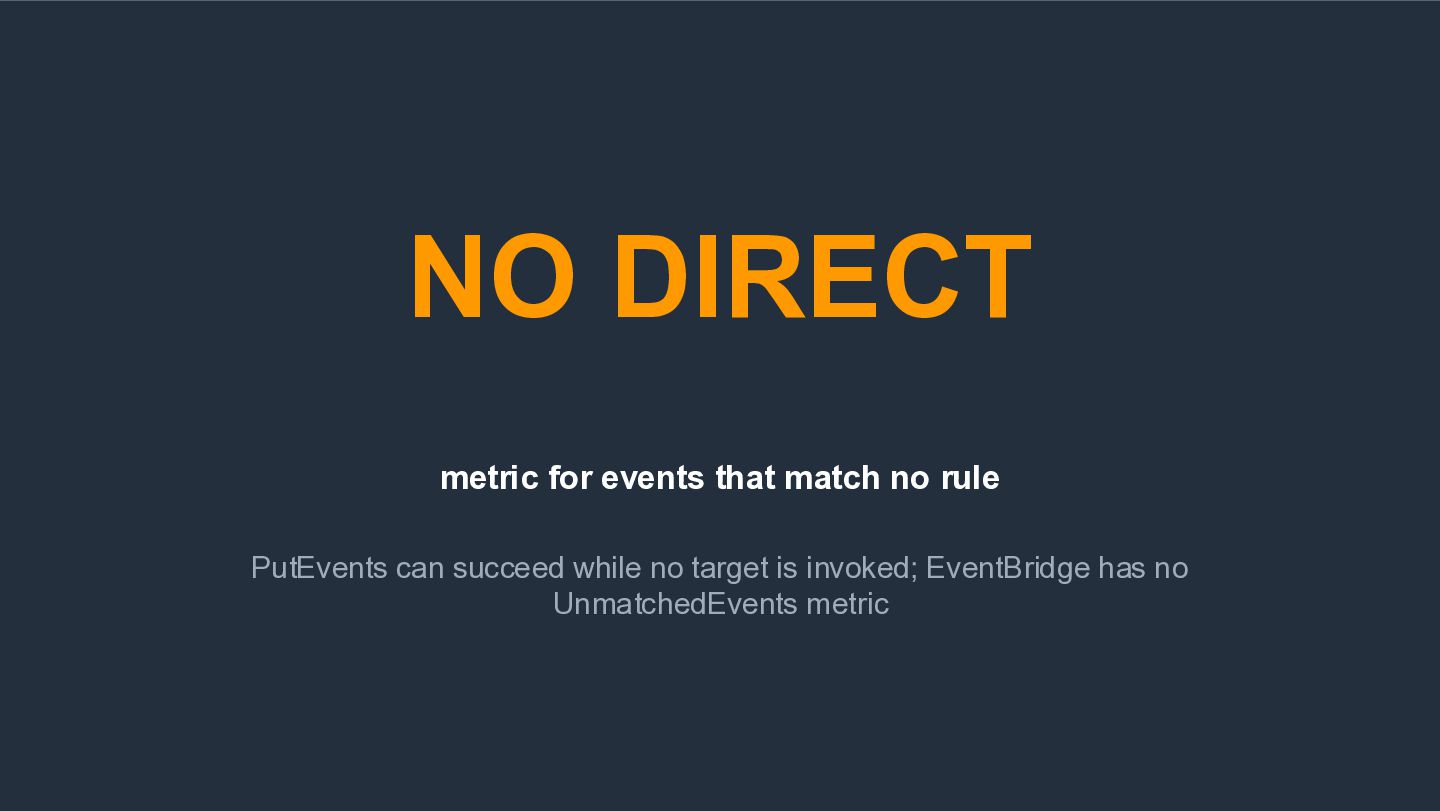
  5. NO DIRECT metric for events that match no rule PutEvents

    can succeed while no target is invoked; EventBridge has no UnmatchedEvents metric
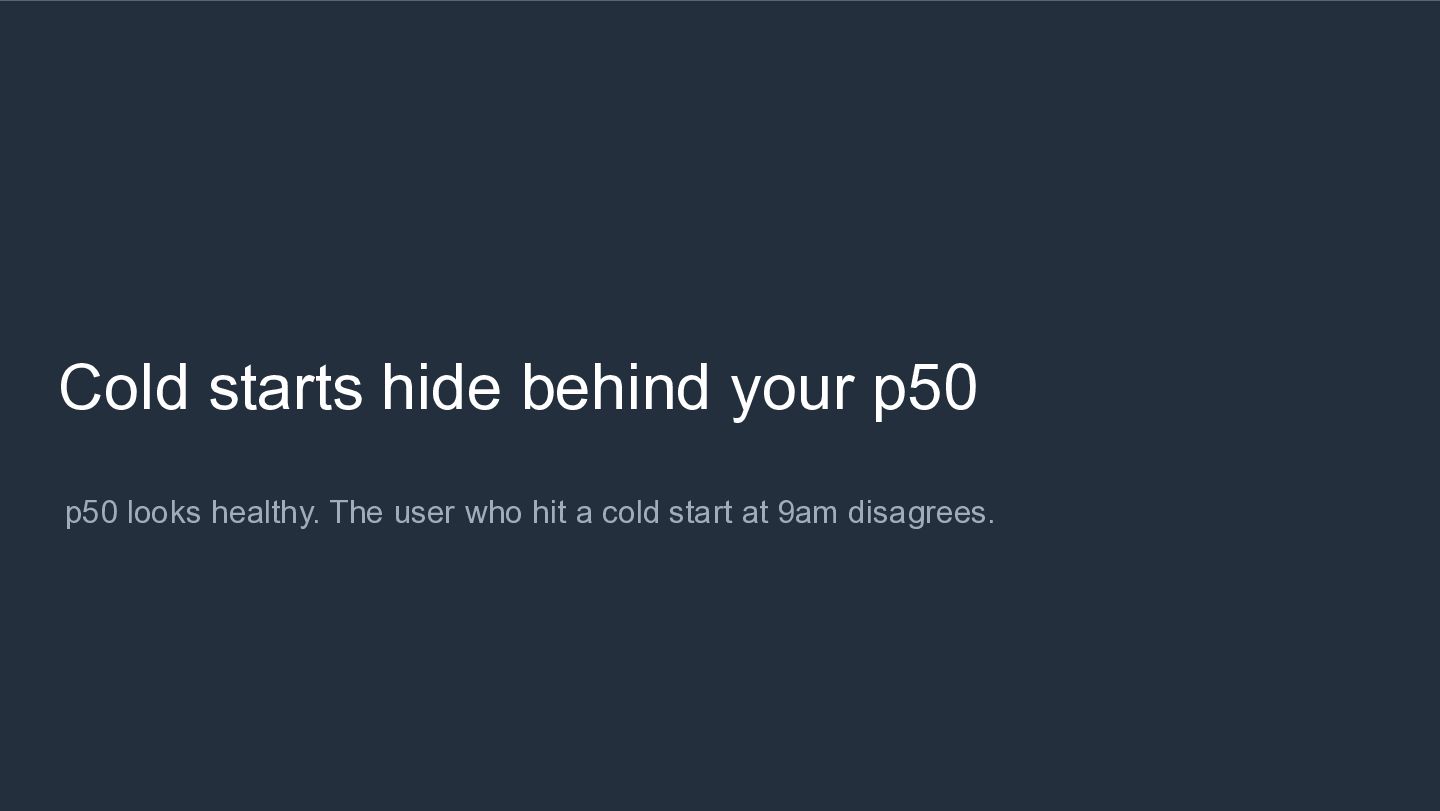
  6. Cold starts hide behind your p50 p50 looks healthy. The

    user who hit a cold start at 9am disagrees.
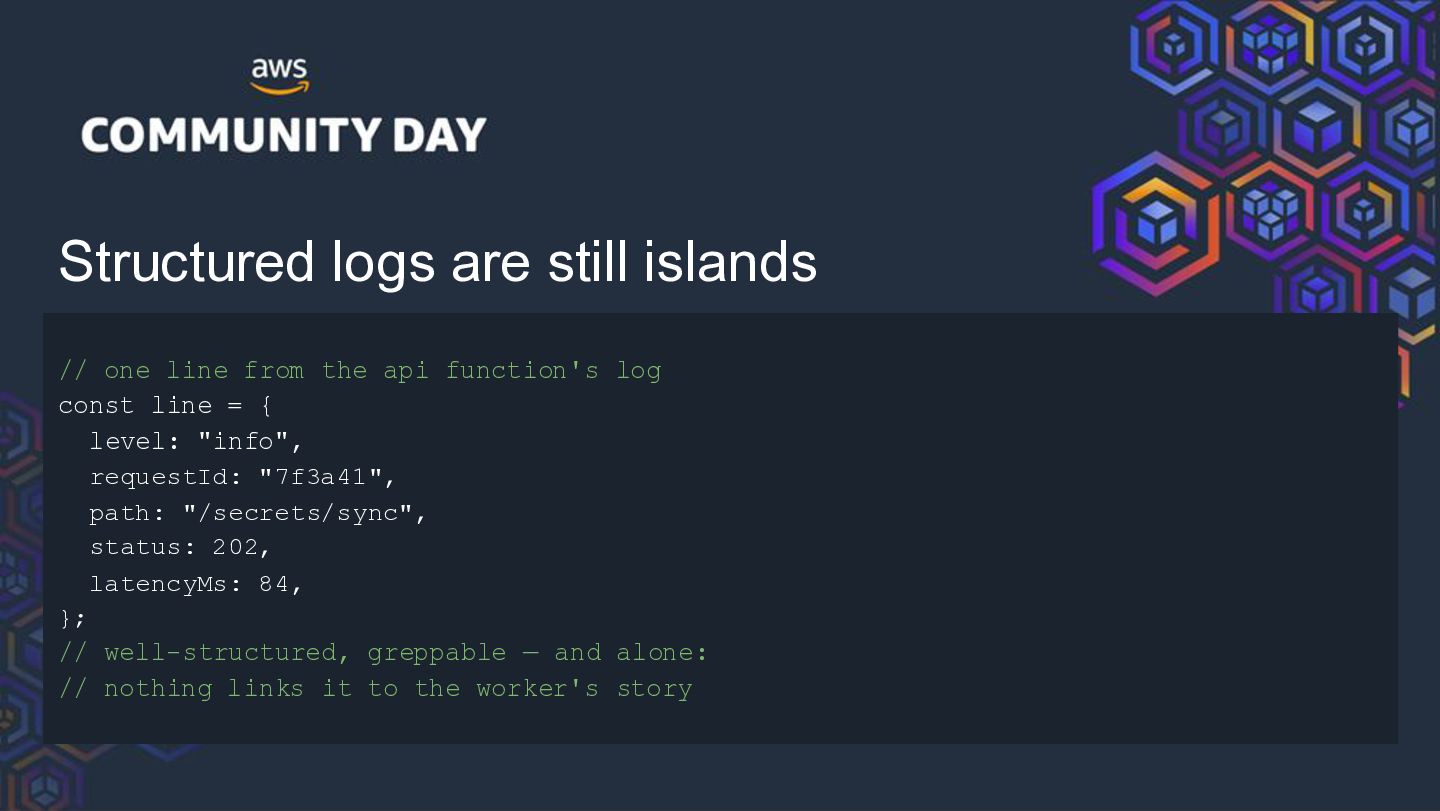
  7. Structured logs are still islands // one line from the

    api function's log const line = { level: "info", requestId: "7f3a41", path: "/secrets/sync", status: 202, latencyMs: 84, }; // well-structured, greppable — and alone: // nothing links it to the worker's story
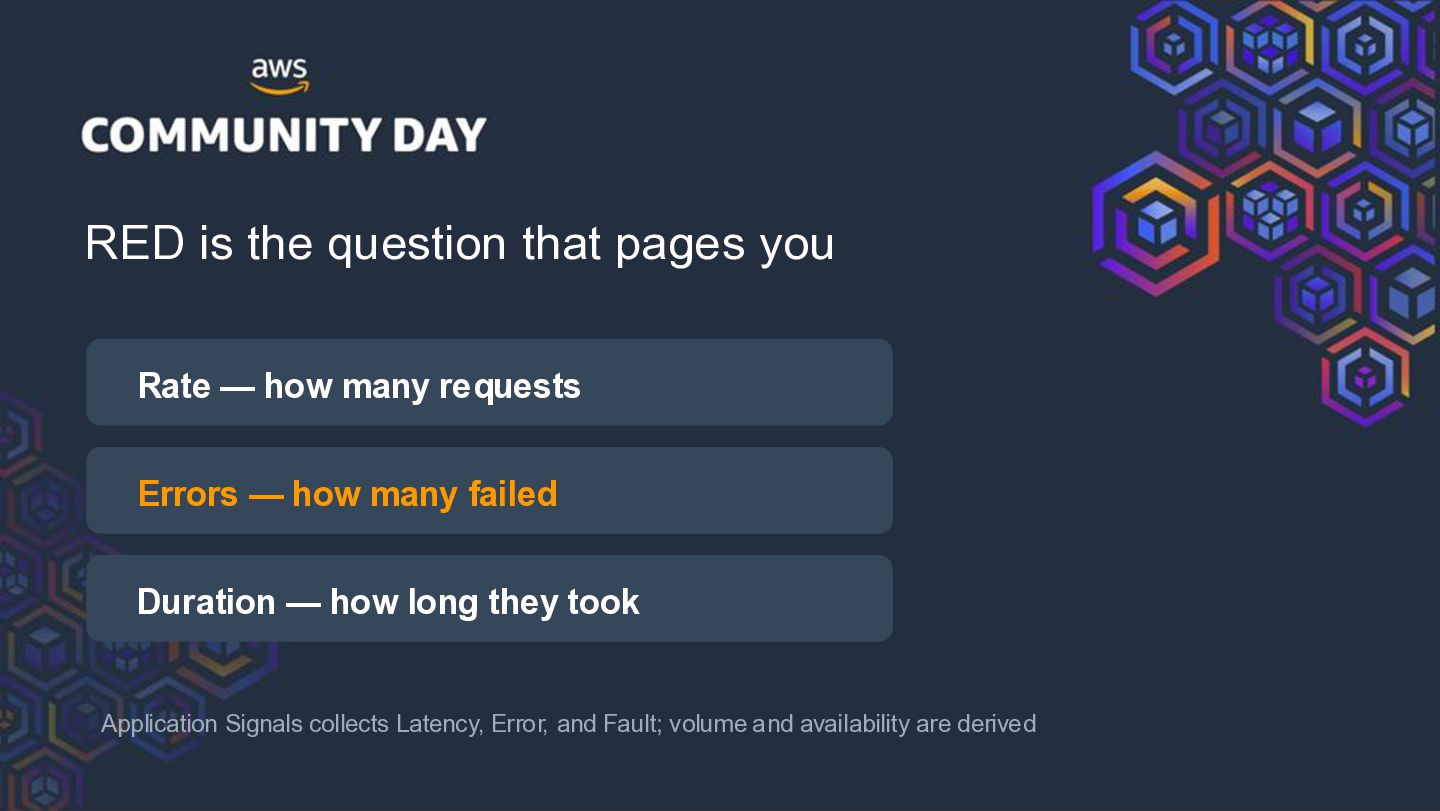
  8. RED is the question that pages you Rate — how

    many requests Errors — how many failed Duration — how long they took Application Signals collects Latency, Error, and Fault; volume and availability are derived
  9. Instrument the platform, not the code Lambda is ephemeral, async,

    and managed — telemetry belongs to the runtime
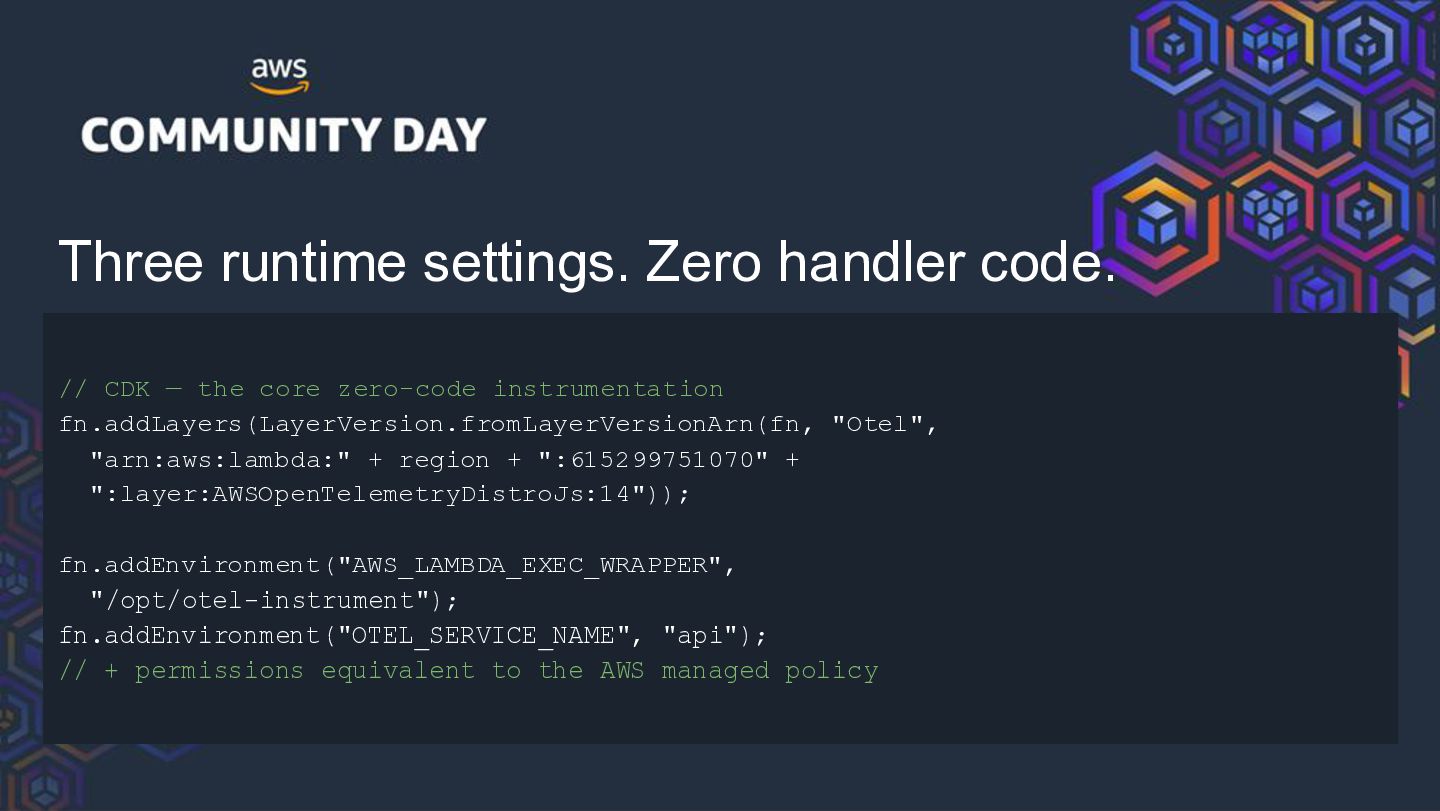
  10. Three runtime settings. Zero handler code. // CDK — the

    core zero-code instrumentation fn.addLayers(LayerVersion.fromLayerVersionArn(fn, "Otel", "arn:aws:lambda:" + region + ":615299751070" + ":layer:AWSOpenTelemetryDistroJs:14")); fn.addEnvironment("AWS_LAMBDA_EXEC_WRAPPER", "/opt/otel-instrument"); fn.addEnvironment("OTEL_SERVICE_NAME", "api"); // + permissions equivalent to the AWS managed policy
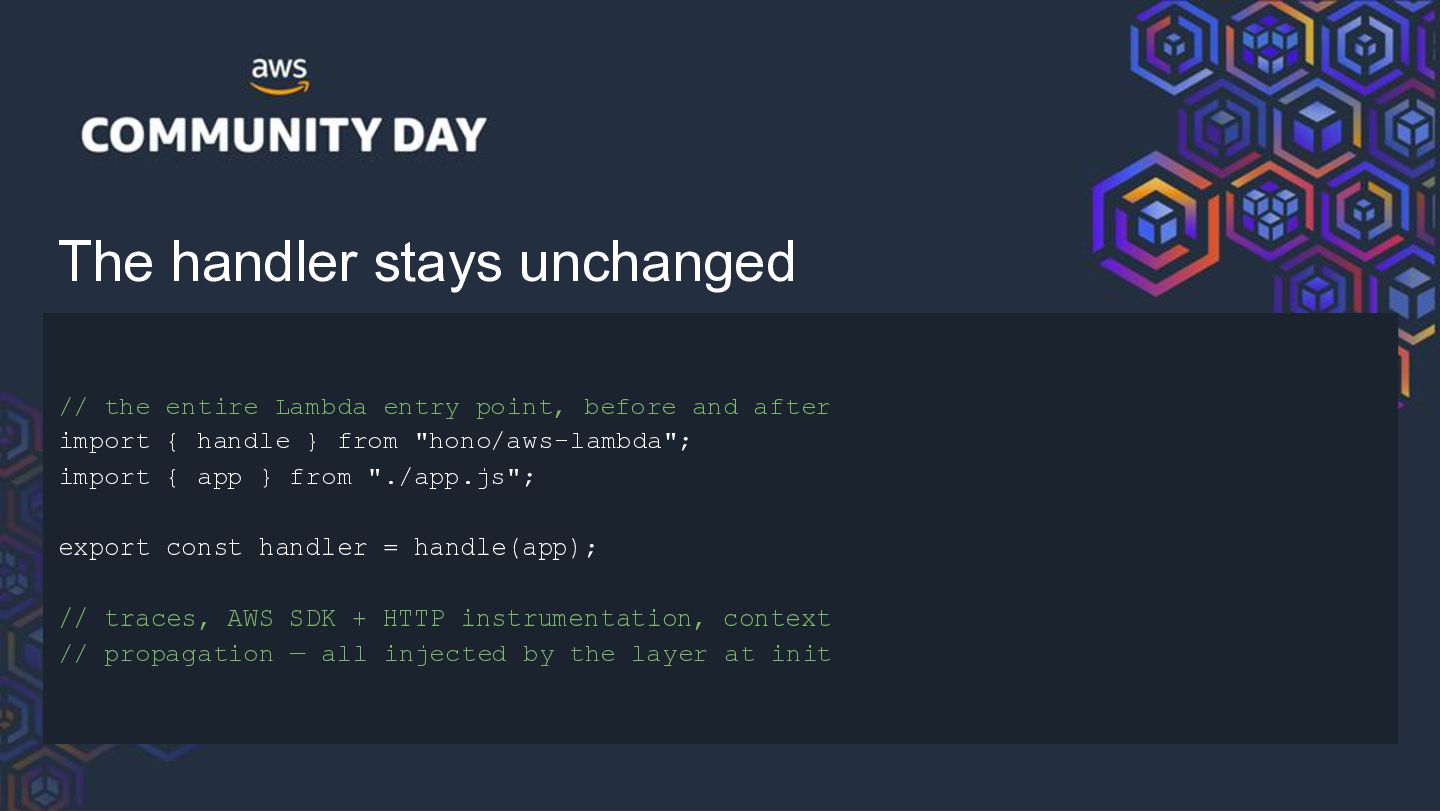
  11. The handler stays unchanged // the entire Lambda entry point,

    before and after import { handle } from "hono/aws-lambda"; import { app } from "./app.js"; export const handler = handle(app); // traces, AWS SDK + HTTP instrumentation, context // propagation — all injected by the layer at init
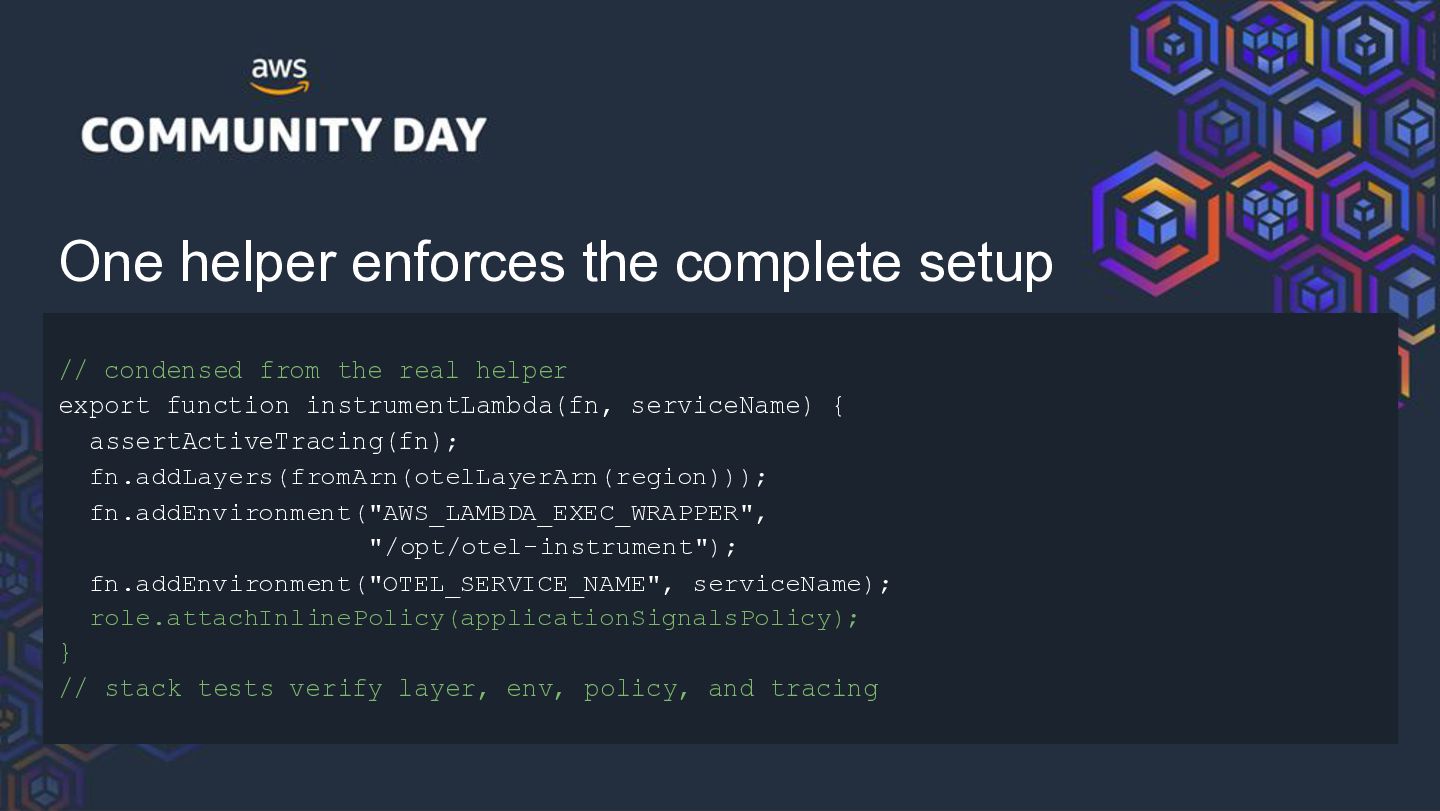
  12. One helper enforces the complete setup // condensed from the

    real helper export function instrumentLambda(fn, serviceName) { assertActiveTracing(fn); fn.addLayers(fromArn(otelLayerArn(region))); fn.addEnvironment("AWS_LAMBDA_EXEC_WRAPPER", "/opt/otel-instrument"); fn.addEnvironment("OTEL_SERVICE_NAME", serviceName); role.attachInlinePolicy(applicationSignalsPolicy); } // stack tests verify layer, env, policy, and tracing
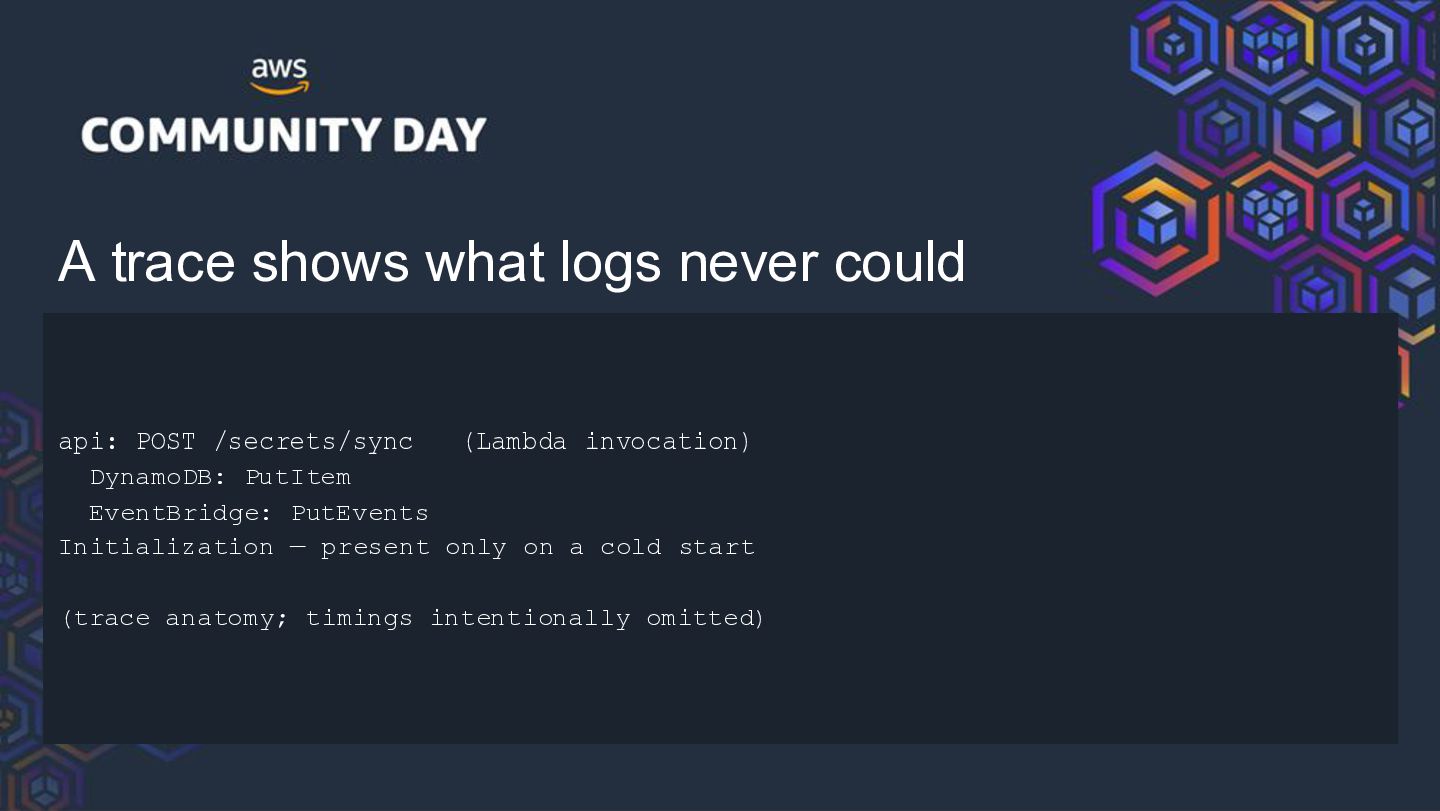
  13. A trace shows what logs never could api: POST /secrets/sync

    (Lambda invocation) DynamoDB: PutItem EventBridge: PutEvents Initialization — present only on a cold start (trace anatomy; timings intentionally omitted)
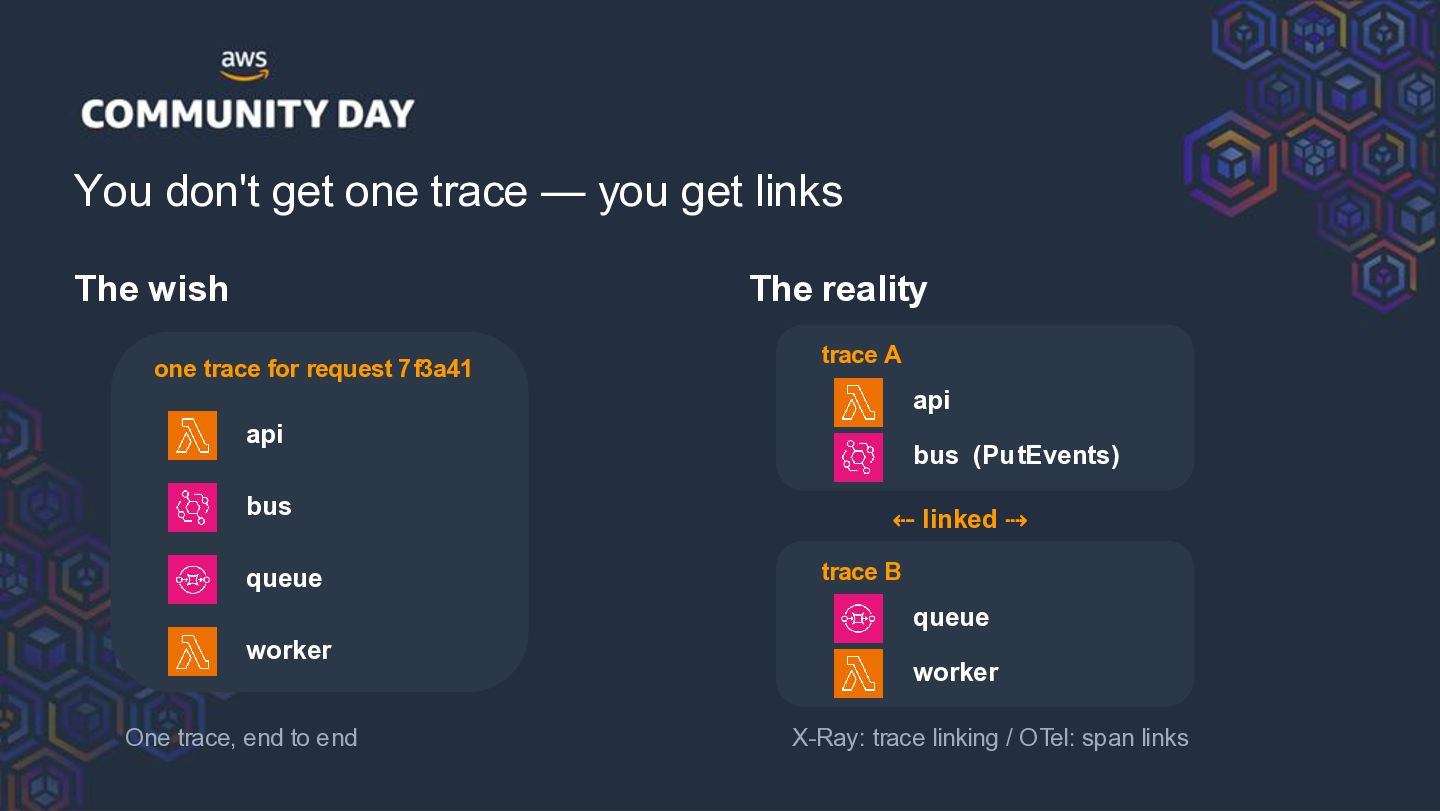
  14. You don't get one trace — you get links The

    wish The reality one trace for request 7f3a41 trace A api api bus queue bus (PutEvents) ⇠ linked ⇢ trace B queue worker One trace, end to end worker X-Ray: trace linking / OTel: span links
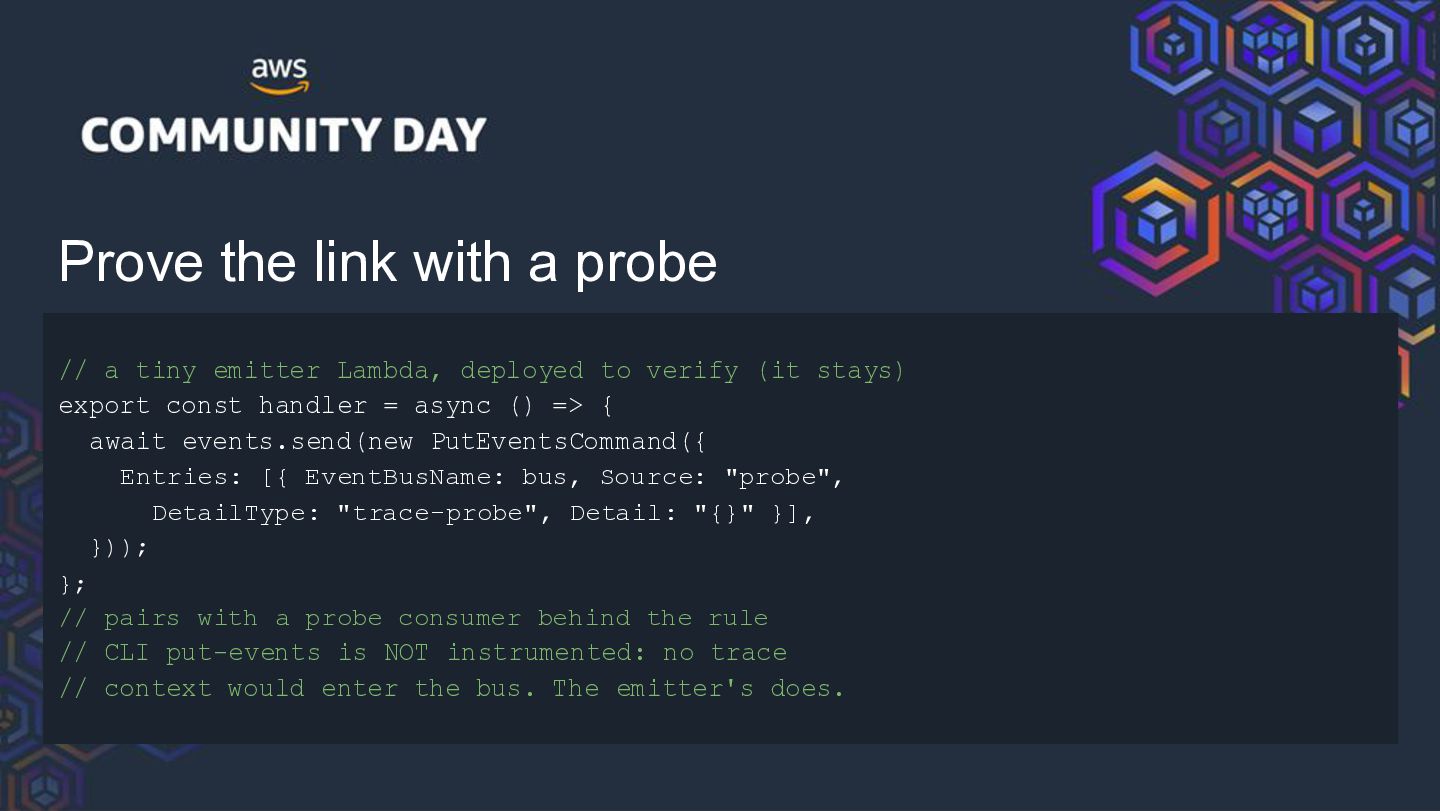
  15. Prove the link with a probe // a tiny emitter

    Lambda, deployed to verify (it stays) export const handler = async () => { await events.send(new PutEventsCommand({ Entries: [{ EventBusName: bus, Source: "probe", DetailType: "trace-probe", Detail: "{}" }], })); }; // pairs with a probe consumer behind the rule // CLI put-events is NOT instrumented: no trace // context would enter the bus. The emitter's does.
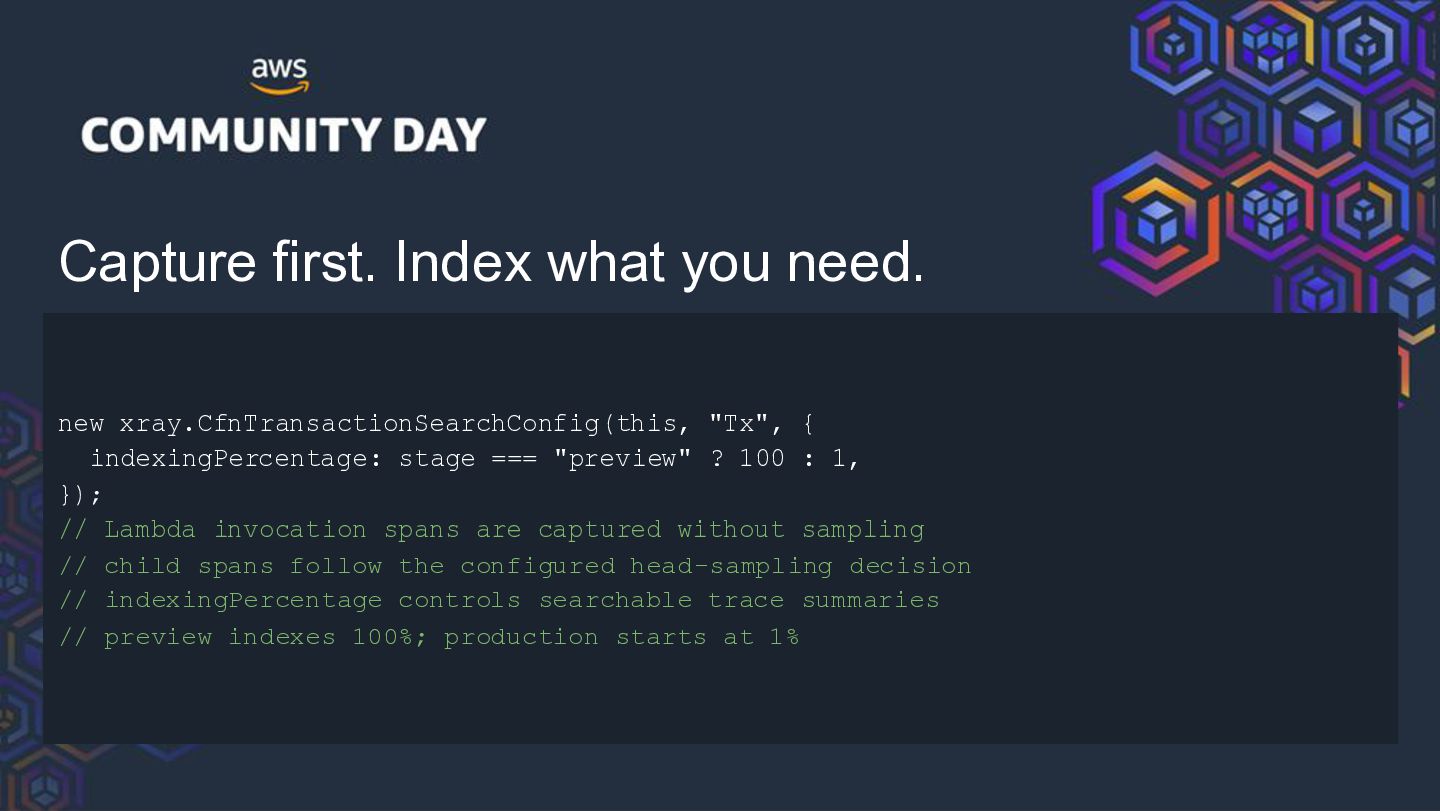
  16. Capture first. Index what you need. new xray.CfnTransactionSearchConfig(this, "Tx", {

    indexingPercentage: stage === "preview" ? 100 : 1, }); // Lambda invocation spans are captured without sampling // child spans follow the configured head-sampling decision // indexingPercentage controls searchable trace summaries // preview indexes 100%; production starts at 1%
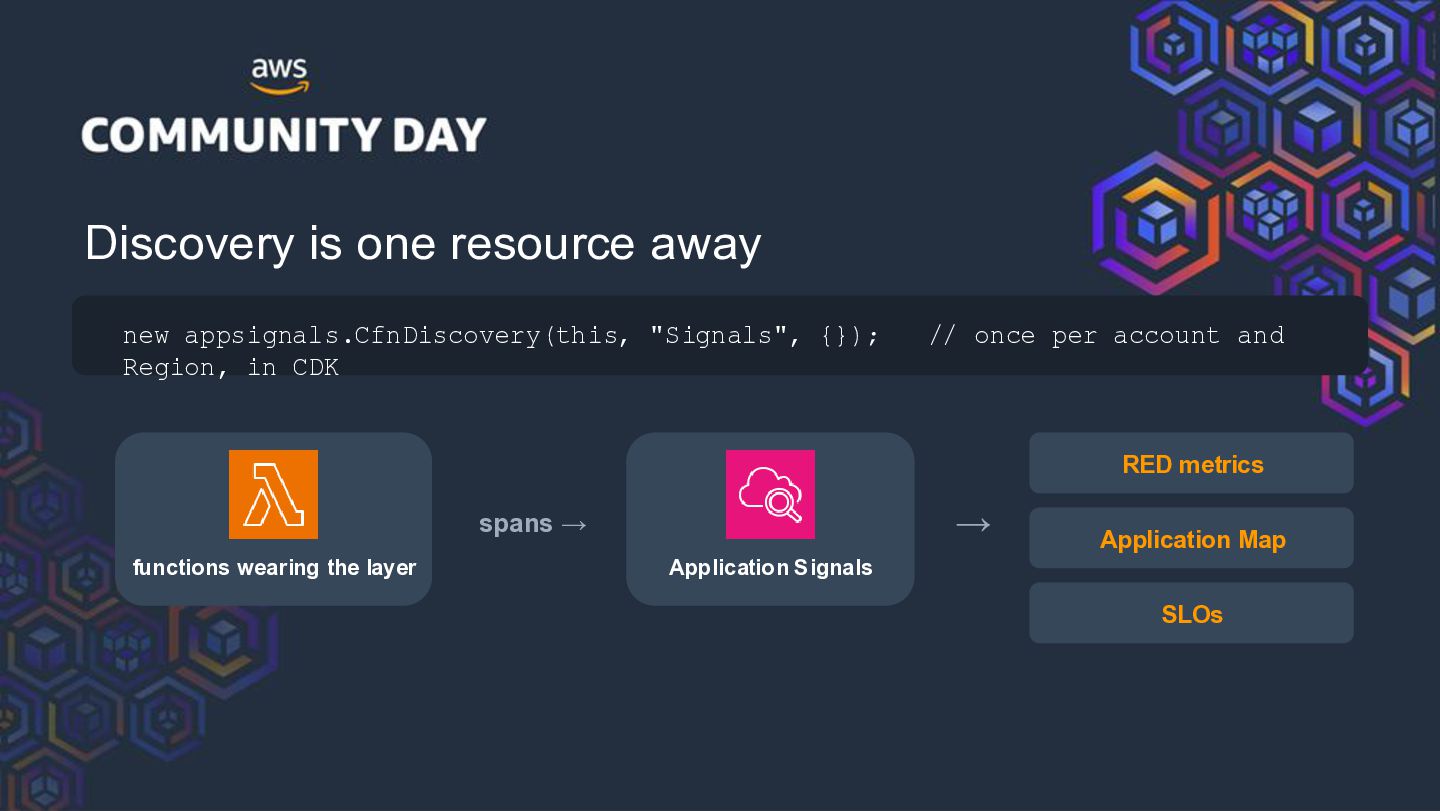
  17. Discovery is one resource away new appsignals.CfnDiscovery(this, "Signals", {}); Region,

    in CDK // once per account and RED metrics → spans → functions wearing the layer Application Map Application Signals SLOs
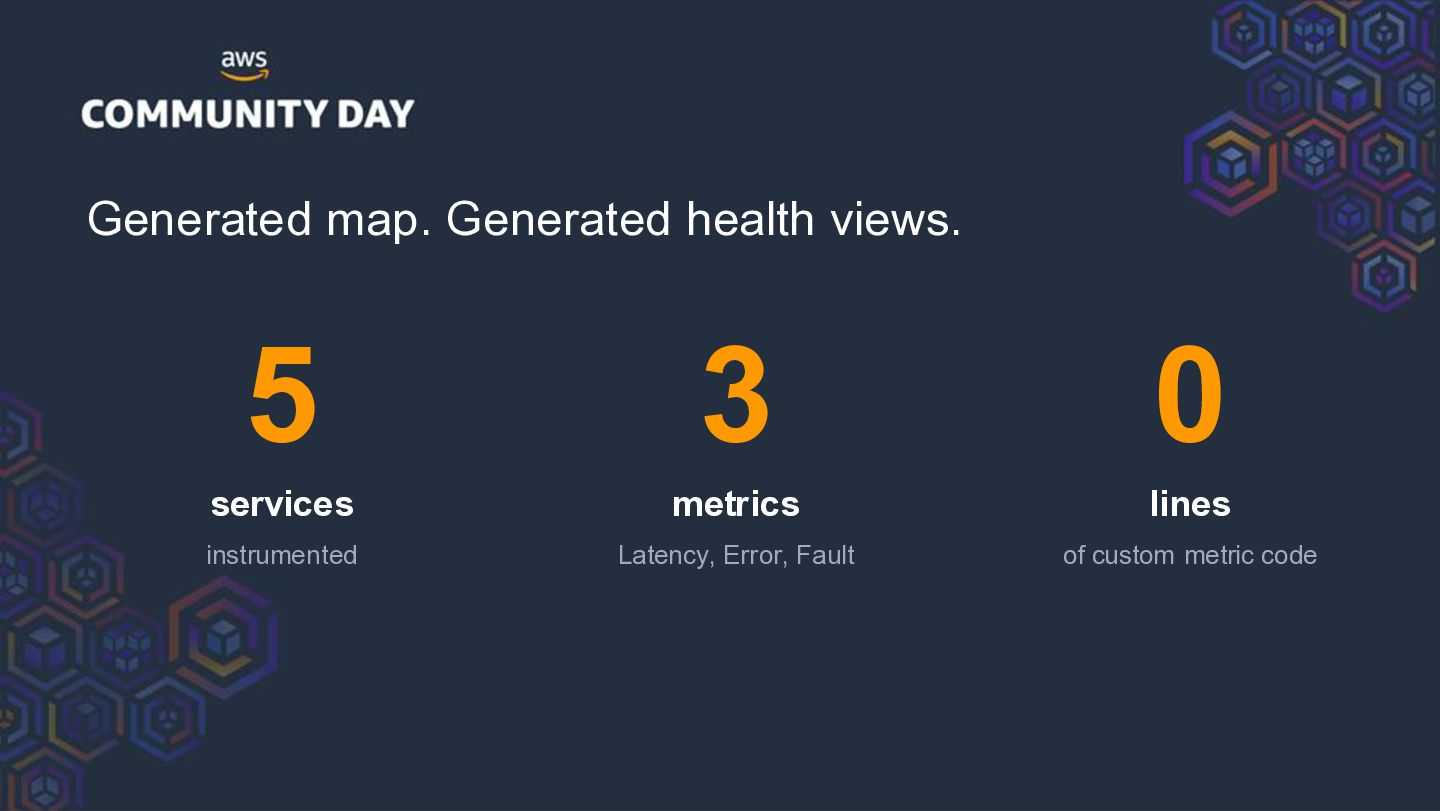
  18. Generated map. Generated health views. 5 3 0 services metrics

    lines instrumented Latency, Error, Fault of custom metric code
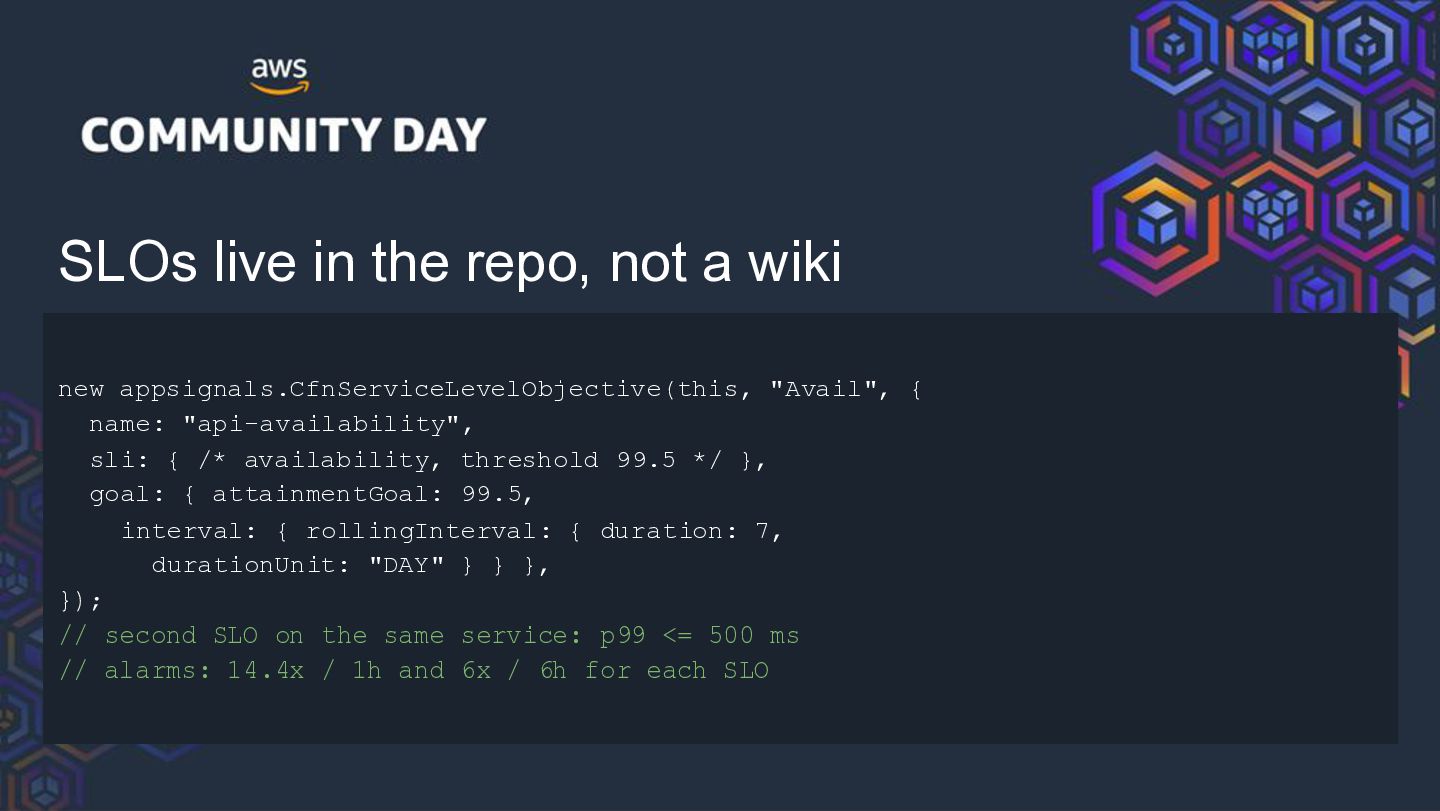
  19. SLOs live in the repo, not a wiki new appsignals.CfnServiceLevelObjective(this,

    "Avail", { name: "api-availability", sli: { /* availability, threshold 99.5 */ }, goal: { attainmentGoal: 99.5, interval: { rollingInterval: { duration: 7, durationUnit: "DAY" } } }, }); // second SLO on the same service: p99 <= 500 ms // alarms: 14.4x / 1h and 6x / 6h for each SLO
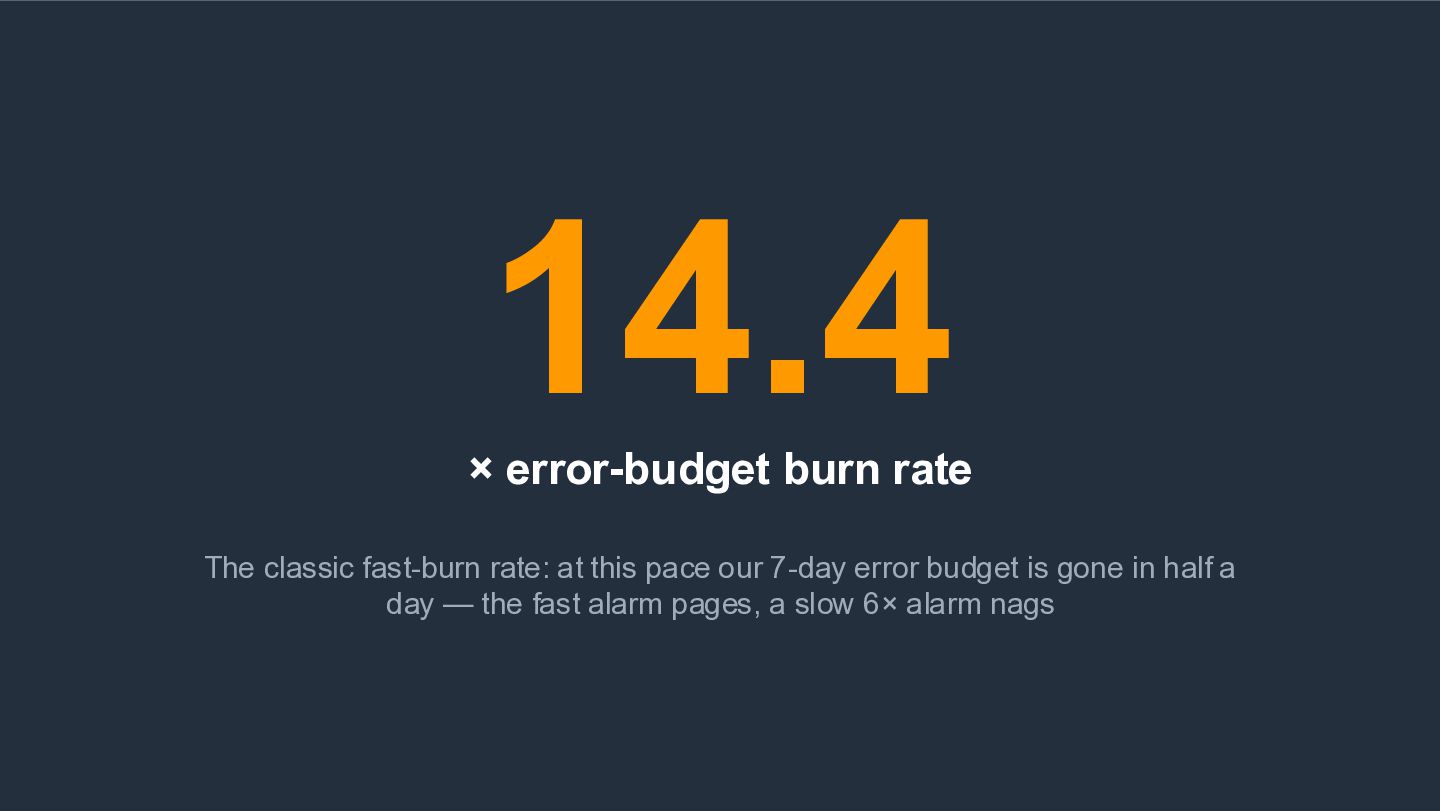
  20. 14.4 × error-budget burn rate The classic fast-burn rate: at

    this pace our 7-day error budget is gone in half a day — the fast alarm pages, a slow 6× alarm nags
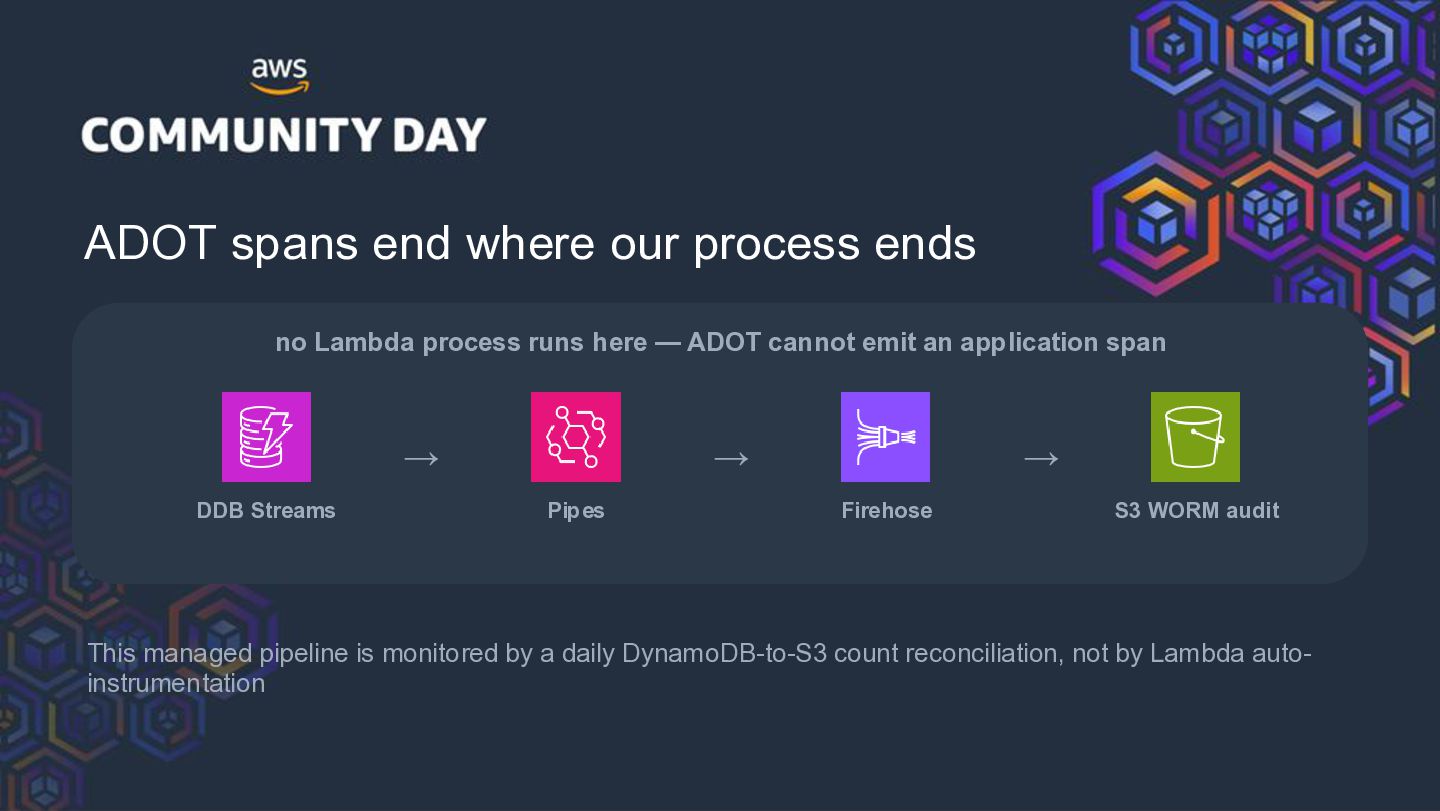
  21. ADOT spans end where our process ends no Lambda process

    runs here — ADOT cannot emit an application span → DDB Streams → Pipes → Firehose S3 WORM audit This managed pipeline is monitored by a daily DynamoDB-to-S3 count reconciliation, not by Lambda autoinstrumentation
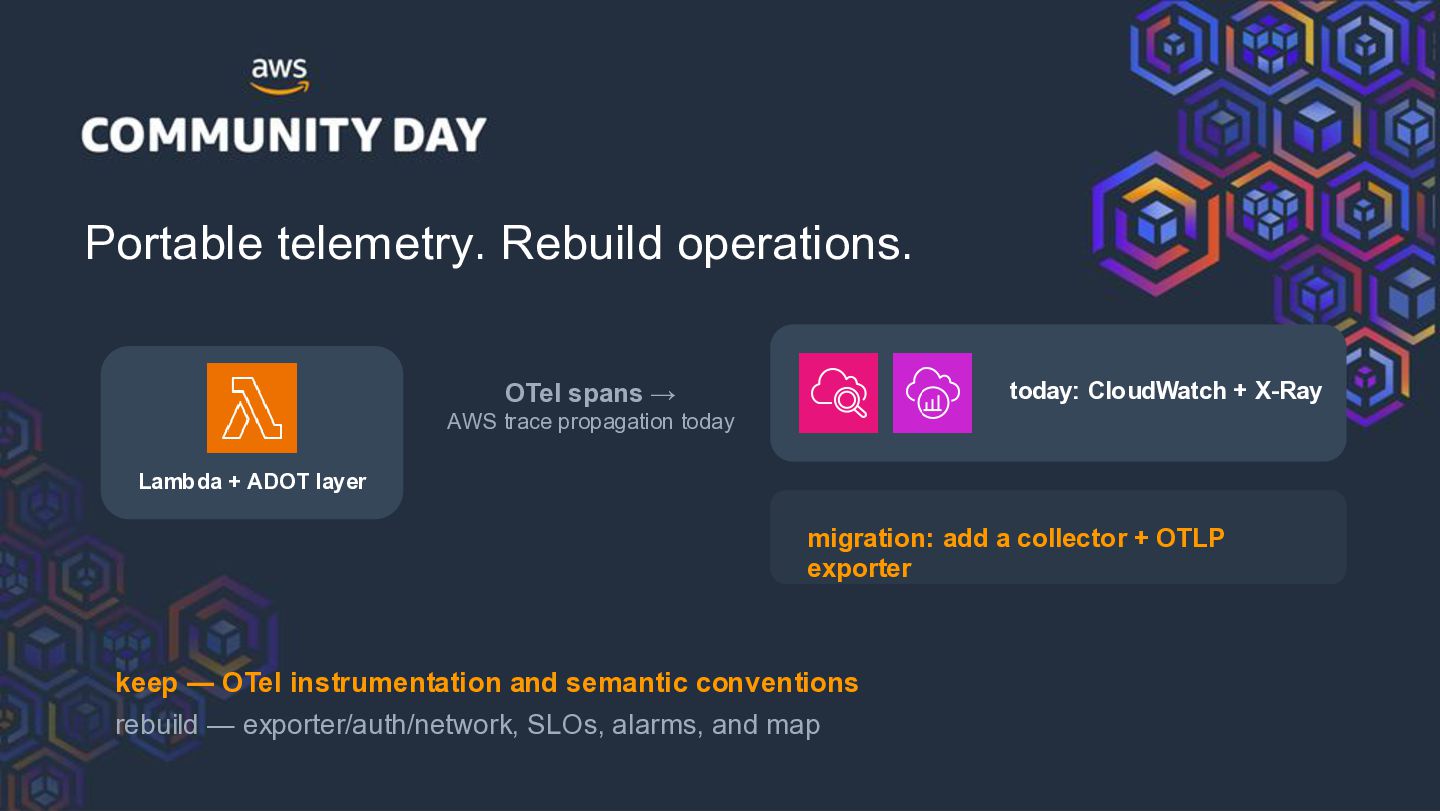
  22. Portable telemetry. Rebuild operations. today: CloudWatch + X-Ray OTel spans

    → AWS trace propagation today Lambda + ADOT layer migration: add a collector + OTLP exporter keep — OTel instrumentation and semantic conventions rebuild — exporter/auth/network, SLOs, alarms, and map
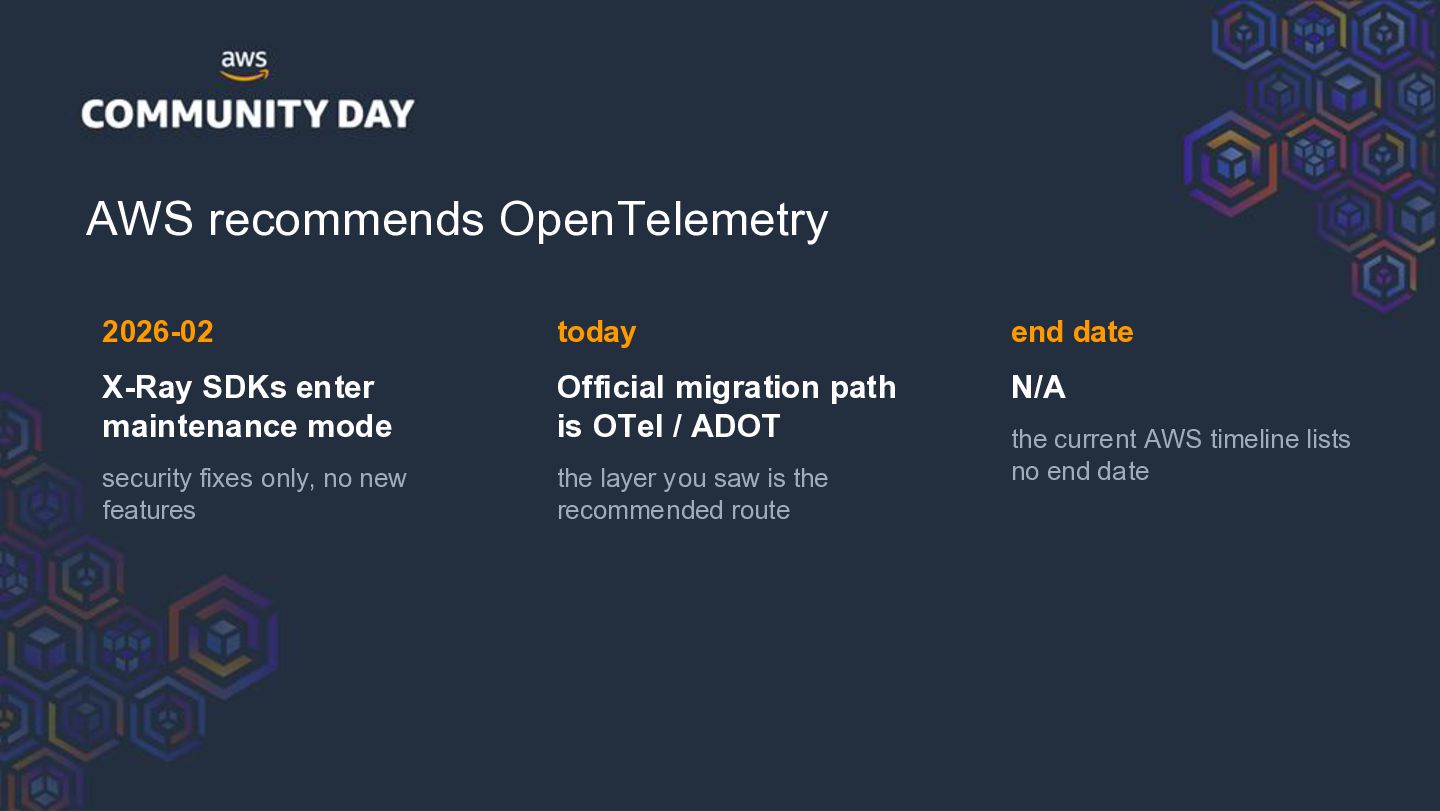
  23. AWS recommends OpenTelemetry 2026-02 today end date X-Ray SDKs enter

    maintenance mode Official migration path is OTel / ADOT N/A security fixes only, no new features the layer you saw is the recommended route the current AWS timeline lists no end date
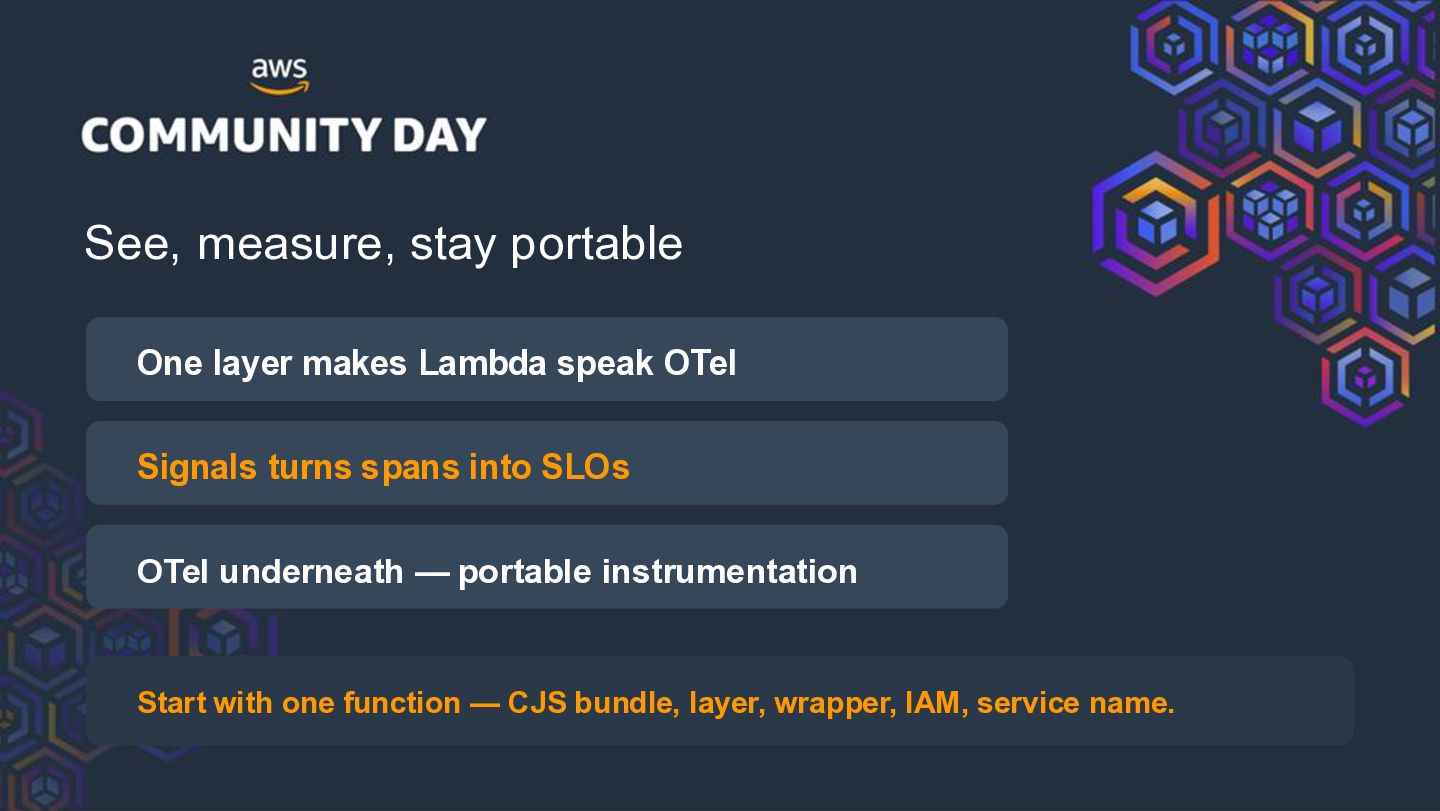
  24. See, measure, stay portable One layer makes Lambda speak OTel

    Signals turns spans into SLOs OTel underneath — portable instrumentation Start with one function — CJS bundle, layer, wrapper, IAM, service name.