Upgrade to Pro
— share decks privately, control downloads, hide ads and more …
Speaker Deck
Features
Speaker Deck
PRO
Sign in
Sign up for free
Search
Search
GitLab x Prometheus -Application Performance-
Search
Shingo.Kitayama
November 17, 2017
Technology
120
0
Share
Embed
Copy iframe code
Copy JS code
Copy link
Start on current slide
GitLab x Prometheus -Application Performance-
2017/11/17
GitLab Meetup Tokyo #5
https://gitlab-jp.connpass.com/event/69475/
Shingo.Kitayama
November 17, 2017
More Decks by Shingo.Kitayama
See All by Shingo.Kitayama
Introduction Konveyor AI - 2025
shkitayama
0
120
Why we expect the Microservices
shkitayama
2
560
Why run OpenShift on Google Cloud
shkitayama
1
400
Container Replatform 101
shkitayama
4
1.9k
Red Hat OpenShift Platform Plus - Red Hat Summit Connect 2022
shkitayama
0
830
NVIDIA AI Enterprise for Red Hat OpenShift
shkitayama
0
1.1k
Kubernetes CICD Pipelines Book
shkitayama
2
2.1k
Shipwright Overview
shkitayama
0
2k
CloudNative CICD in OpenShift Commons Japan
shkitayama
5
18k
Other Decks in Technology
See All in Technology
生成AI×AWS CDK×AWS FISで"振り返れる"ミニGameDayをつくろう
yoshimi0227
2
530
全社でのソフトウェアサプライチェーン攻撃対策をやってみた with Takumi Guard
z63d
0
270
生成 AI 時代にいま一度「問い合わせ」について考えてみる
kazzpapa3
1
130
SRENEXT_2026_Chairs__Talks_in_Tamachi.sre.pdf
srenext
1
140
Playwright × AI Agent でE2Eテストはどう変わるか AI駆動テストの可能性と実用検証の結果
taiga7543
2
800
それでも、技術なブログを書く理由 #kichijojipm / Why I Still Write Tech Blogs Even Now
shinkufencer
0
380
ここは地獄!つらい朝会を体験することで、チームとしてのより良い振る舞いに気づくワークショップ / The stand-up meeting from hell in the game industry
scrummasudar
0
220
AIコード生成×サプライチェーン攻撃 — PHPが直面する“二重の信頼問題
shinyasaita
0
450
クラウドを使う側から、作る側へ / 大吉祥寺.pm 2026前夜祭
fujiwara3
4
1.2k
【公開用】AI_Dev_Ex2026_AI_登壇資料
matsuritechnologies
PRO
1
480
穢れた技術選定について
watany
19
6.1k
AI_Dev_Day_製造業領域でのAI活用から見た活用の罠と成功に導く実践知.pdf
kintotechdev
0
160
Featured
See All Featured
Marketing to machines
jonoalderson
1
5.6k
Hiding What from Whom? A Critical Review of the History of Programming languages for Music
tomoyanonymous
3
1k
Designing Dashboards & Data Visualisations in Web Apps
destraynor
231
55k
RailsConf 2023
tenderlove
30
1.5k
Building an army of robots
kneath
306
46k
Applied NLP in the Age of Generative AI
inesmontani
PRO
4
2.4k
Facilitating Awesome Meetings
lara
57
7k
The browser strikes back
jonoalderson
0
1.4k
Mozcon NYC 2025: Stop Losing SEO Traffic
samtorres
1
410
Digital Ethics as a Driver of Design Innovation
axbom
PRO
1
350
Sharpening the Axe: The Primacy of Toolmaking
bcantrill
46
2.9k
Being A Developer After 40
akosma
91
590k
Transcript
GitLab x Prometheus デプロイアプリのPerformance測定 Shingo.Kitayama 2017/11/17 GitLab Meetup Tokyo #5
https://gitlab-jp.connpass.com/event/69475/
Introduction GitLab x Prometheus 2 日本ヒューレット・パッカード株式会社 テクニカルアーキテクト ・オープンソースソリューションの提案 ・コンサルティング、および構築デリバリーを担当 Now
on Sale
Introduction ITmediaエンタープライズ 連載中 3 変化を拒むおっさんに 喝をいれる連載 執筆中!! お仕事の息抜き&気分転換に ご覧ください。
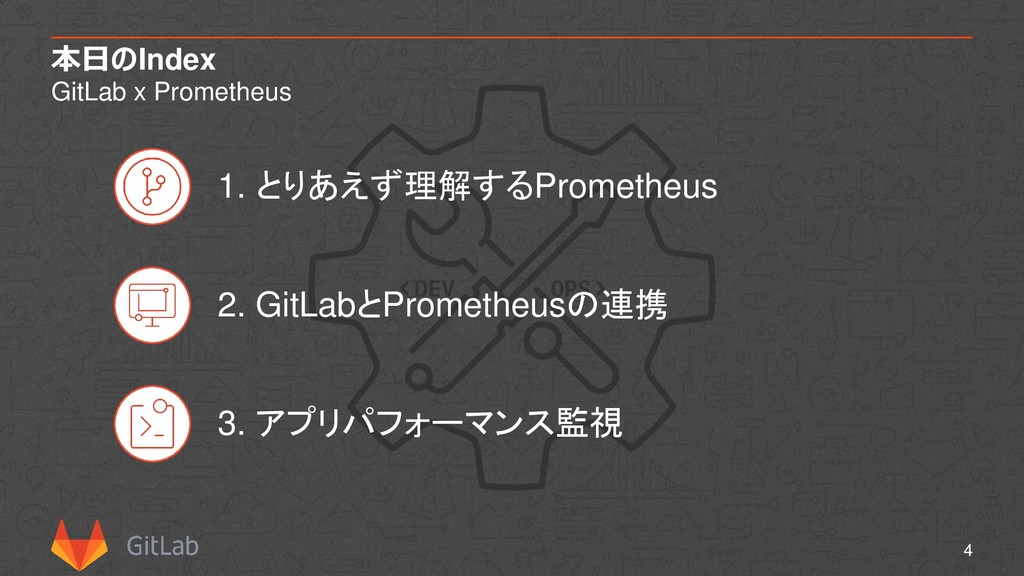
本日のIndex GitLab x Prometheus 4 1. とりあえず理解するPrometheus 2. GitLabとPrometheusの連携 3.
アプリパフォーマンス監視
1. とりあえず理解するPrometheus 5 - What’s Prometheus -
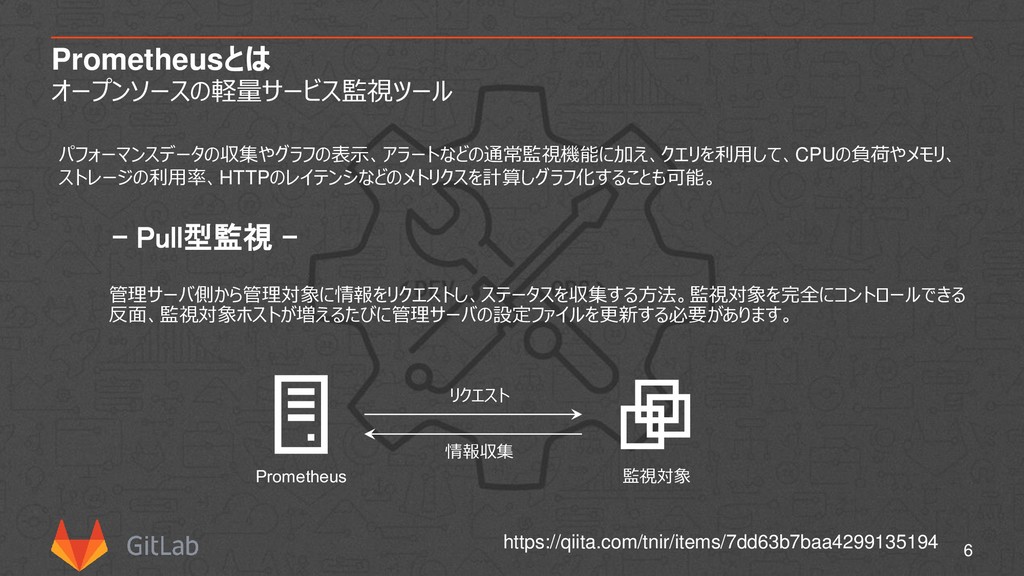
Prometheusとは オープンソースの軽量サービス監視ツール 6 https://qiita.com/tnir/items/7dd63b7baa4299135194 パフォーマンスデータの収集やグラフの表示、アラートなどの通常監視機能に加え、クエリを利用して、CPUの負荷やメモリ、 ストレージの利用率、HTTPのレイテンシなどのメトリクスを計算しグラフ化することも可能。 - Pull型監視 - 監視対象
Prometheus 管理サーバ側から管理対象に情報をリクエストし、ステータスを収集する方法。監視対象を完全にコントロールできる 反面、監視対象ホストが増えるたびに管理サーバの設定ファイルを更新する必要があります。 情報収集 リクエスト
Prometheusの仕組み Prometheus Architecture 7 監視対象 Prometheus Server Retrieval PromQL ローカル
ストレージ Storage 監視対象プロセス Exporter 情報収集 リクエスト ジョブプログラム PushGateway リクエスト 情報収集 情報送信 Alert manager Web UI ・ Grafana ・ API Client アラート送信 mail slack web hook Expression Browser 『メトリクスの収集/格納』 『アラートの通知』 『クエリの返答』
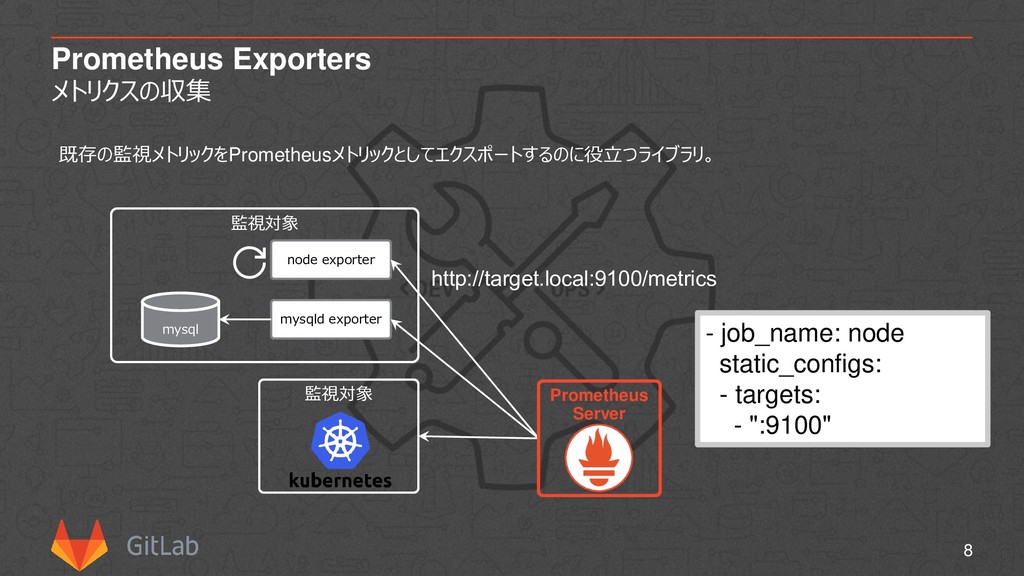
Prometheus Exporters メトリクスの収集 8 監視対象 node exporter mysqld exporter mysql
監視対象 既存の監視メトリックをPrometheusメトリックとしてエクスポートするのに役立つライブラリ。 http://target.local:9100/metrics - job_name: node static_configs: - targets: - ":9100" Prometheus Server
2. GitLabとPrometheusの連携 9 - Prometheus within GitLab -
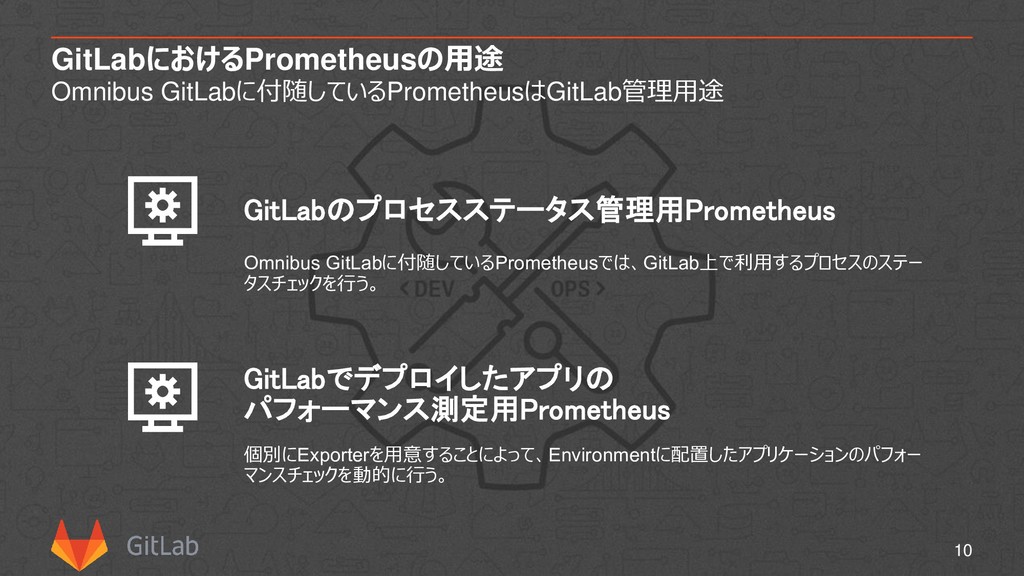
GitLabにおけるPrometheusの用途 Omnibus GitLabに付随しているPrometheusはGitLab管理用途 10 GitLabのプロセスステータス管理用Prometheus GitLabでデプロイしたアプリの パフォーマンス測定用Prometheus Omnibus GitLabに付随しているPrometheusでは、GitLab上で利用するプロセスのステー タスチェックを行う。
個別にExporterを用意することによって、Environmentに配置したアプリケーションのパフォー マンスチェックを動的に行う。
GitLabのプロセスステータス管理用Prometheus Exporters for Process Status 11 Exporters ステータス内容 ポート Node
exporter メモリ、ディスク、CPU使用率などのマ シンリソースの測定 localhost:9100 Redis exporter Redisプロセスのリソース測定 localhost:9121 Postgres exporter ProstgreSQLプロセスのリソース測定 localhost:9187 GitLab monitor exporter DatabaseやGit、SidekiqなどのGitLab に関するリソース測定 localhost:9168
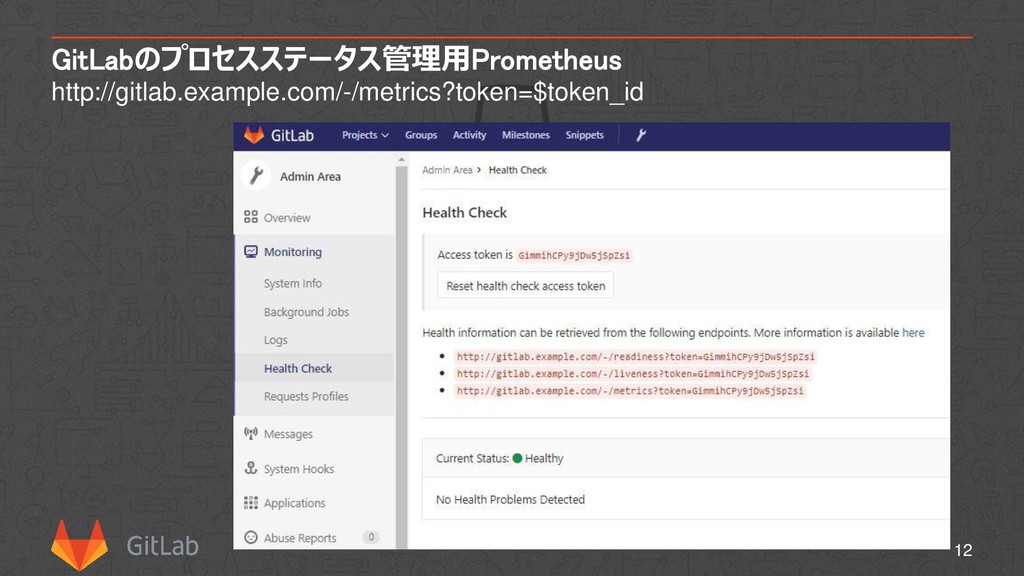
GitLabのプロセスステータス管理用Prometheus http://gitlab.example.com/-/metrics?token=$token_id 12
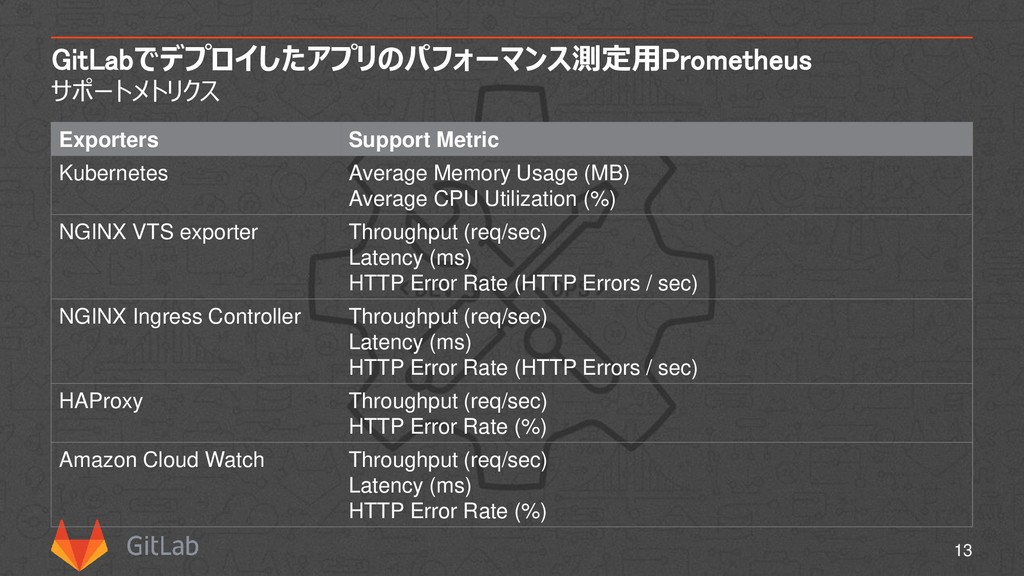
GitLabでデプロイしたアプリのパフォーマンス測定用Prometheus サポートメトリクス 13 Exporters Support Metric Kubernetes Average Memory Usage
(MB) Average CPU Utilization (%) NGINX VTS exporter Throughput (req/sec) Latency (ms) HTTP Error Rate (HTTP Errors / sec) NGINX Ingress Controller Throughput (req/sec) Latency (ms) HTTP Error Rate (HTTP Errors / sec) HAProxy Throughput (req/sec) HTTP Error Rate (%) Amazon Cloud Watch Throughput (req/sec) Latency (ms) HTTP Error Rate (%)
3. アプリパフォーマンス監視 14 - Performance Monitoring -
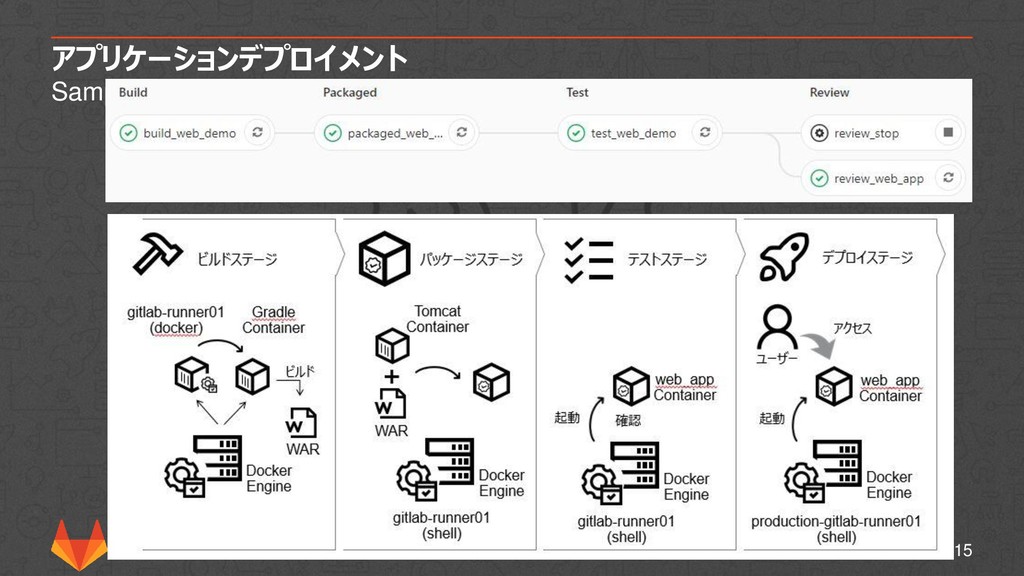
アプリケーションデプロイメント Sample Application 15
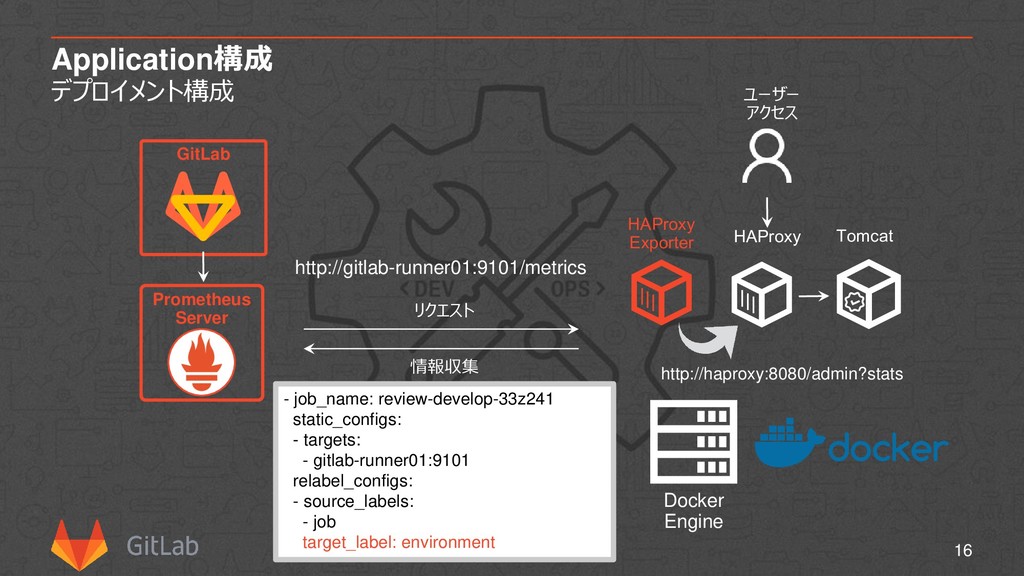
Application構成 デプロイメント構成 16 Docker Engine Prometheus Server GitLab 情報収集 リクエスト
http://haproxy:8080/admin?stats HAProxy Exporter http://gitlab-runner01:9101/metrics HAProxy Tomcat ユーザー アクセス - job_name: review-develop-33z241 static_configs: - targets: - gitlab-runner01:9101 relabel_configs: - source_labels: - job target_label: environment
Demo 17 でも(時間があったら
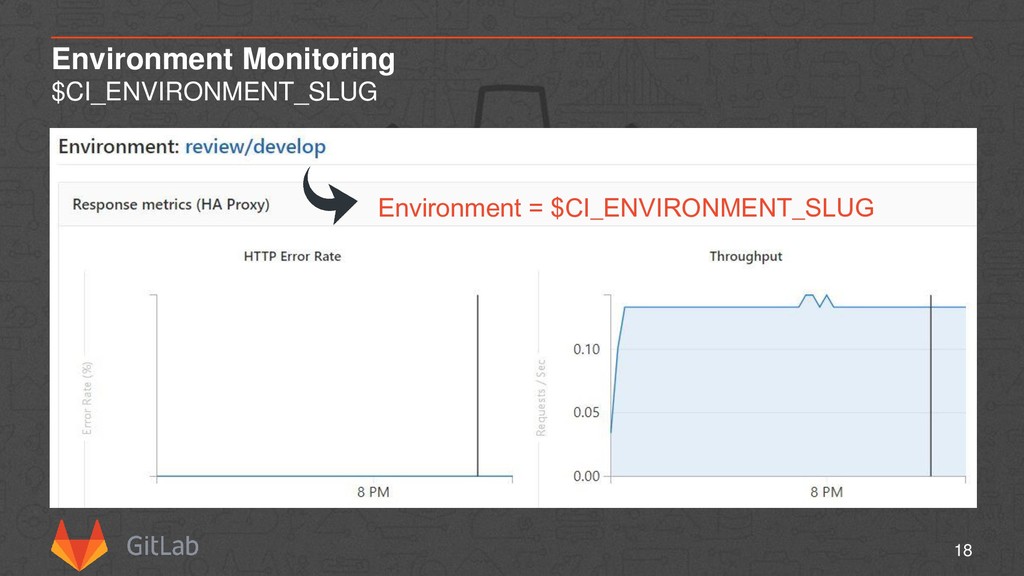
Environment Monitoring $CI_ENVIRONMENT_SLUG 18 Environment = $CI_ENVIRONMENT_SLUG
19 Thank you