Upgrade to Pro — share decks privately, control downloads, hide ads and more …

bpftrace: a swiss army knife tracing tool — SUS...

Sponsored · SiteGround - Reliable hosting with speed, security, and support you can count on.

bpftrace: a swiss army knife tracing tool — SUSE Labs Conference 2026

This talk will give a quick introduction to bpftrace, an awk-like scripting language powered by BPF that specializes in tracing. We'll go through its concept, syntax, and provide a few example usage to see it in action, and finally close with a comparison with other existing tracing tools (bcc, ftrace, LTTng, systemtap, to name a few).

Avatar for shunghsiyu

shunghsiyu

May 18, 2026

More Decks by shunghsiyu

Other Decks in Technology

Transcript

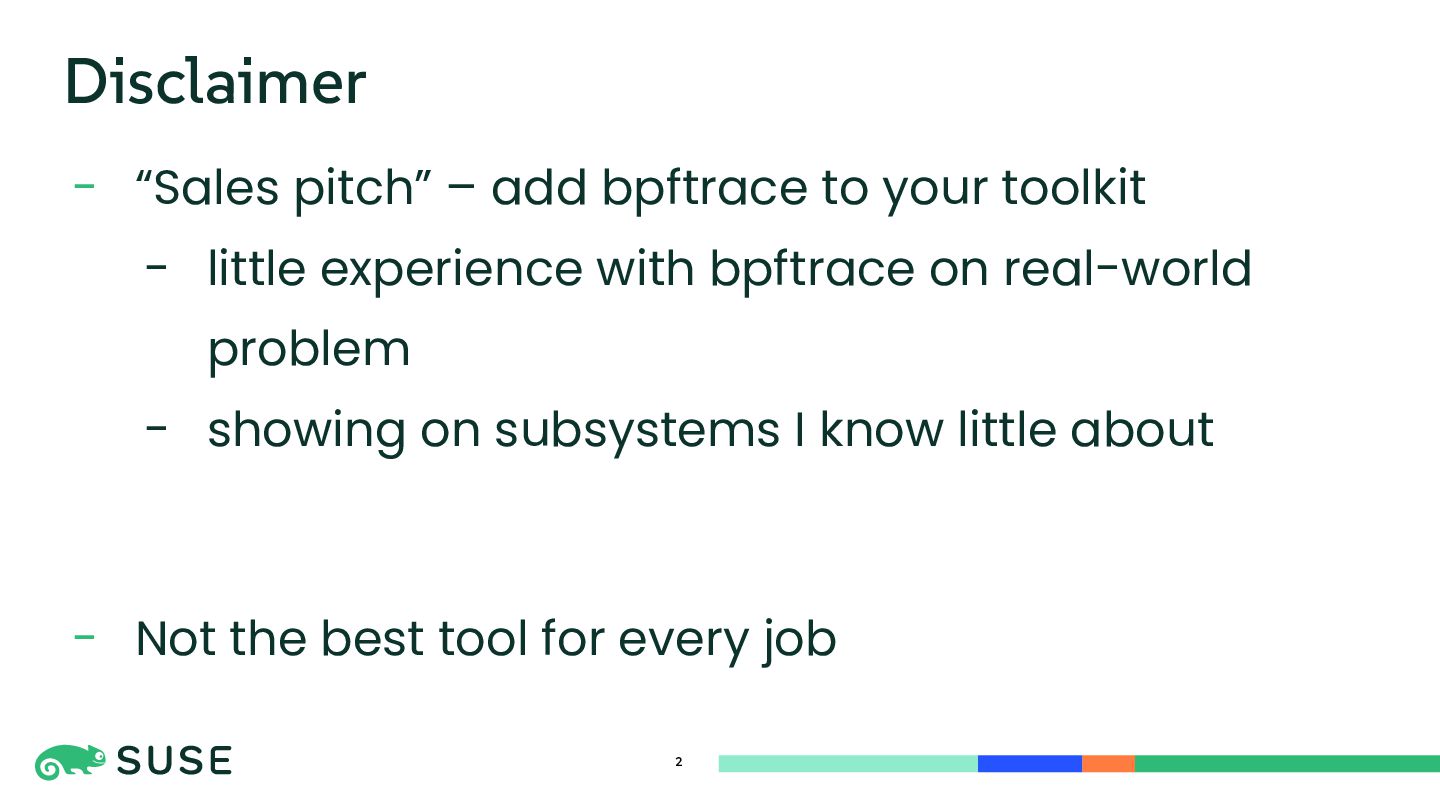
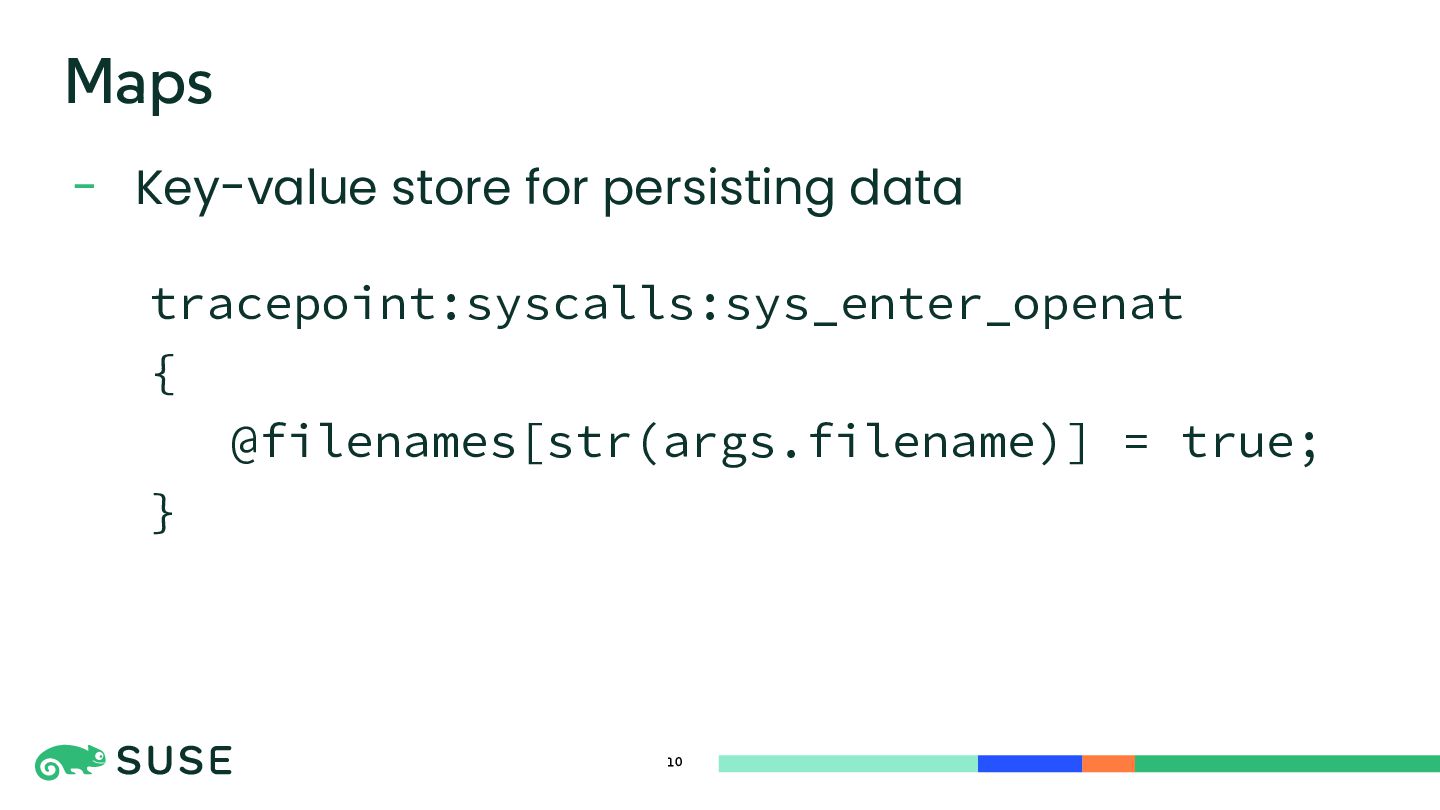
  1. - “Sales pitch” – add bpftrace to your toolkit -

    little experience with bpftrace on real-world problem - showing on subsystems I know little about - Not the best tool for every job 2 Disclaimer
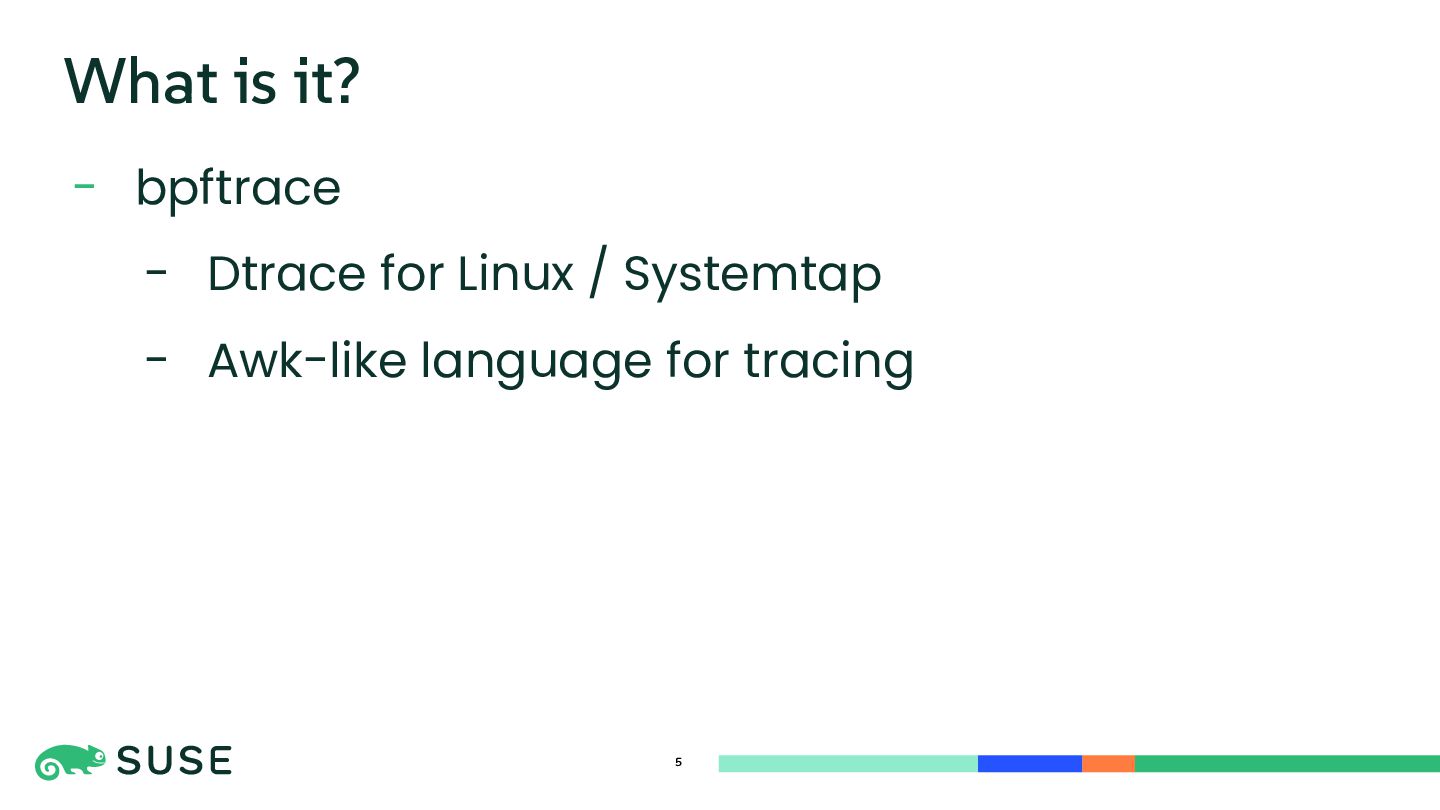
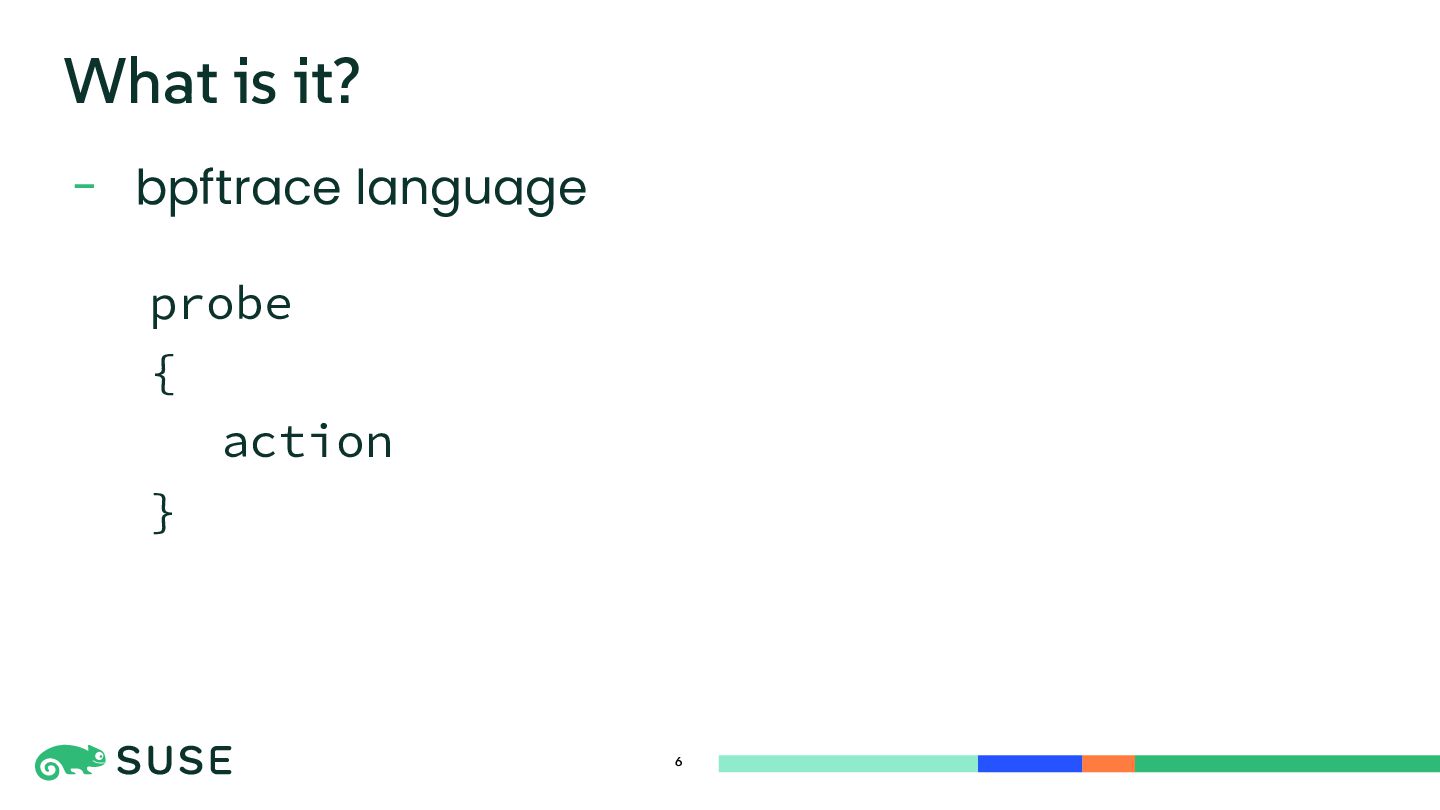
  2. - bpftrace - Dtrace for Linux / Systemtap - Awk-like

    language for tracing 5 What is it?
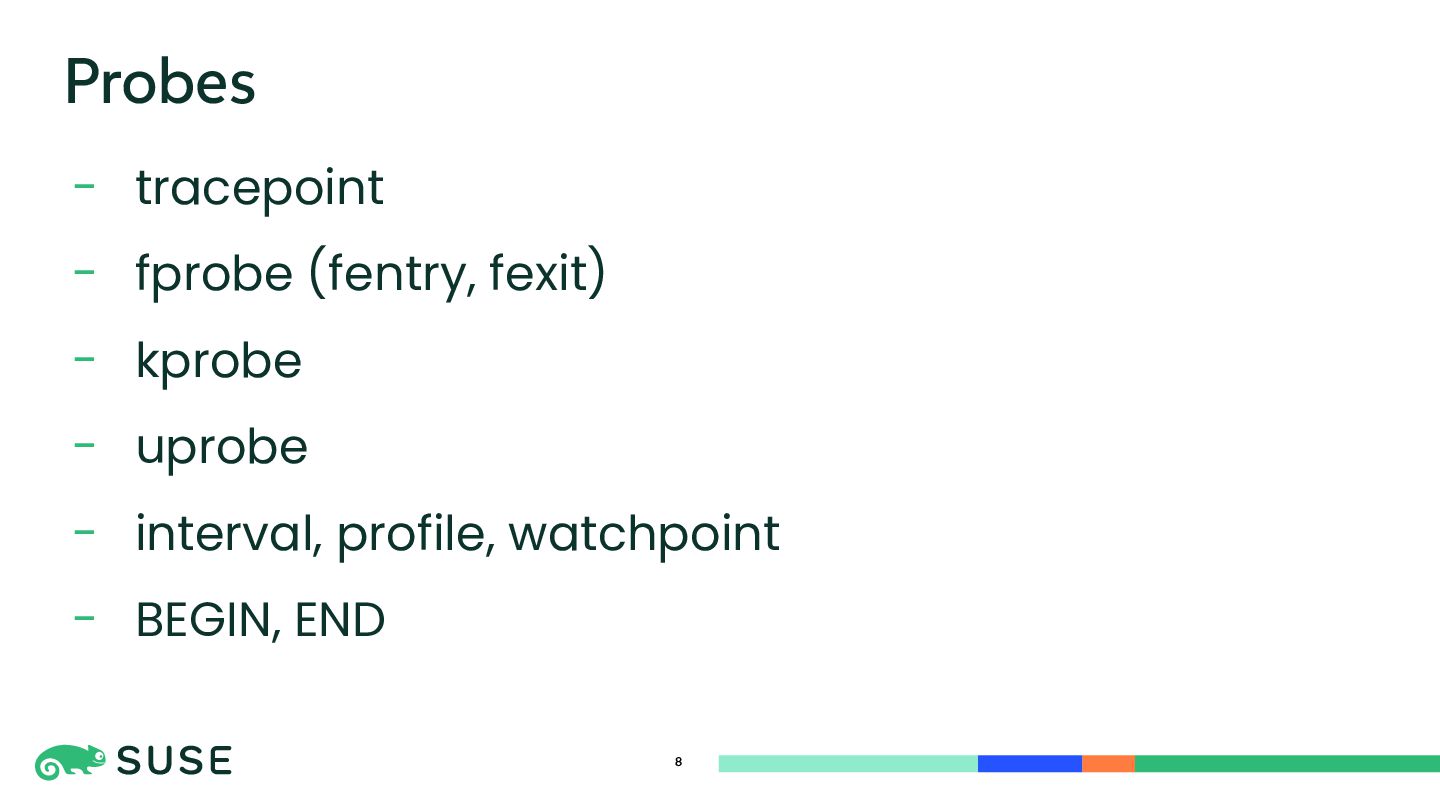
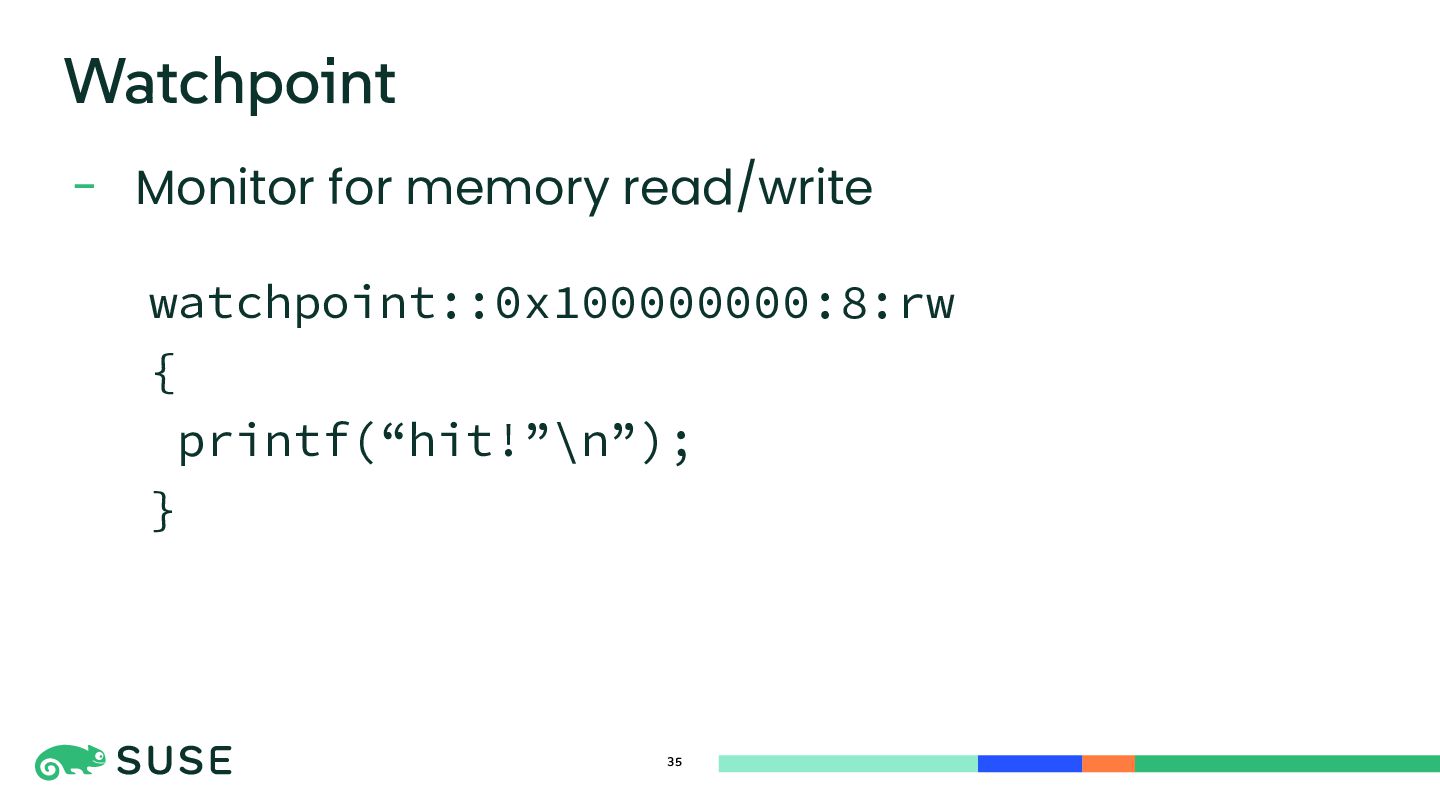
  3. - tracepoint - fprobe (fentry, fexit) - kprobe - uprobe

    - interval, profile, watchpoint - BEGIN, END 8 Probes
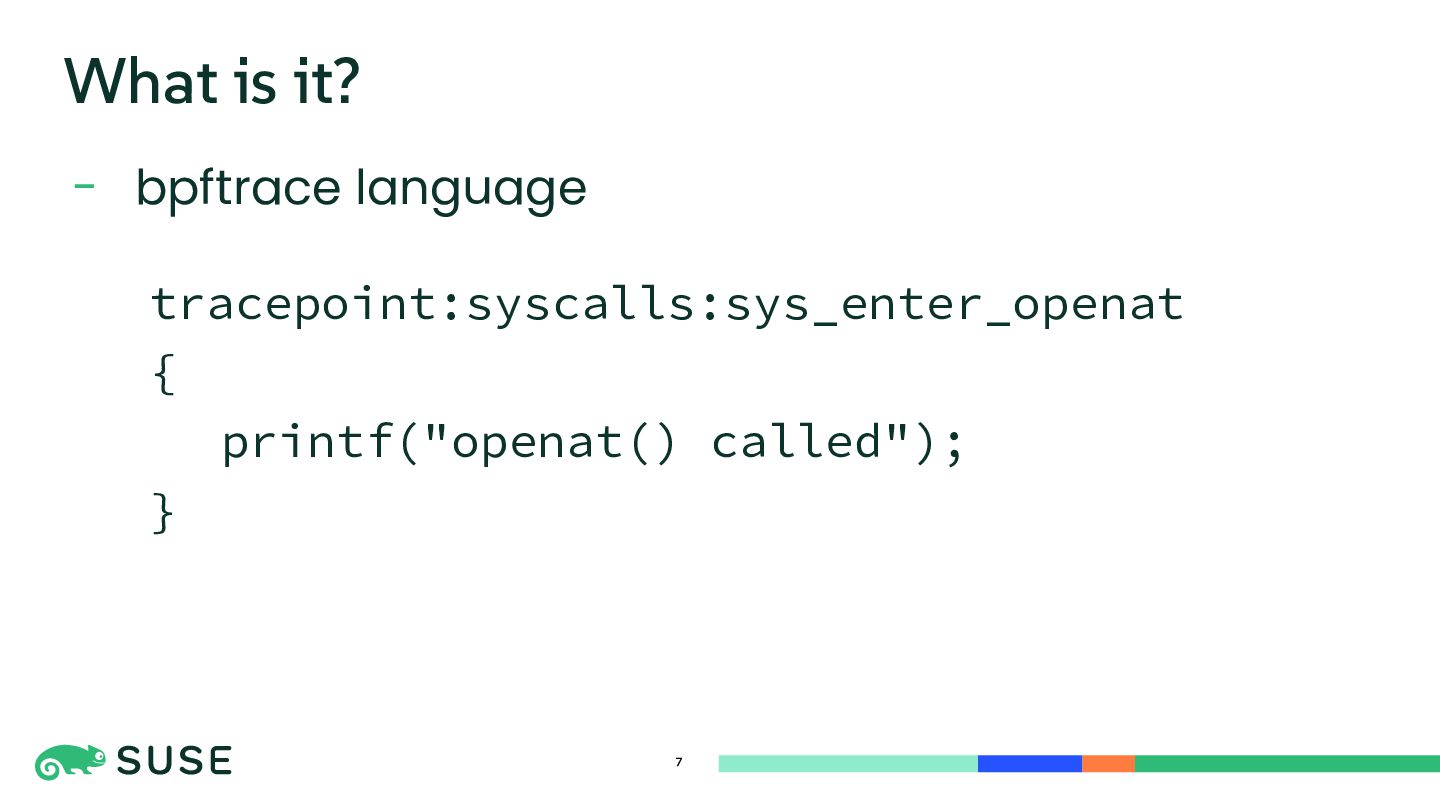
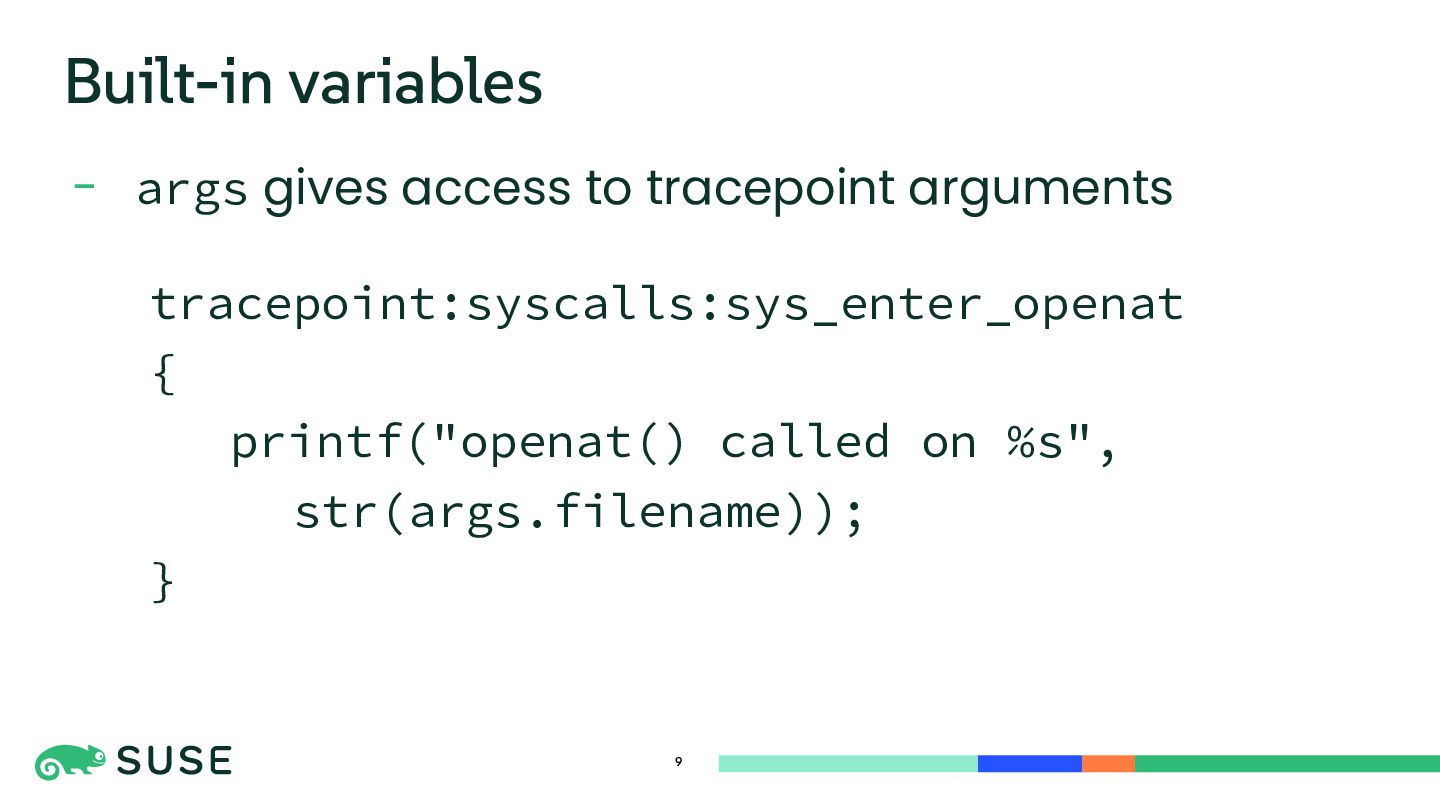
  4. - args gives access to tracepoint arguments 9 Built-in variables

    tracepoint:syscalls:sys_enter_openat { printf("openat() called on %s", str(args.filename)); }
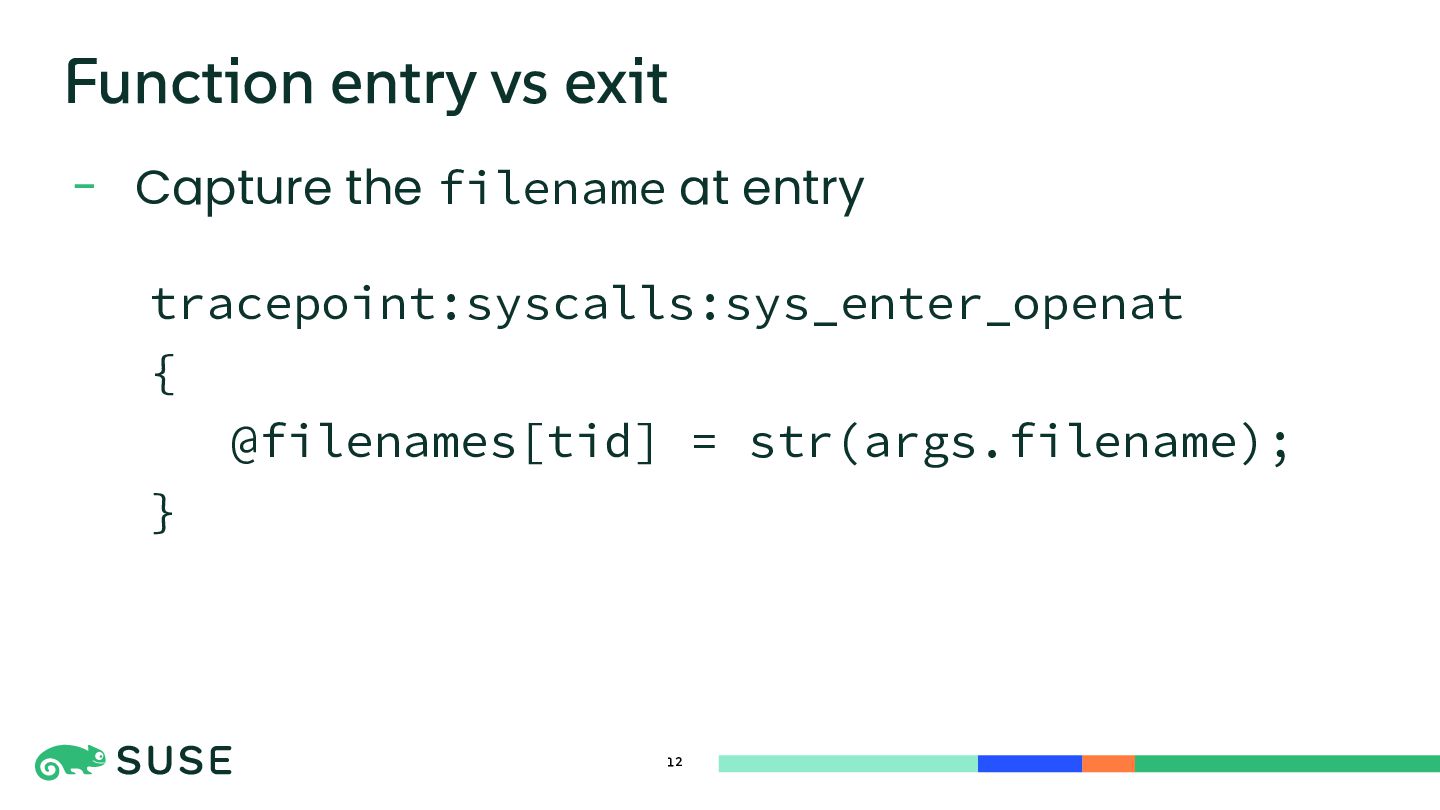
  5. - Capture the filename at entry 12 Function entry vs

    exit tracepoint:syscalls:sys_enter_openat { @filenames[tid] = str(args.filename); }
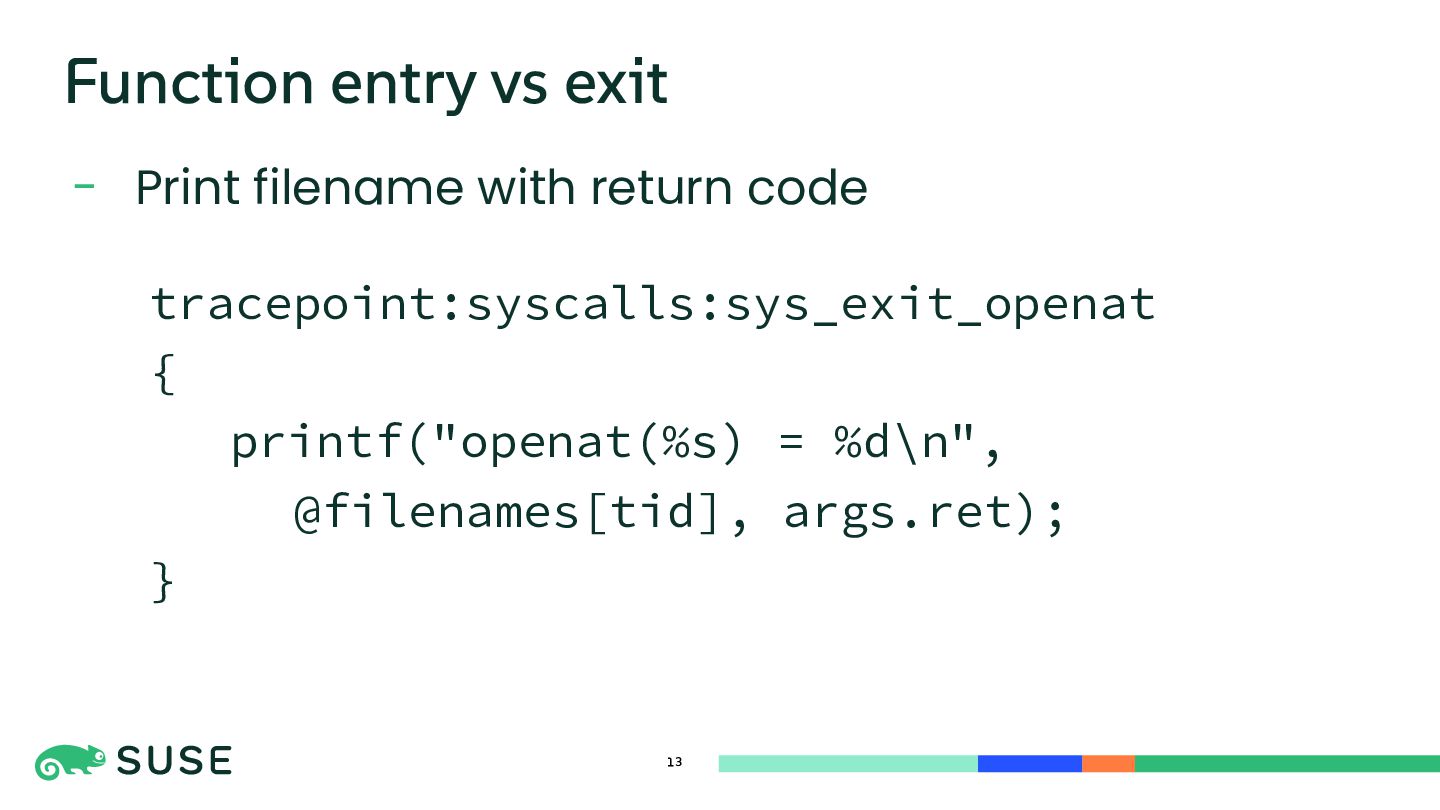
  6. - Print filename with return code 13 Function entry vs

    exit tracepoint:syscalls:sys_exit_openat { printf("openat(%s) = %d\n", @filenames[tid], args.ret); }
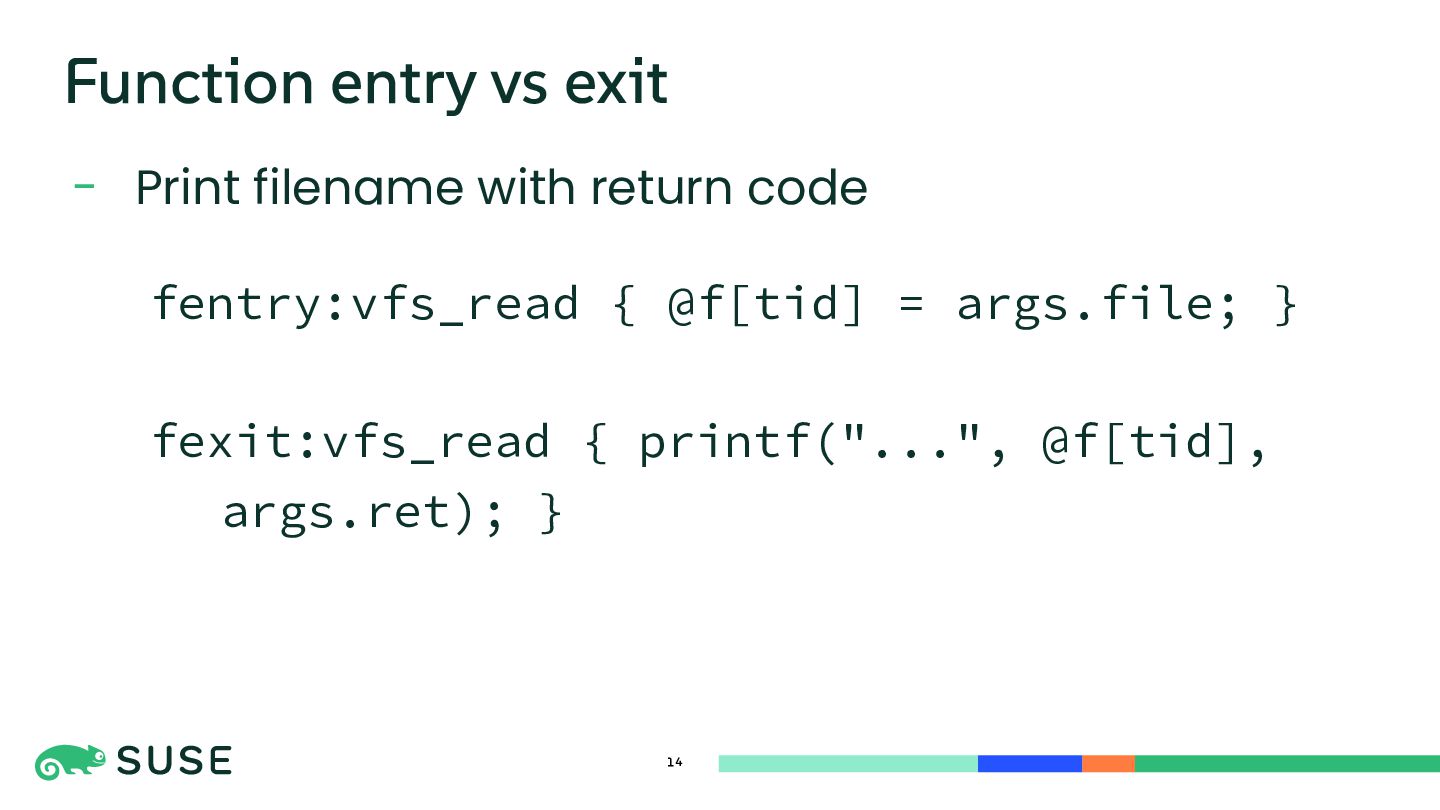
  7. - Print filename with return code 14 Function entry vs

    exit fentry:vfs_read { @f[tid] = args.file; } fexit:vfs_read { printf("...", @f[tid], args.ret); }
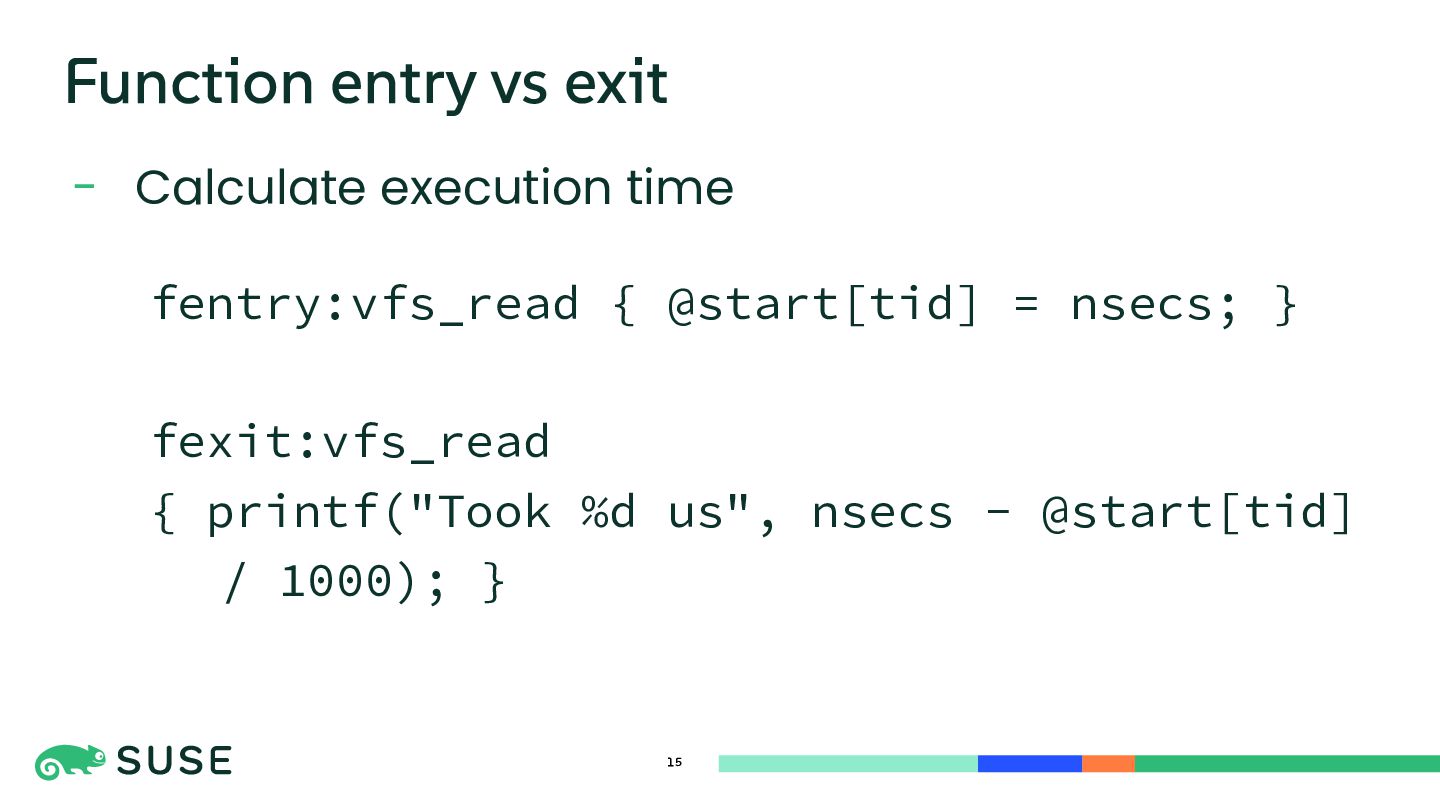
  8. - Calculate execution time 15 Function entry vs exit fentry:vfs_read

    { @start[tid] = nsecs; } fexit:vfs_read { printf("Took %d us", nsecs - @start[tid] / 1000); }
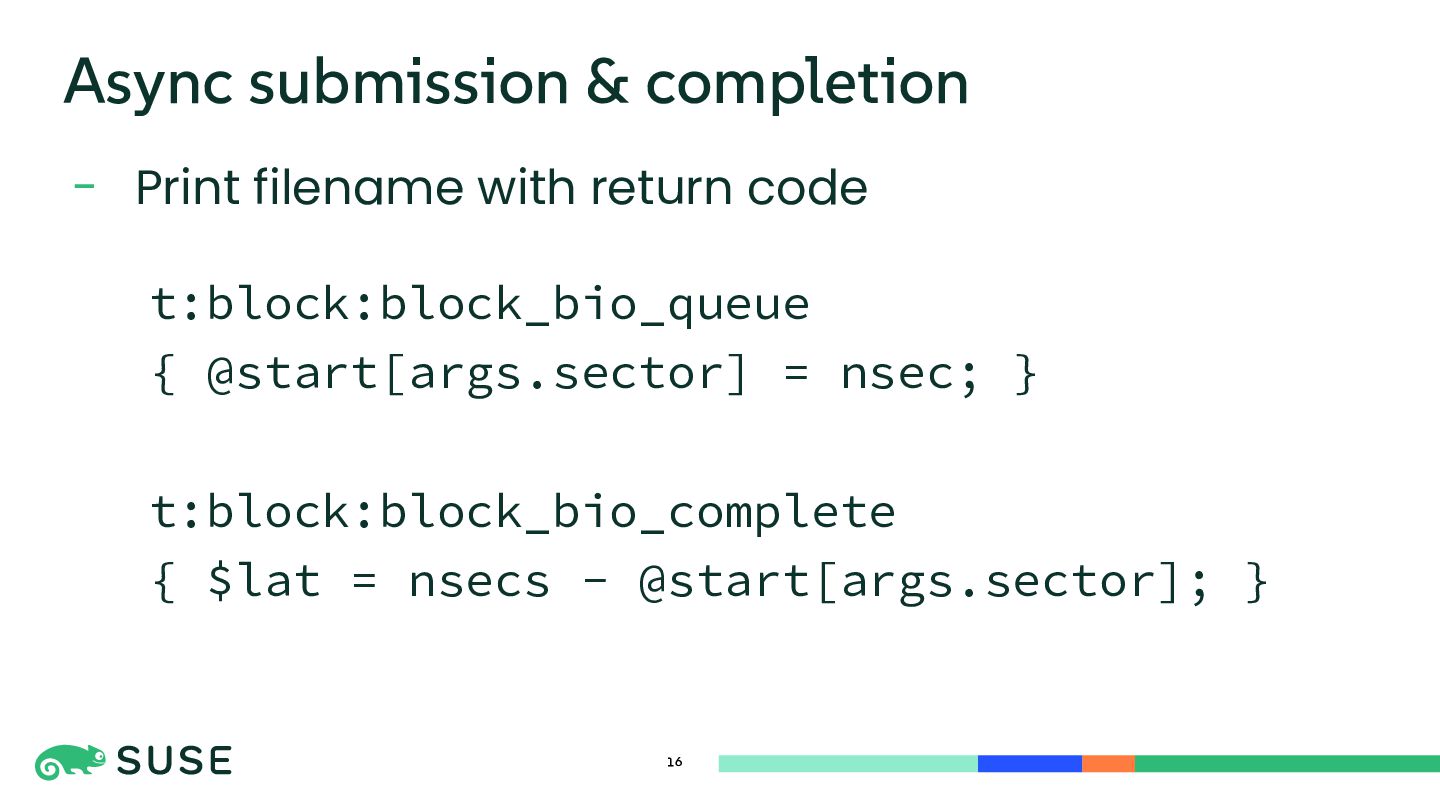
  9. - Print filename with return code 16 Async submission &

    completion t:block:block_bio_queue { @start[args.sector] = nsec; } t:block:block_bio_complete { $lat = nsecs - @start[args.sector]; }
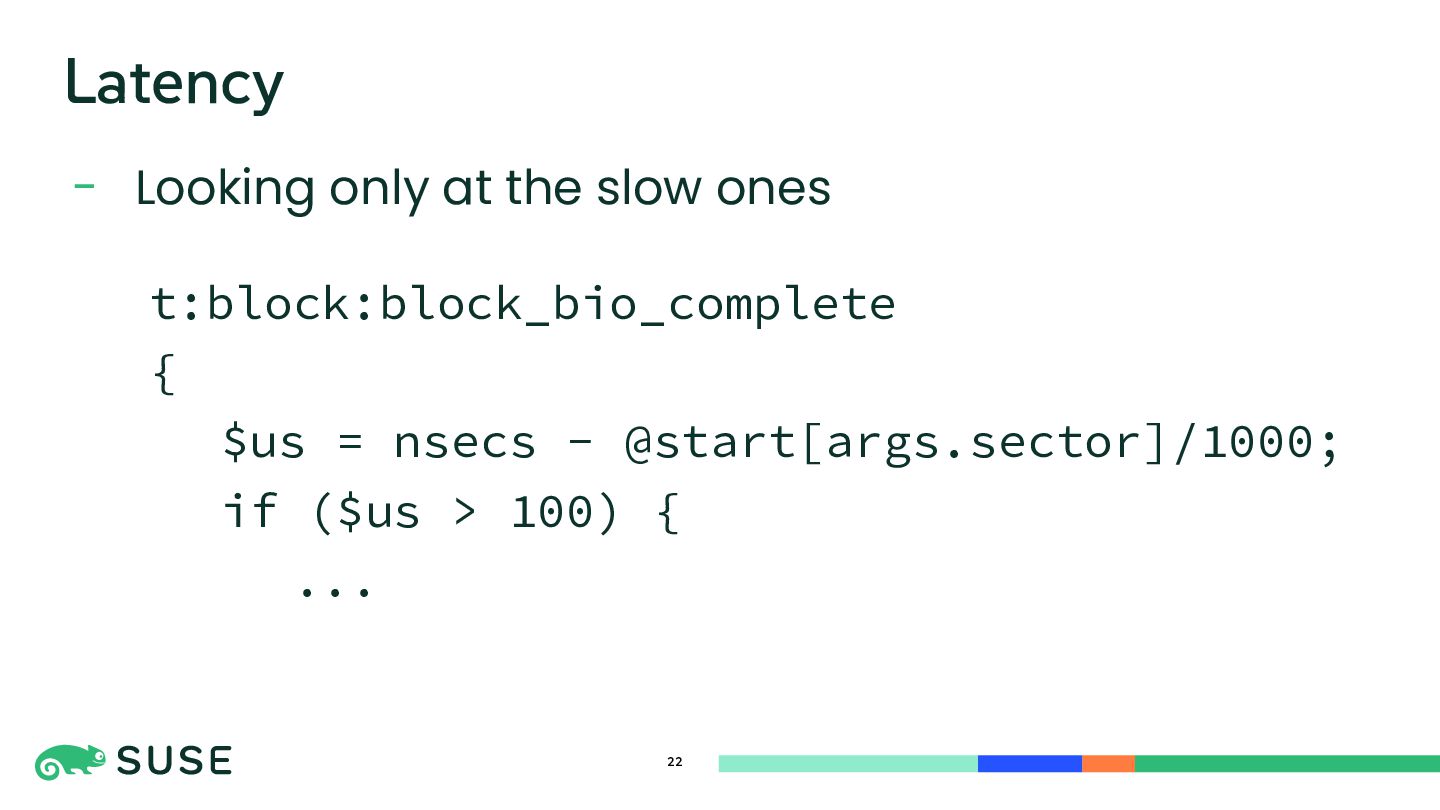
  10. - Looking only at the slow ones 22 Latency t:block:block_bio_complete

    { $us = nsecs - @start[args.sector]/1000; if ($us > 100) { ...
  11. - Current execution environment 23 Context kprobe:do_fault { @faulted[cpu] =

    true } kretprobe:do_fault { delete(@faulted, cpu); }
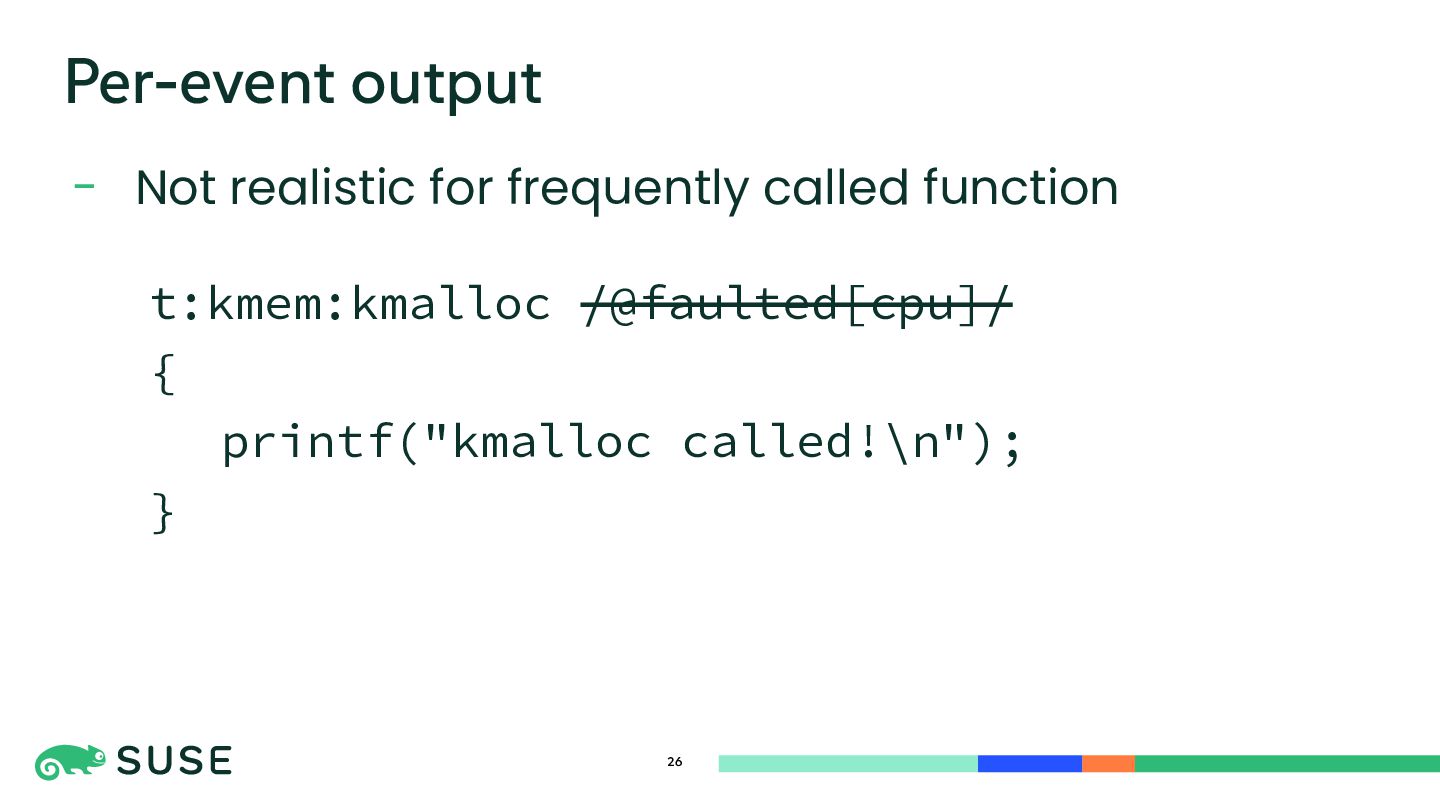
  12. - Not realistic for frequently called function 26 Per-event output

    t:kmem:kmalloc /@faulted[cpu]/ { printf("kmalloc called!\n"); }
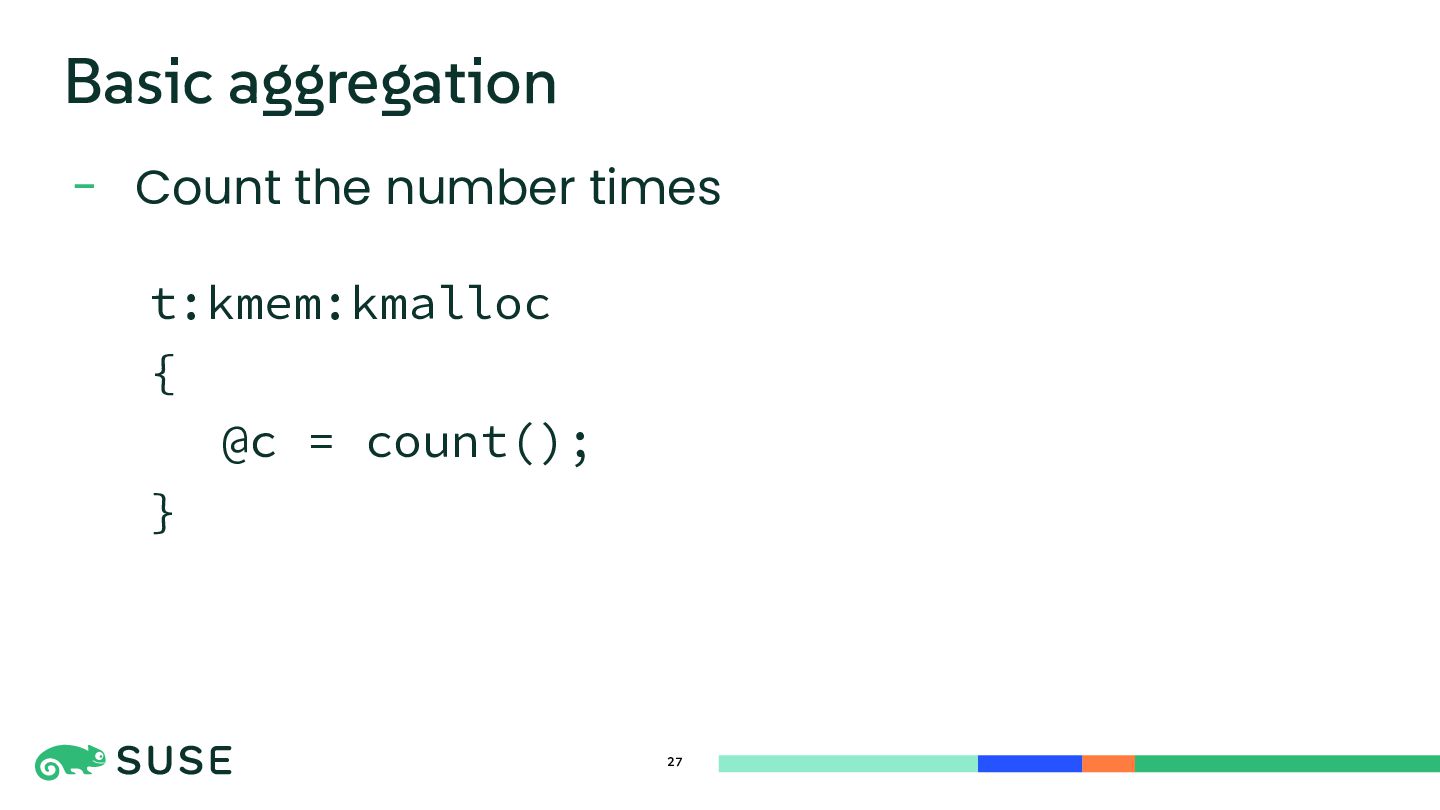
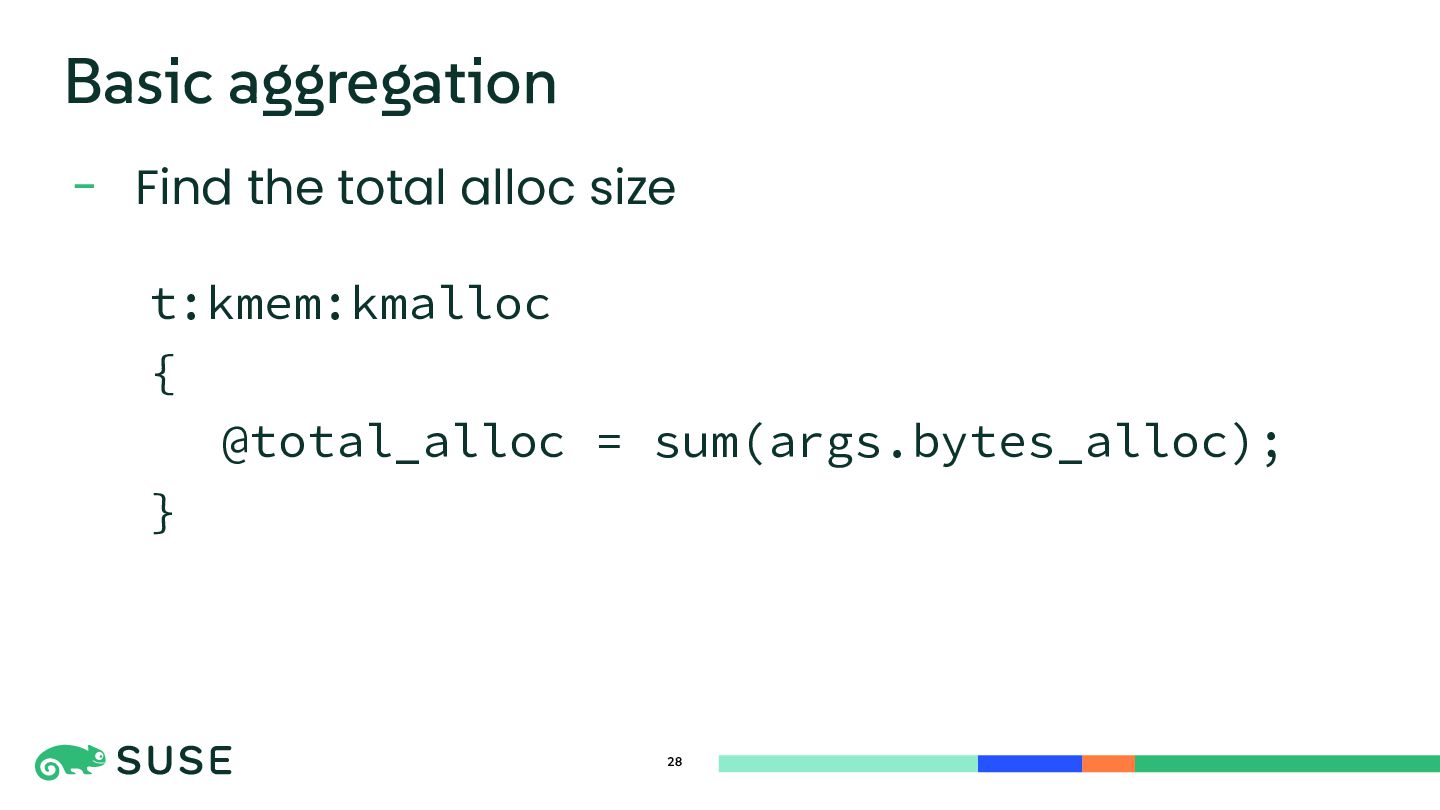
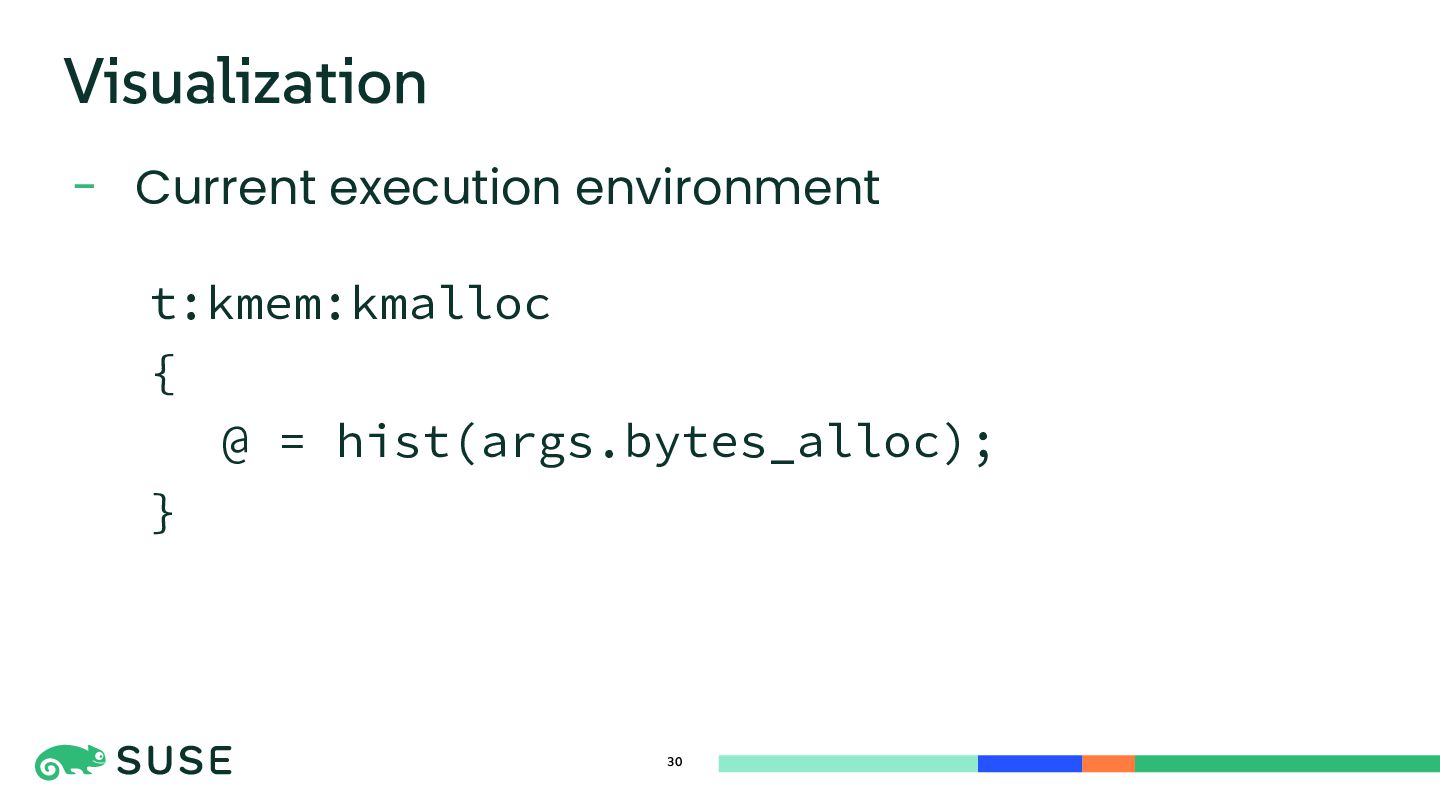
  13. - Find the total alloc size 28 Basic aggregation t:kmem:kmalloc

    { @total_alloc = sum(args.bytes_alloc); }
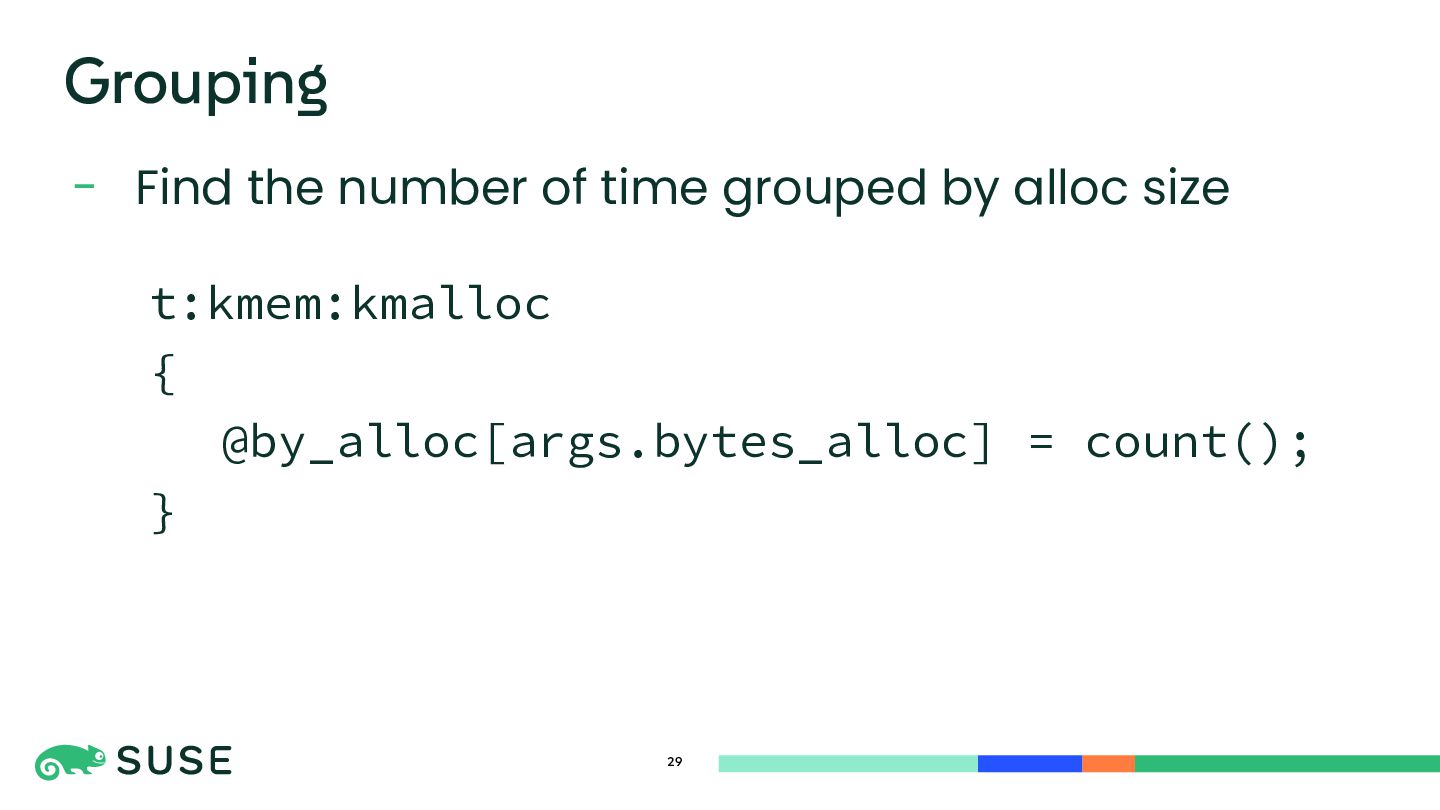
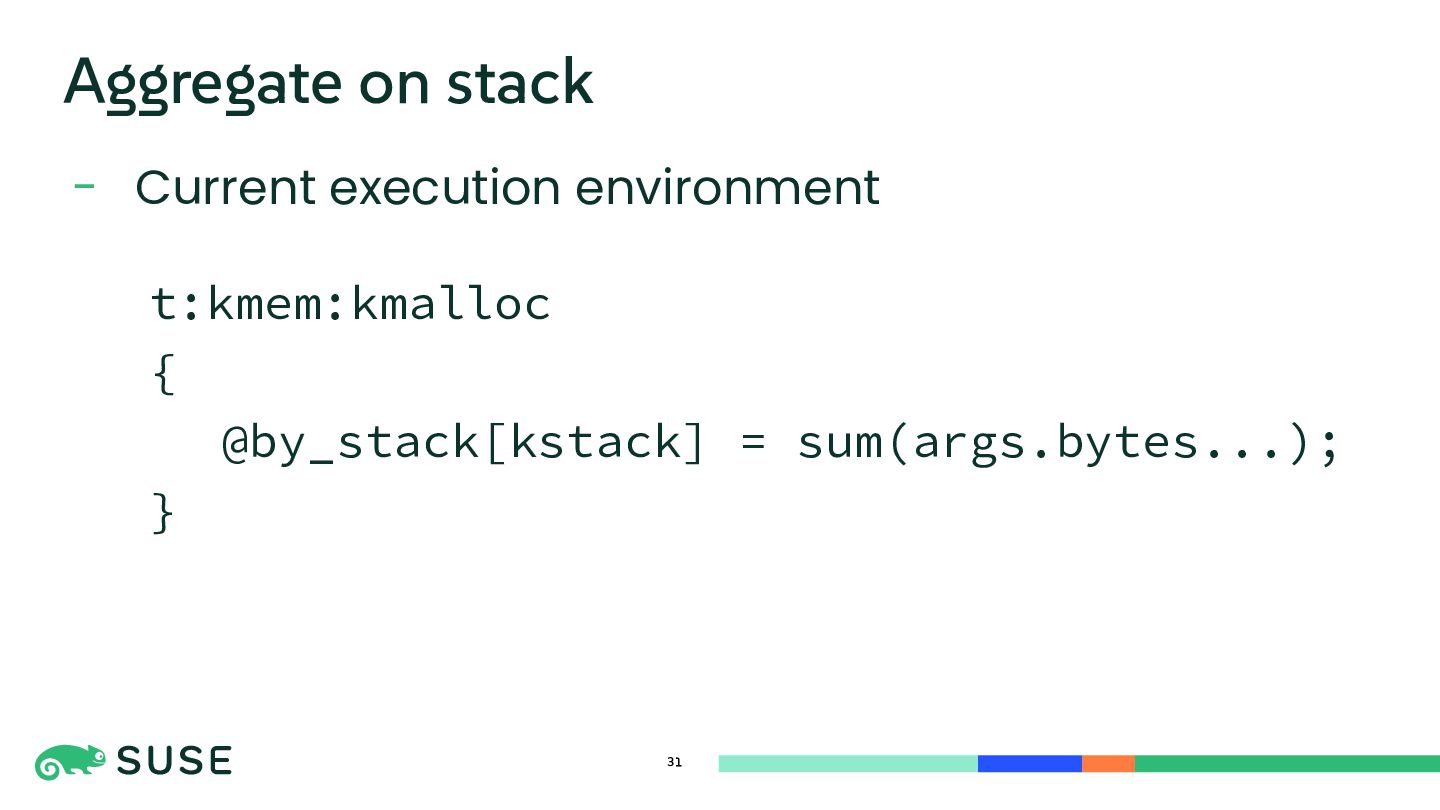
  14. - Find the number of time grouped by alloc size

    29 Grouping t:kmem:kmalloc { @by_alloc[args.bytes_alloc] = count(); }
  15. - Directly reading CPU register value at specific instruction (see

    “how to use bpftrace probe…”) 34 kprobe:do_truncate+109 { printf(" %x\n", reg("sp")); } Reading local variable
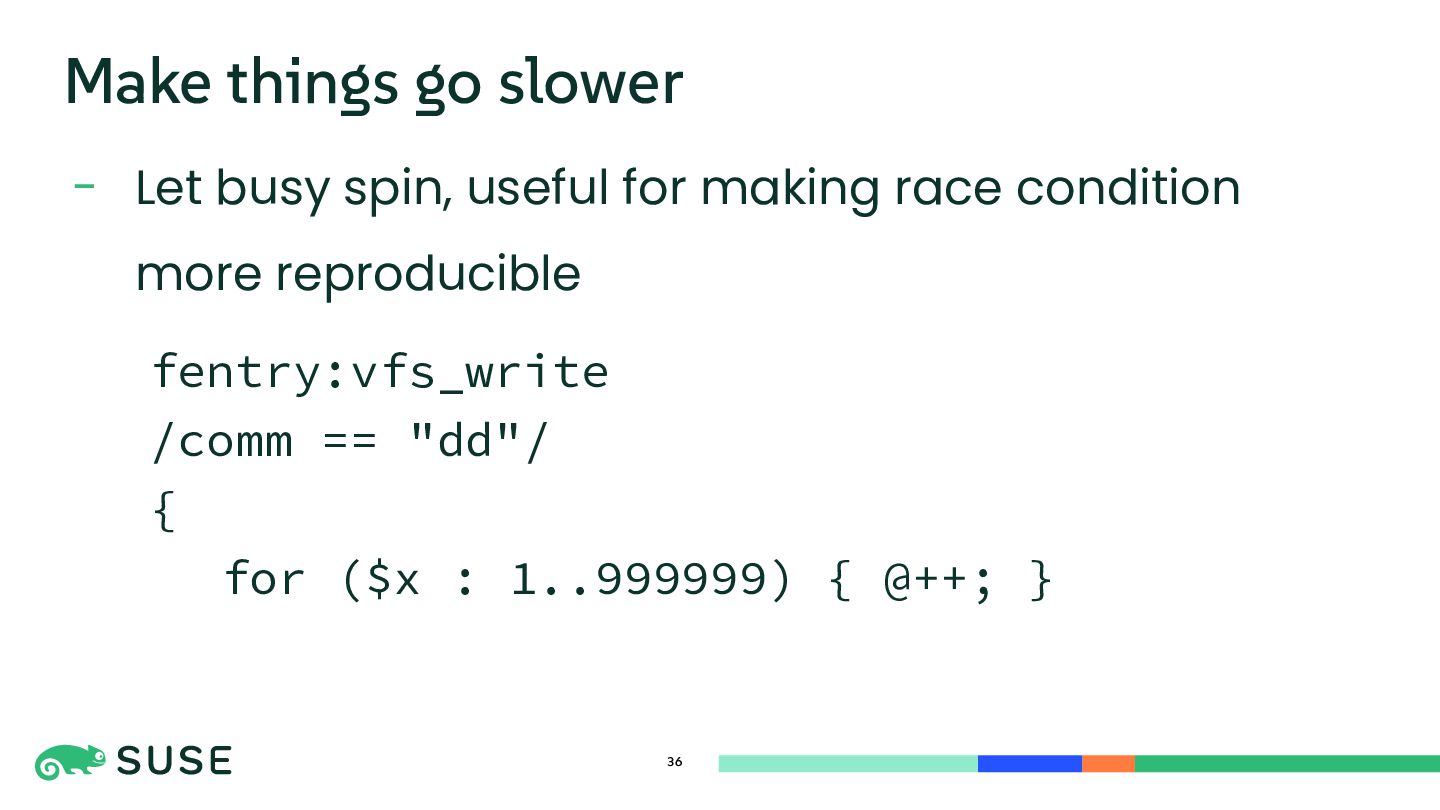
  16. - Let busy spin, useful for making race condition more

    reproducible 36 Make things go slower fentry:vfs_write /comm == "dd"/ { for ($x : 1..999999) { @++; }
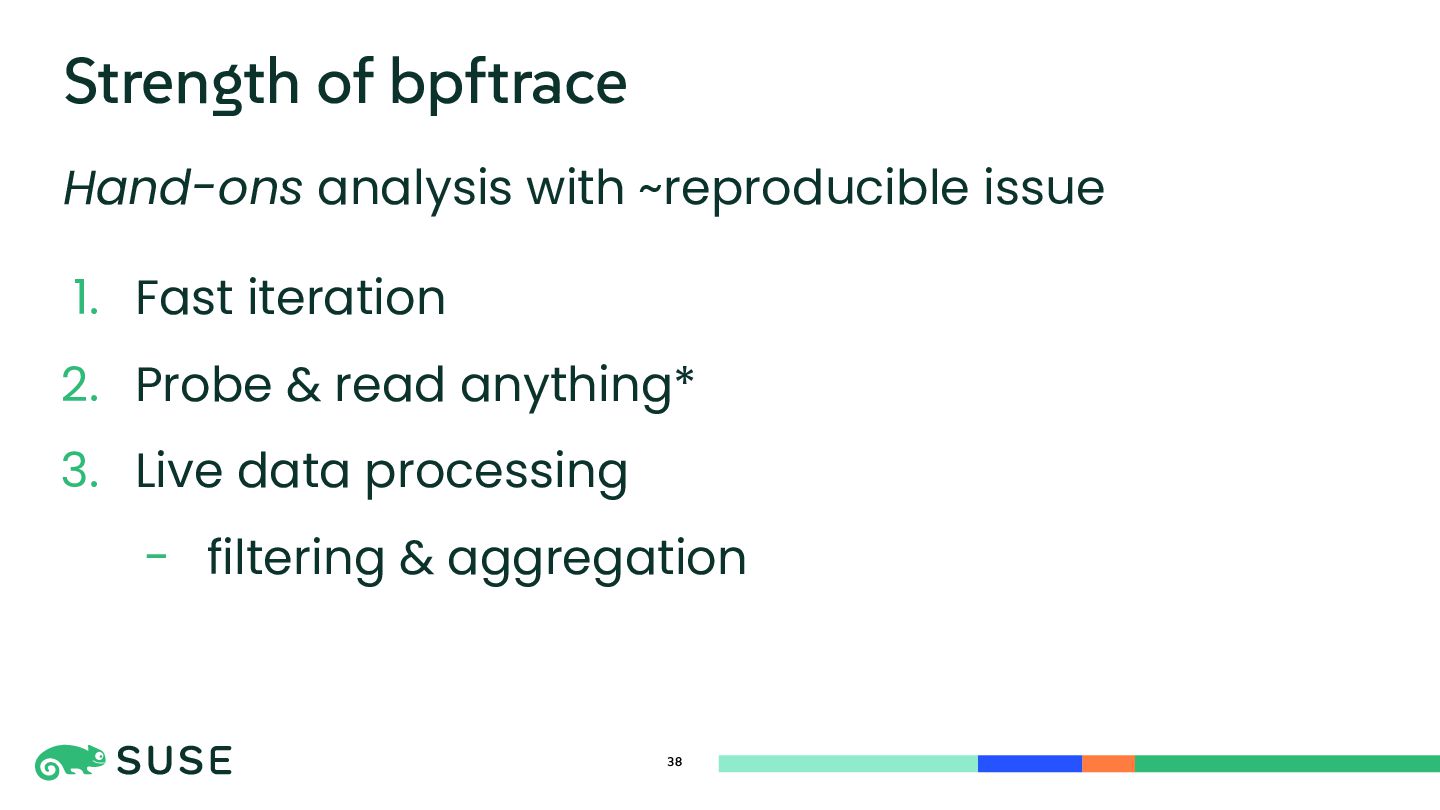
  17. Hand-ons analysis with ~reproducible issue 1. Fast iteration 2. Probe

    & read anything* 3. Live data processing - filtering & aggregation 38 Strength of bpftrace
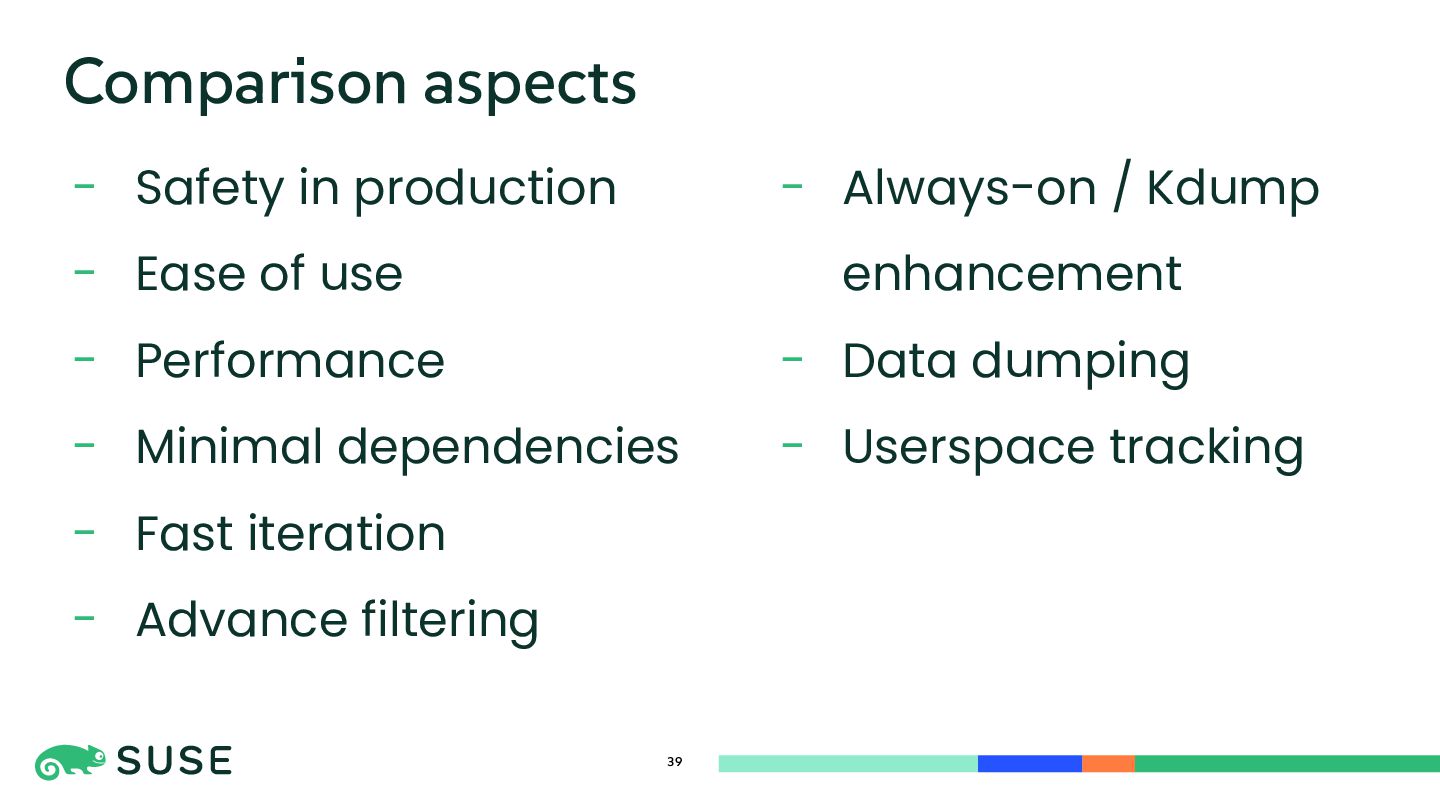
  18. 39 Comparison aspects - Safety in production - Ease of

    use - Performance - Minimal dependencies - Fast iteration - Advance filtering - Always-on / Kdump enhancement - Data dumping - Userspace tracking
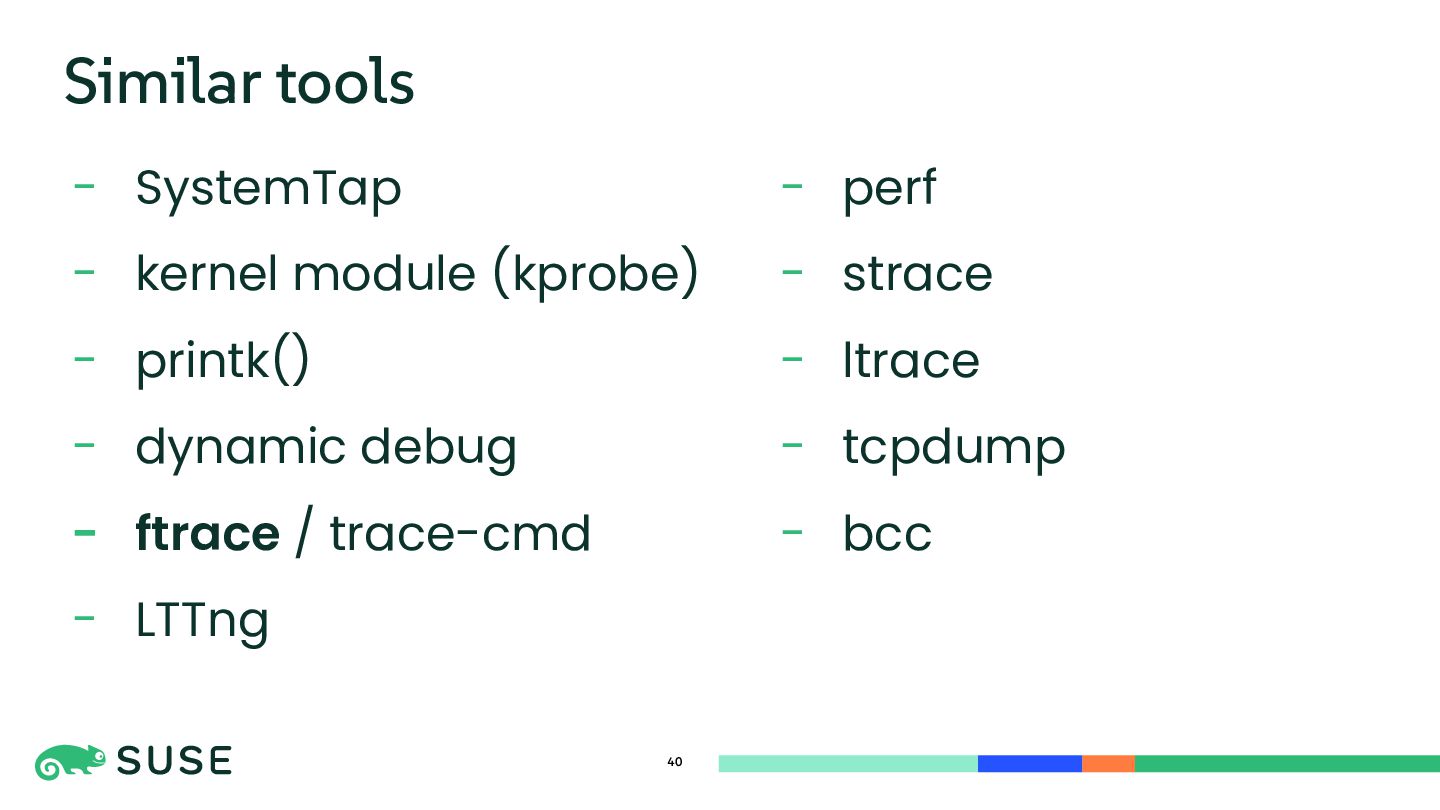
  19. - SystemTap - kernel module (kprobe) - printk() - dynamic

    debug - ftrace / trace-cmd - LTTng 40 Similar tools - perf - strace - ltrace - tcpdump - bcc