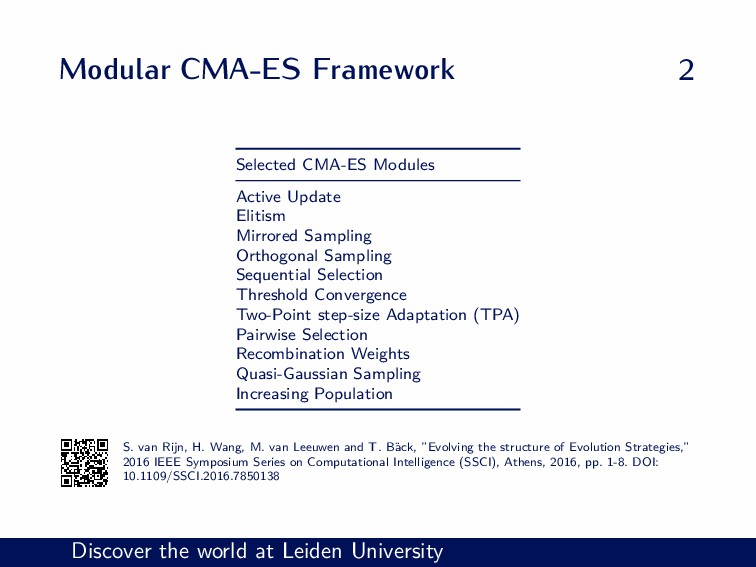
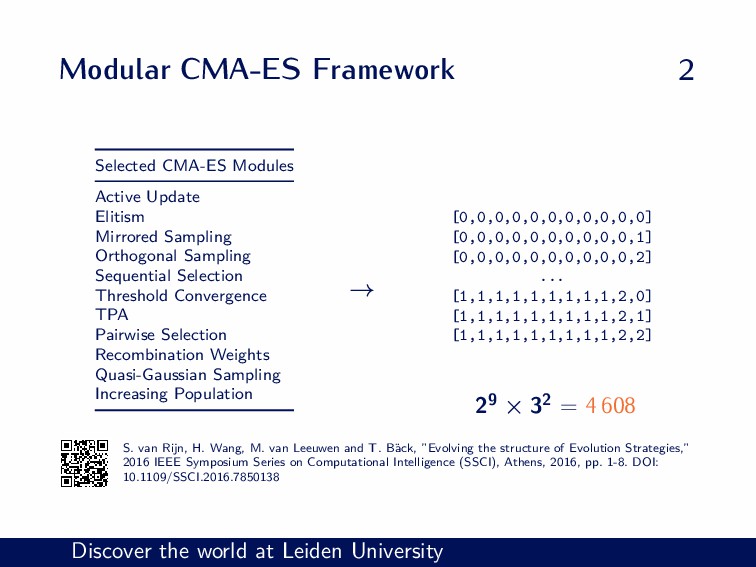
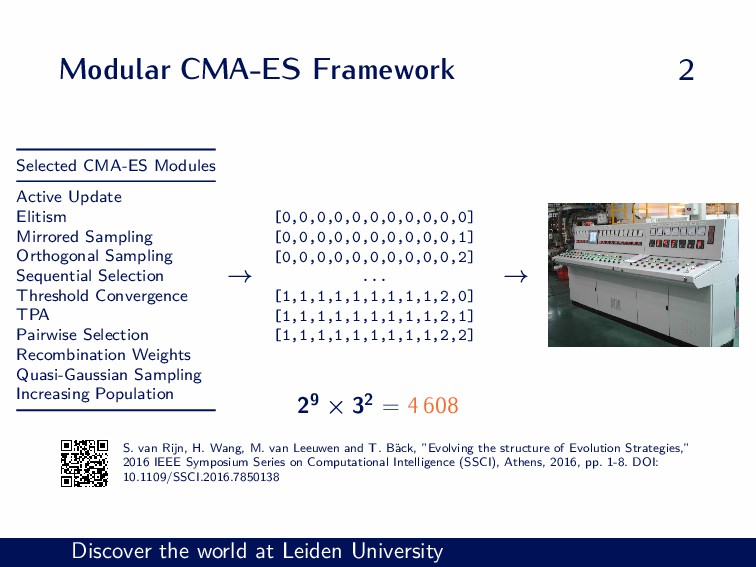
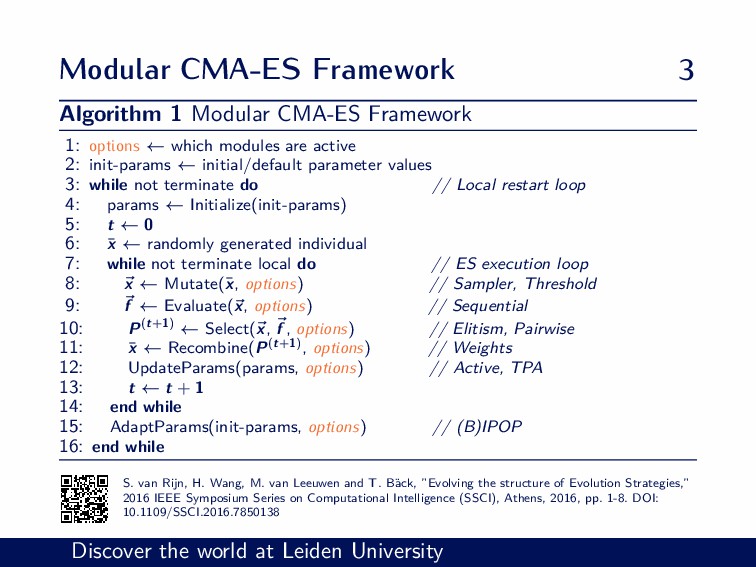
Selected CMA-ES Modules Active Update Elitism Mirrored Sampling Orthogonal Sampling Sequential Selection Threshold Convergence TPA Pairwise Selection Recombination Weights Quasi-Gaussian Sampling Increasing Population → [0,0,0,0,0,0,0,0,0,0,0] [0,0,0,0,0,0,0,0,0,0,1] [0,0,0,0,0,0,0,0,0,0,2] ... [1,1,1,1,1,1,1,1,1,2,0] [1,1,1,1,1,1,1,1,1,2,1] [1,1,1,1,1,1,1,1,1,2,2] 29 × 32 = 4 608 → S. van Rijn, H. Wang, M. van Leeuwen and T. B¨ ack, ”Evolving the structure of Evolution Strategies,” 2016 IEEE Symposium Series on Computational Intelligence (SSCI), Athens, 2016, pp. 1-8. DOI: 10.1109/SSCI.2016.7850138