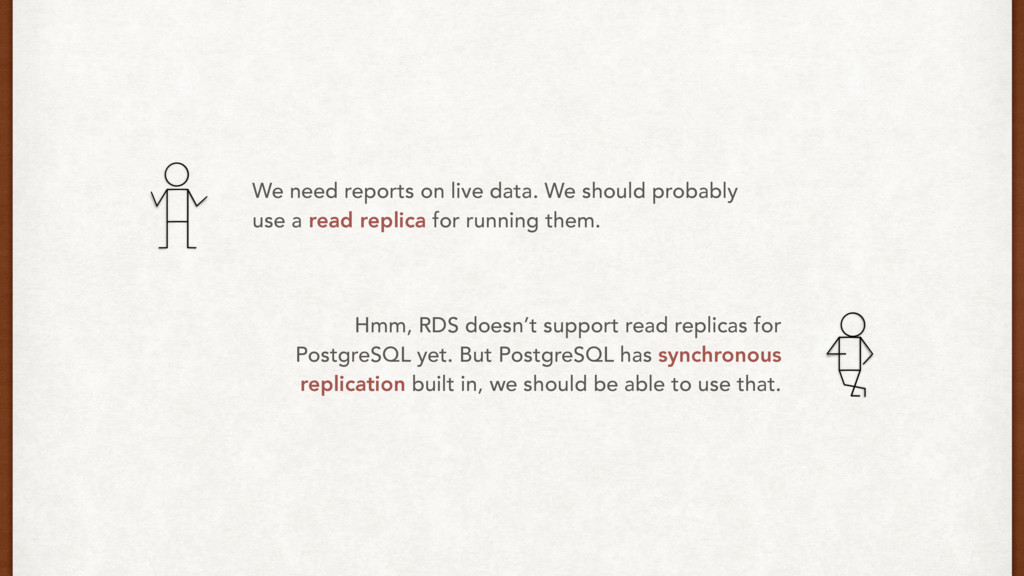
a read replica for running them. Hmm, RDS doesn’t support read replicas for PostgreSQL yet. But PostgreSQL has synchronous replication built in, we should be able to use that.
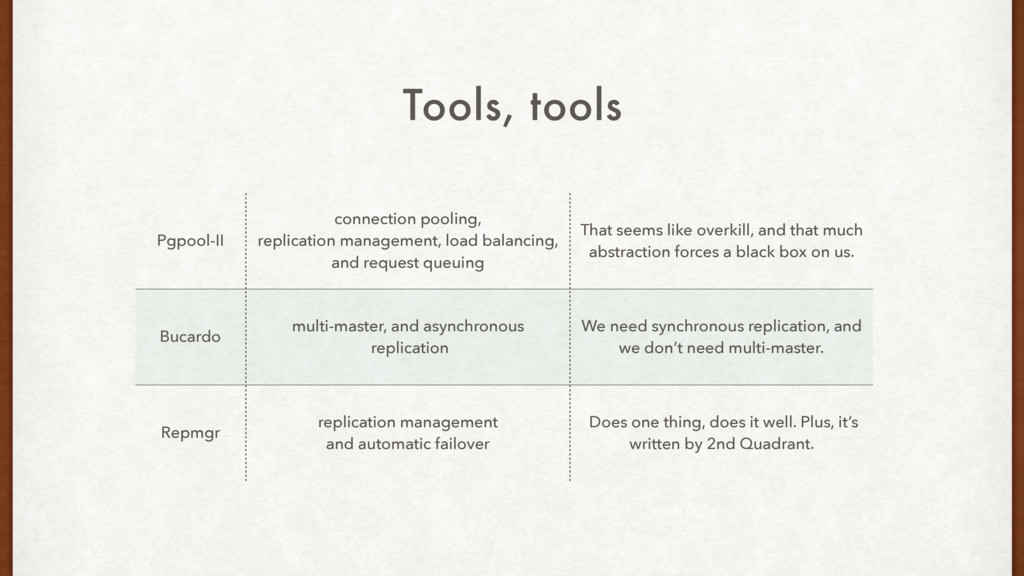
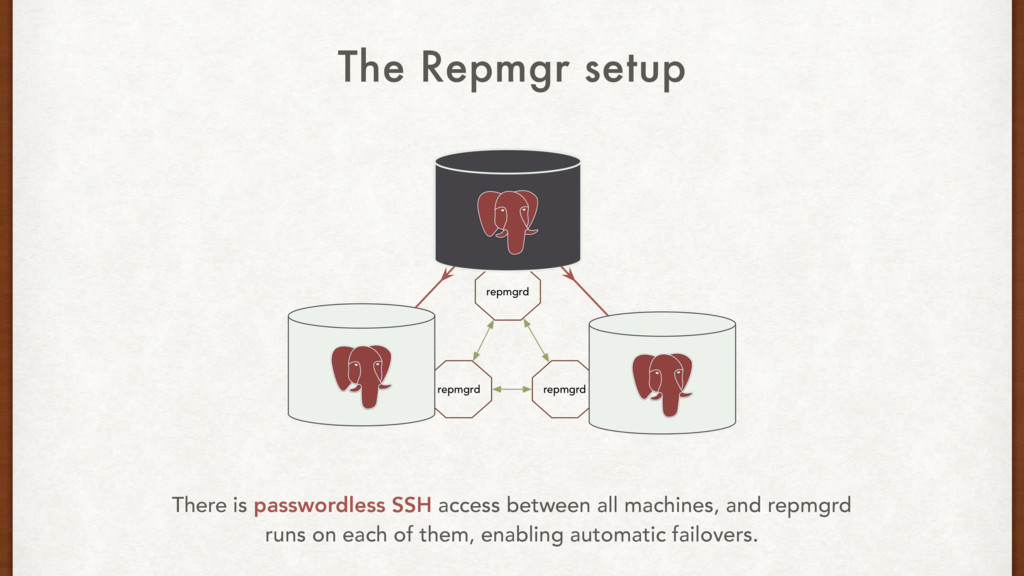
That seems like overkill, and that much abstraction forces a black box on us. Bucardo multi-master, and asynchronous replication We need synchronous replication, and we don’t need multi-master. Repmgr replication management and automatic failover Does one thing, does it well. Plus, it’s written by 2nd Quadrant. Tools, tools
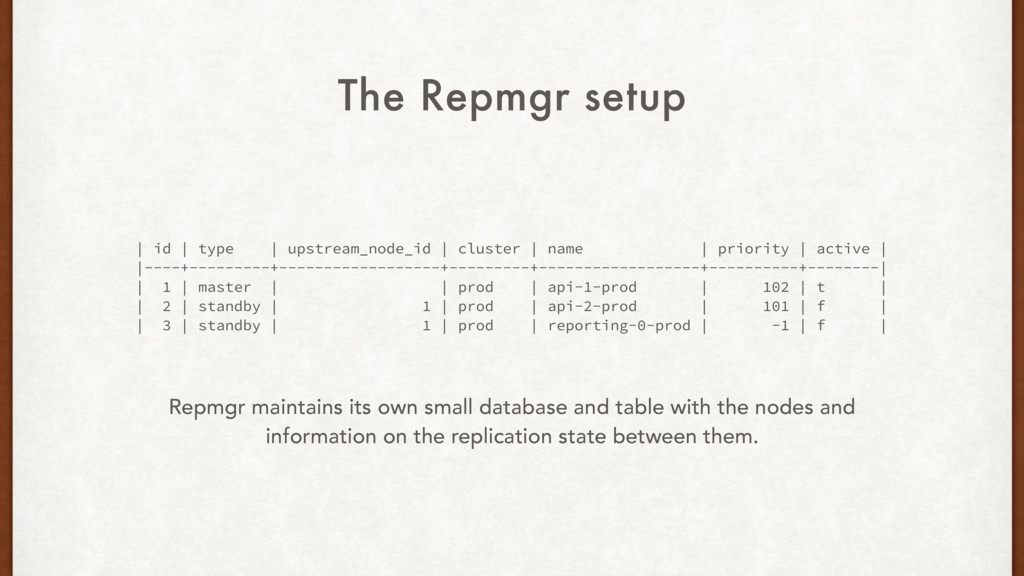
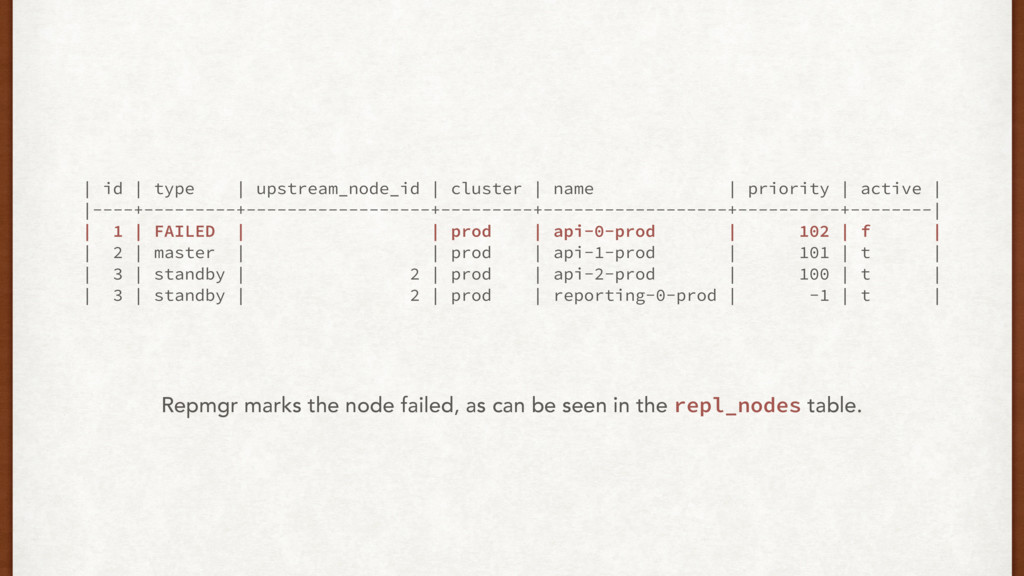
| priority | active | |----+---------+------------------+---------+------------------+----------+--------| | 1 | master | | prod | api-1-prod | 102 | t | | 2 | standby | 1 | prod | api-2-prod | 101 | f | | 3 | standby | 1 | prod | reporting-0-prod | -1 | f | The Repmgr setup Repmgr maintains its own small database and table with the nodes and information on the replication state between them.
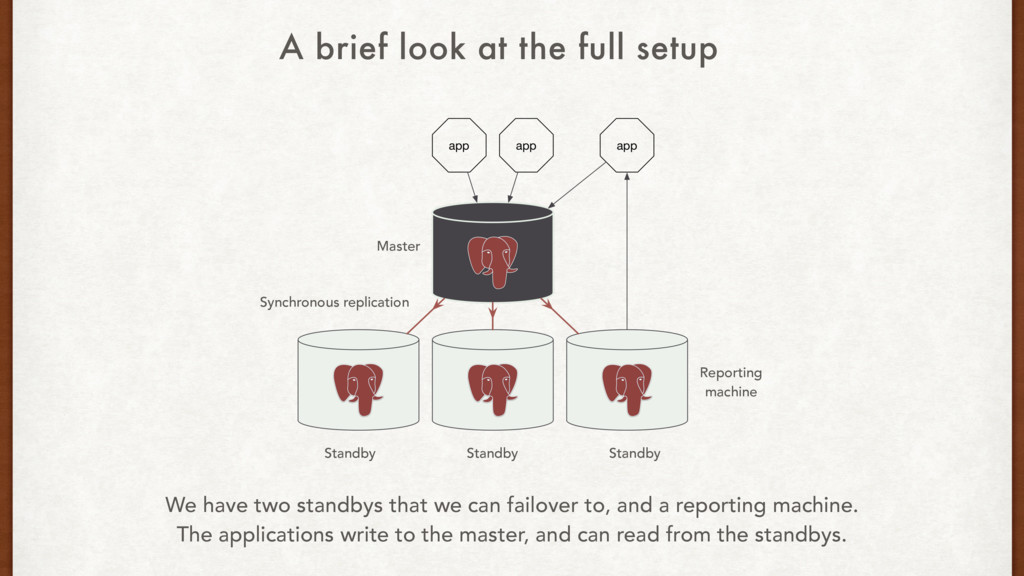
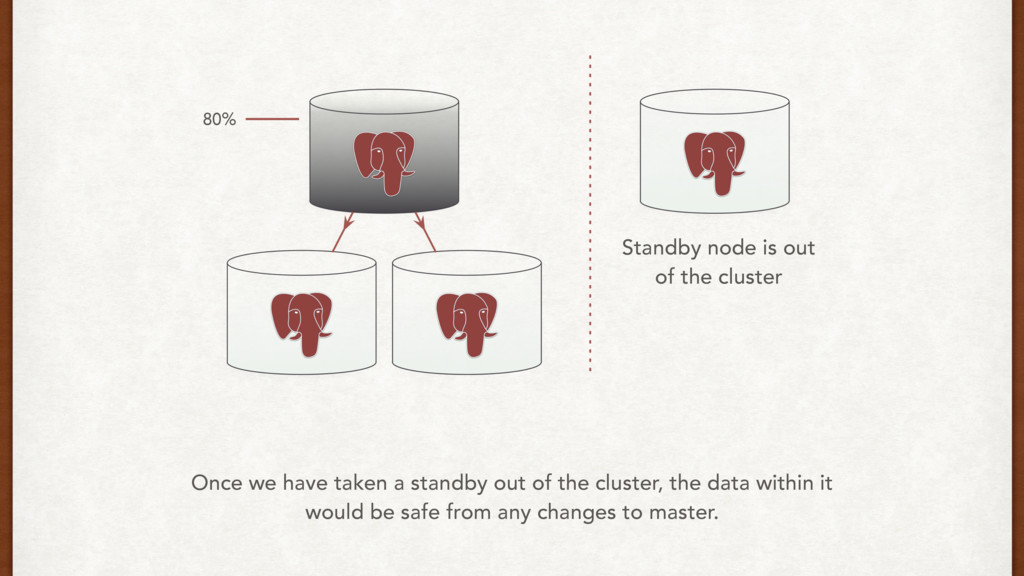
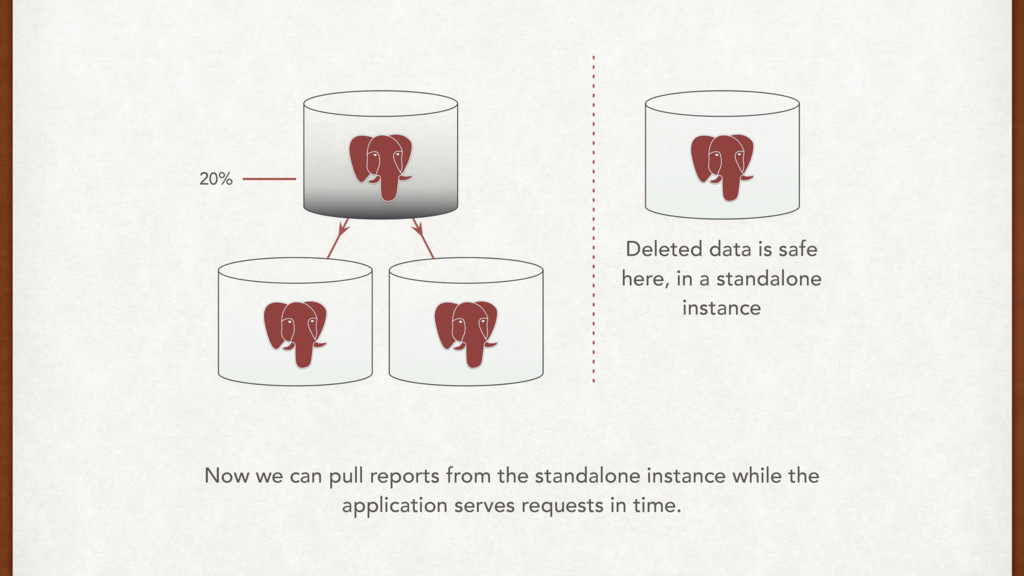
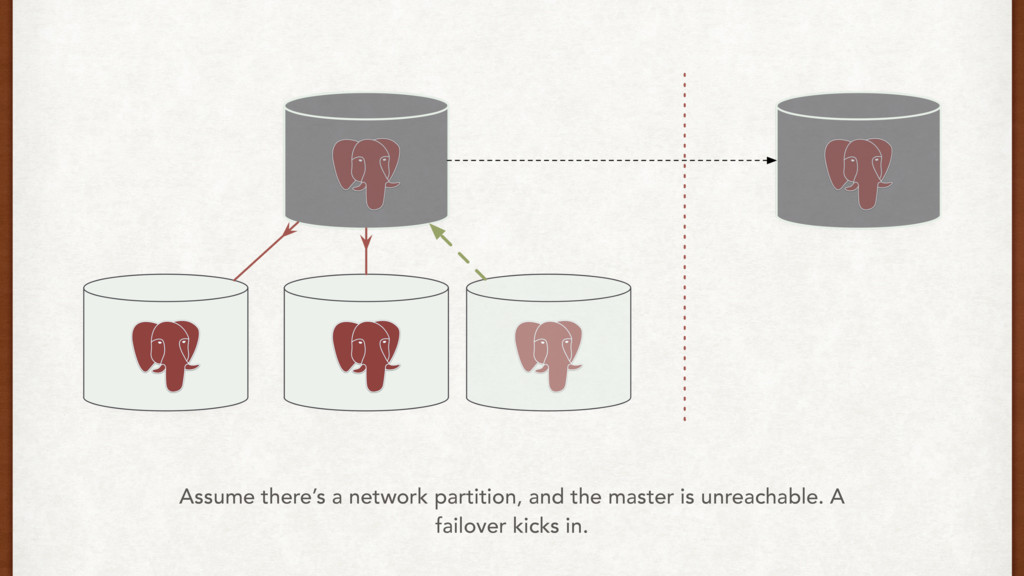
two standbys that we can failover to, and a reporting machine. The applications write to the master, and can read from the standbys. A brief look at the full setup
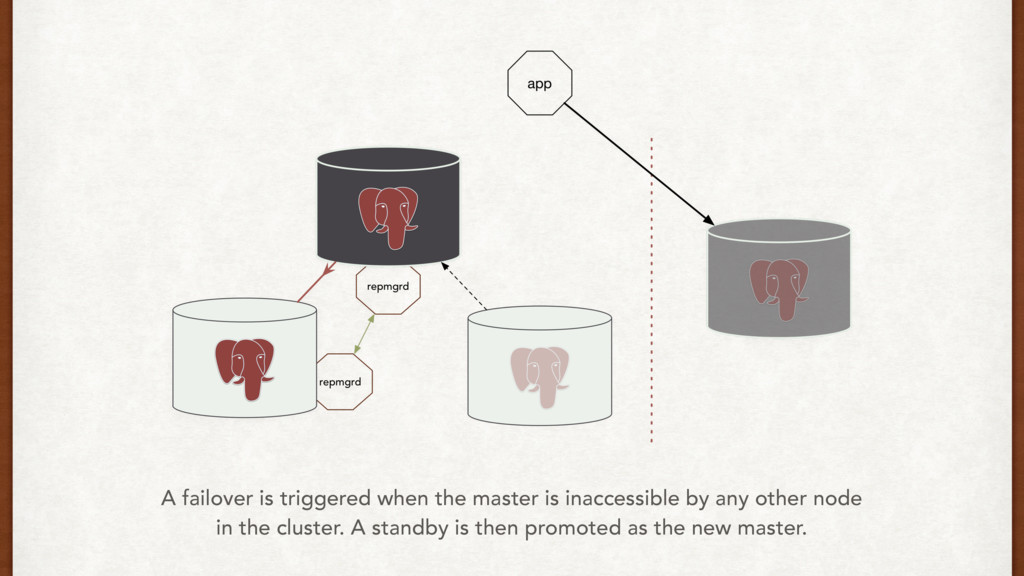
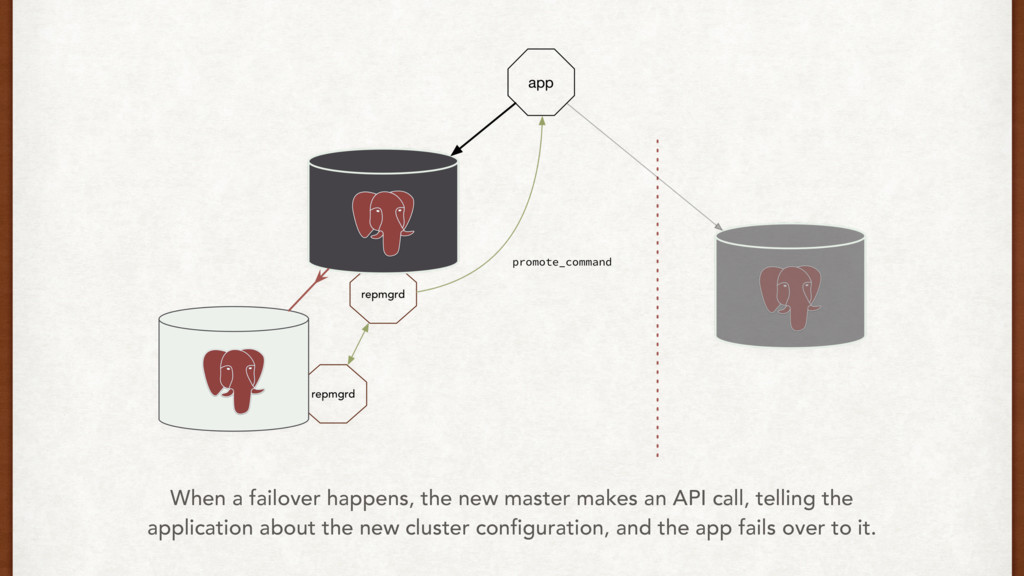
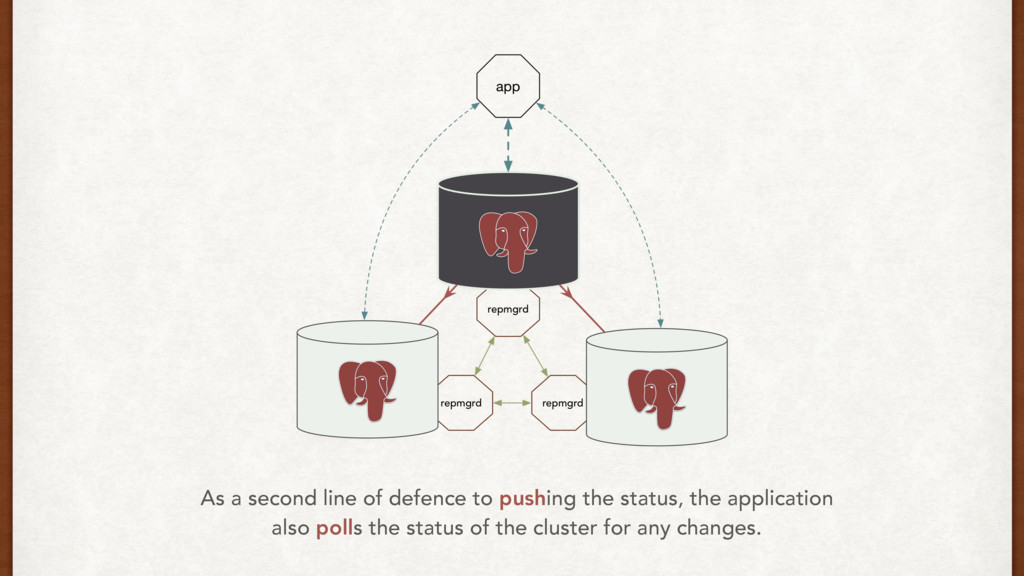
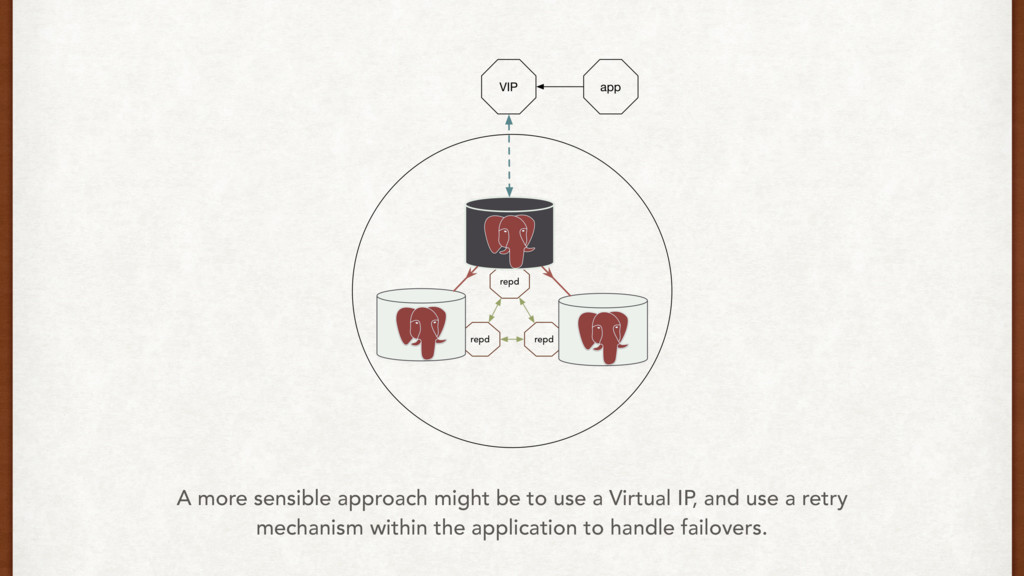
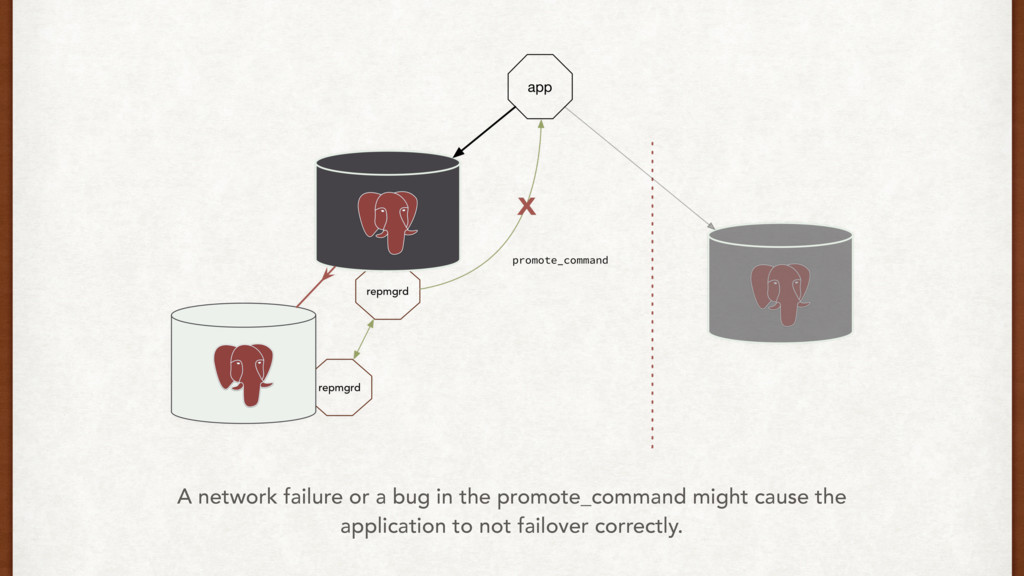
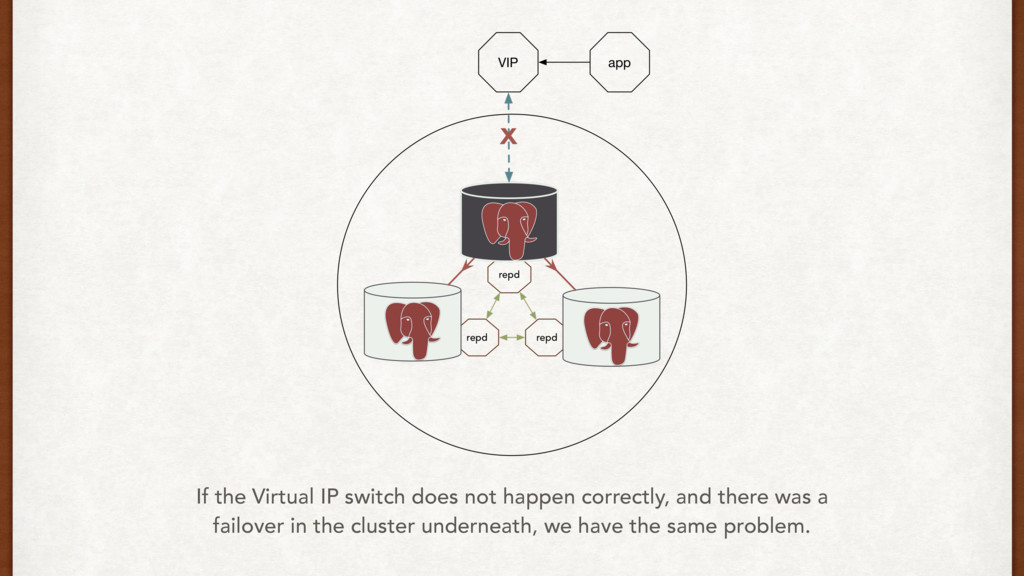
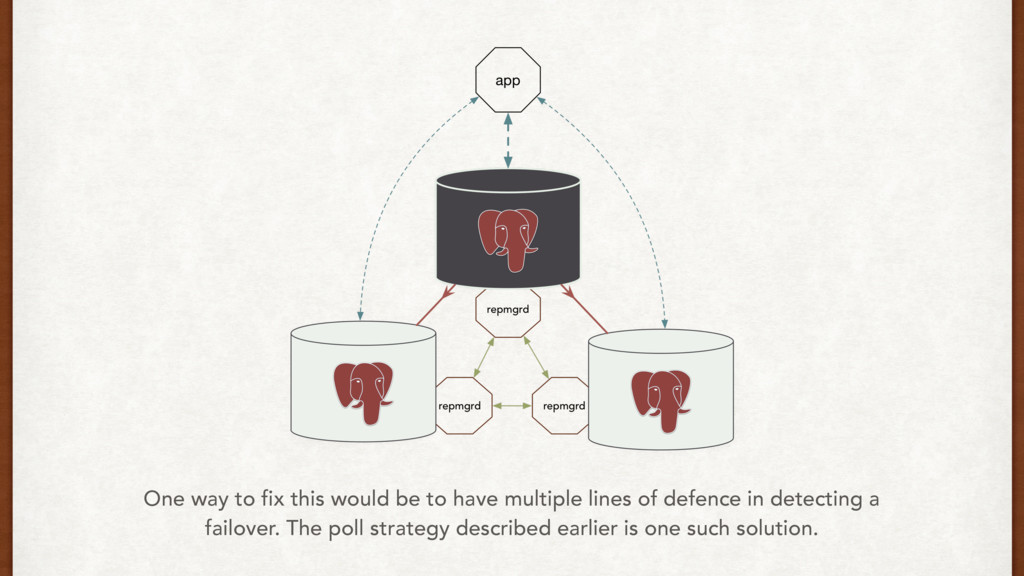
does it well. • We can use push and pull strategies, or a virtual IP mechanism to communicate failovers directly to the application. • AWS might drop your box. • Test failovers rigorously.
can lose some data, but the service needs to be up. Please fix it soon! The disk usage is at 80%, and the DB is crawling! The disk usage was only 72% last night, and we were running the bulk deletion script. How did it go up to 80% overnight? I need to fix the issue before debugging.
to happen for another week at least. So, why did we fail at 80%? Oh, it’s ZFS! ZFS best practices say"Keep pool space under 80% utilization to maintain pool performance”. Never go over 80% on ZFS.
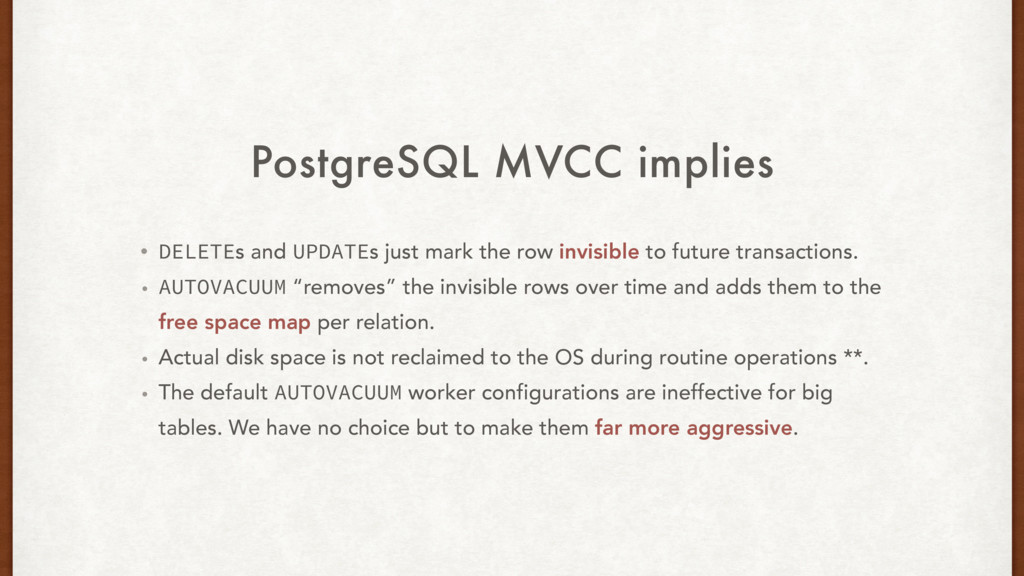
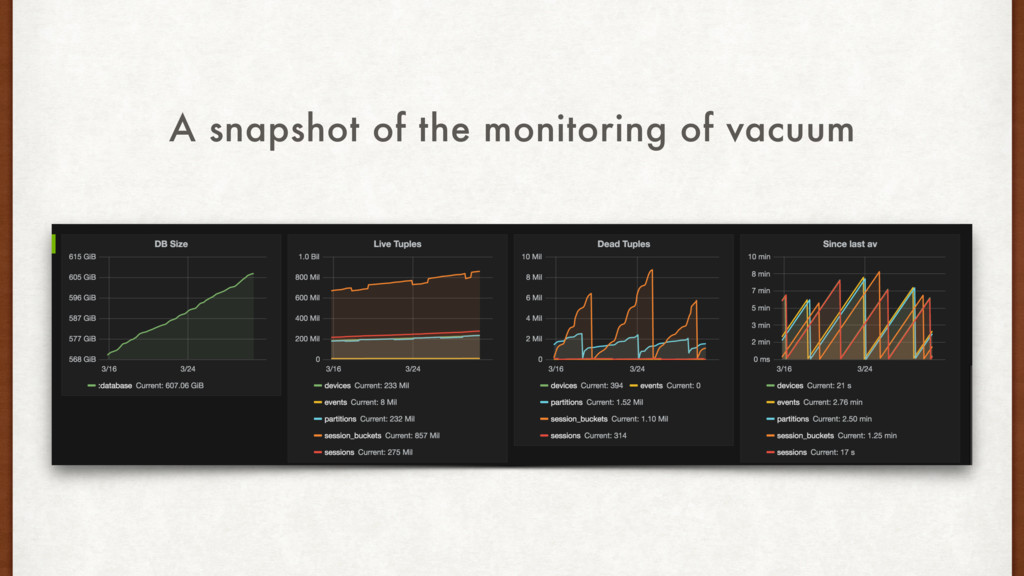
row invisible to future transactions. • AUTOVACUUM “removes” the invisible rows over time and adds them to the free space map per relation. • Actual disk space is not reclaimed to the OS during routine operations **. • The default AUTOVACUUM worker configurations are ineffective for big tables. We have no choice but to make them far more aggressive.
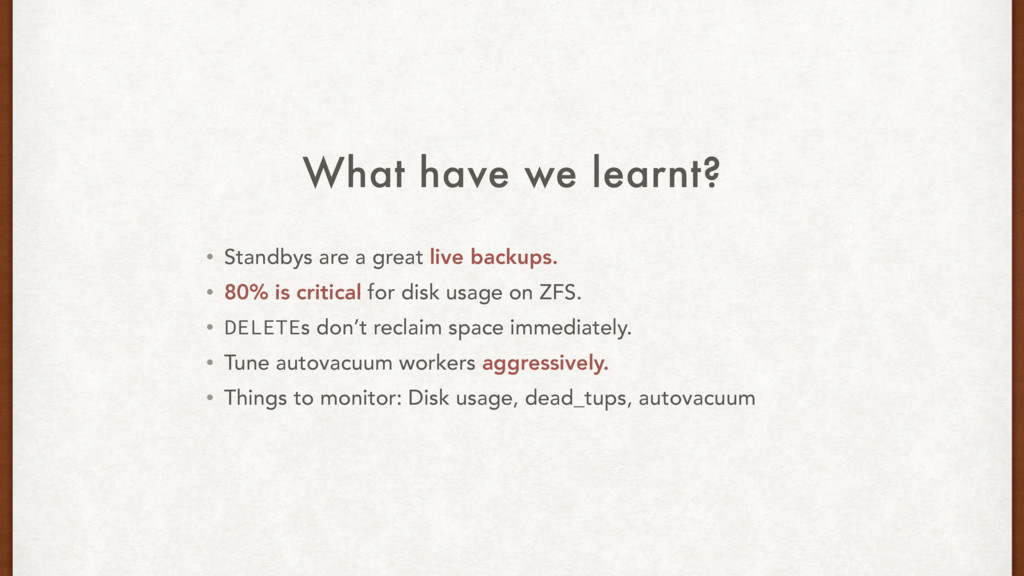
backups. • 80% is critical for disk usage on ZFS. • DELETEs don’t reclaim space immediately. • Tune autovacuum workers aggressively. • Things to monitor: Disk usage, dead_tups, autovacuum
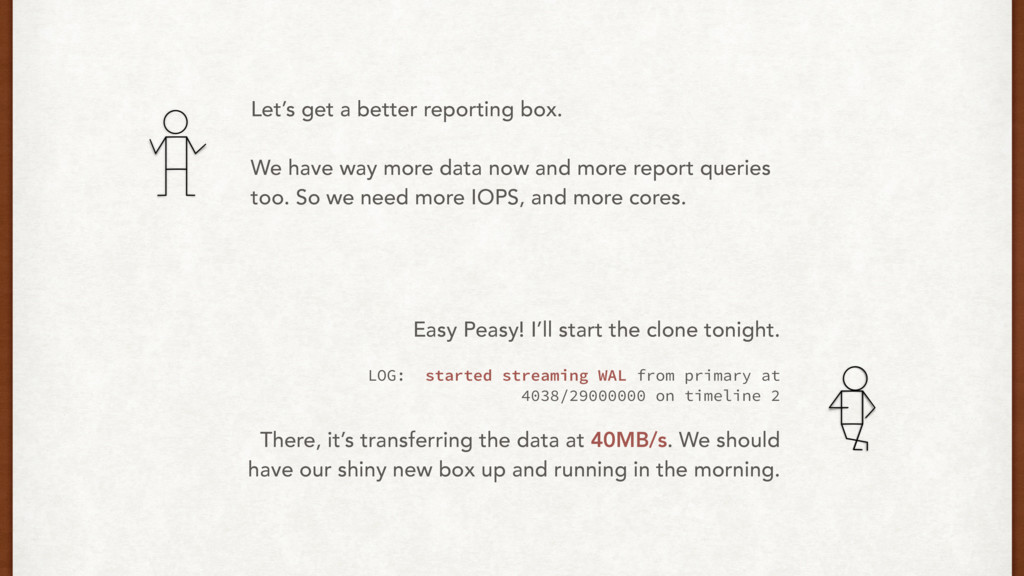
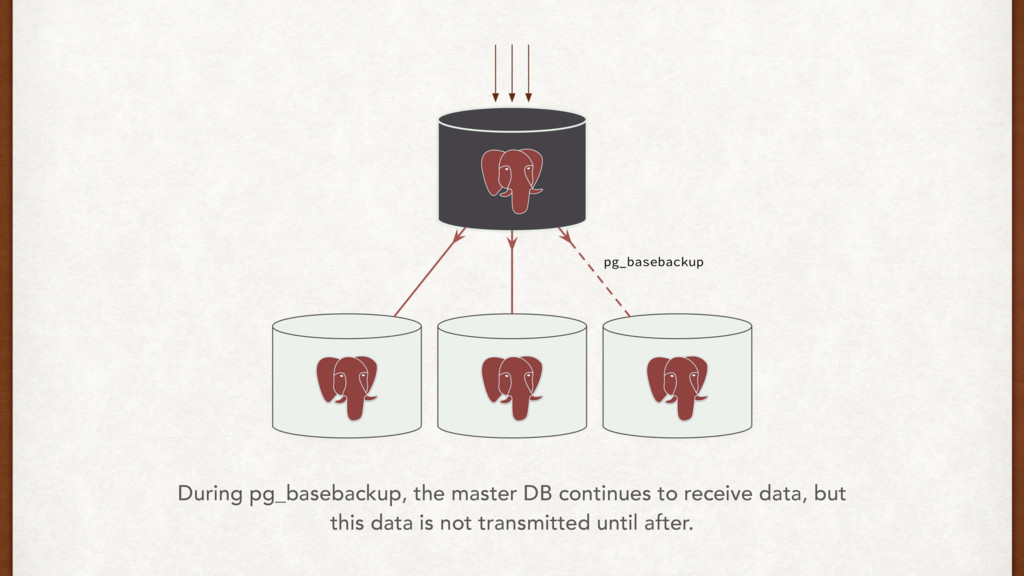
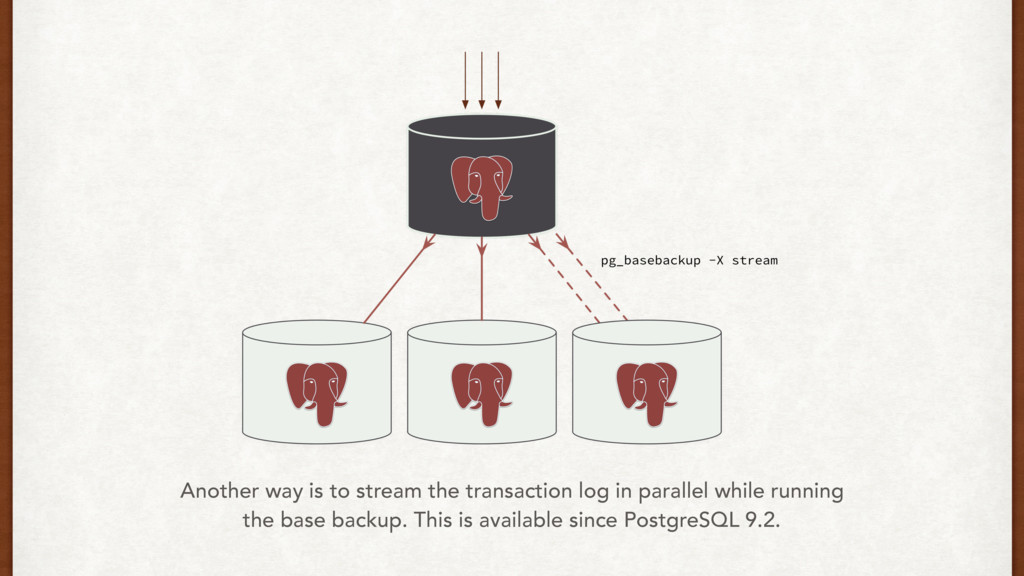
data now and more report queries too. So we need more IOPS, and more cores. Easy Peasy! I’ll start the clone tonight. LOG: started streaming WAL from primary at 4038/29000000 on timeline 2 There, it’s transferring the data at 40MB/s. We should have our shiny new box up and running in the morning.
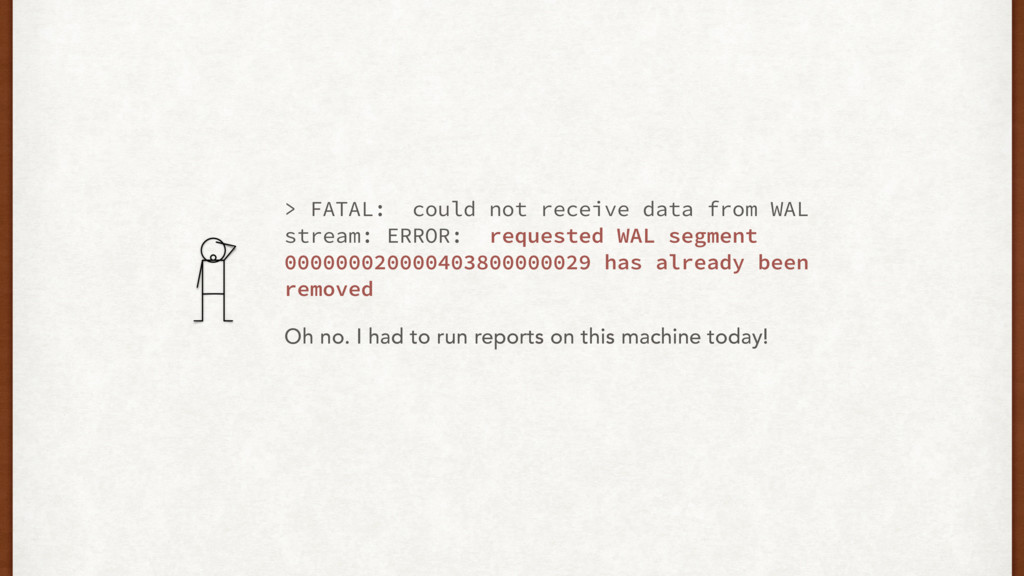
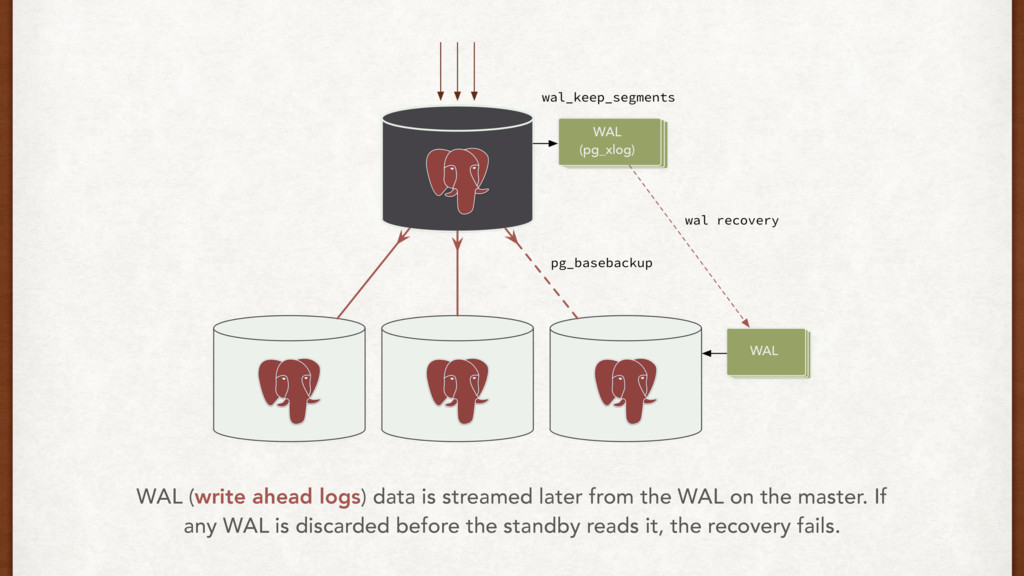
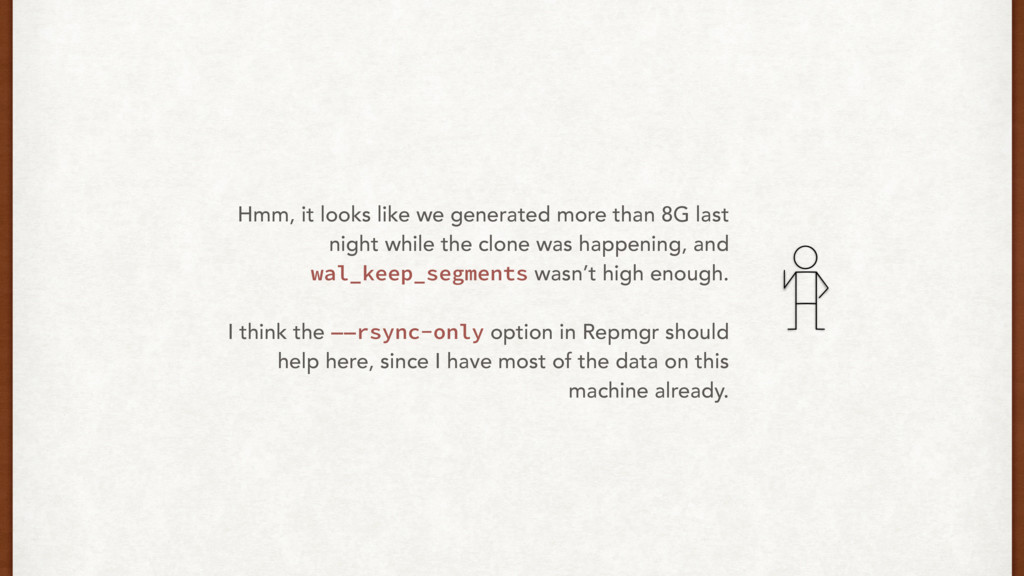
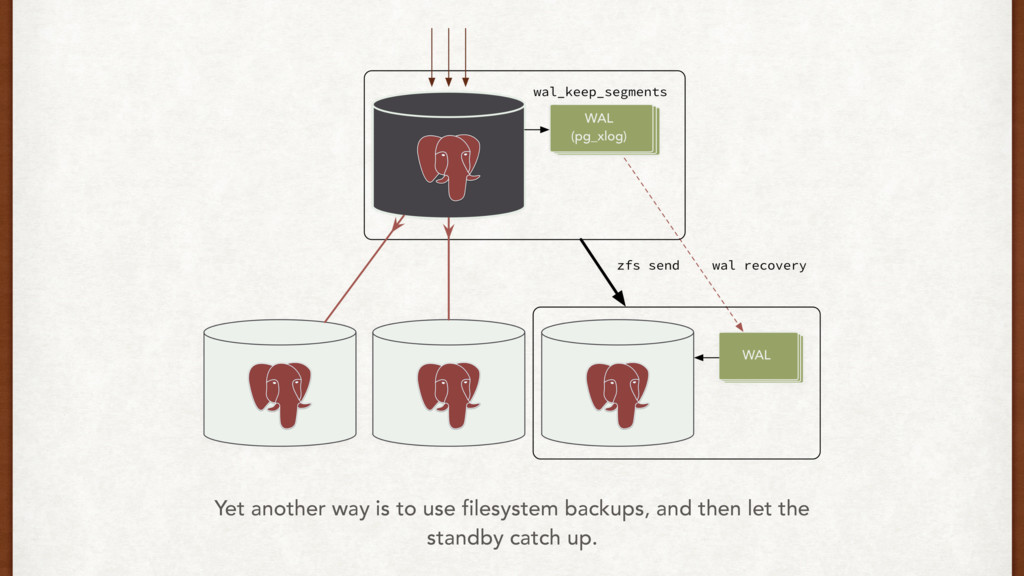
night while the clone was happening, and wal_keep_segments wasn’t high enough. I think the ——rsync-only option in Repmgr should help here, since I have most of the data on this machine already.
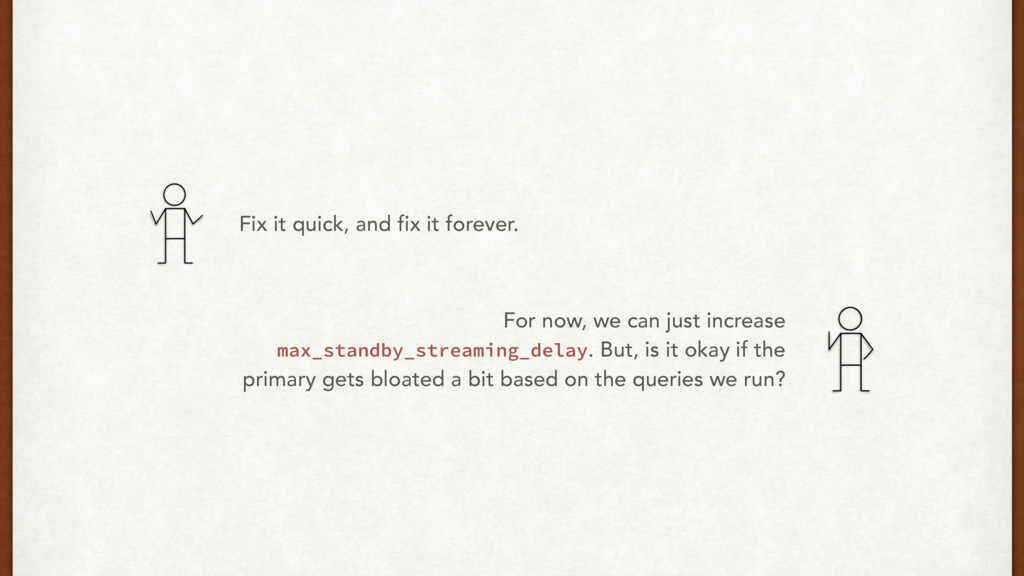
I could probably start a fresh clone, and keep wal_keep_segments higher for now. Okay, that should work for now. But how do we fix it so it doesn’t happen again?
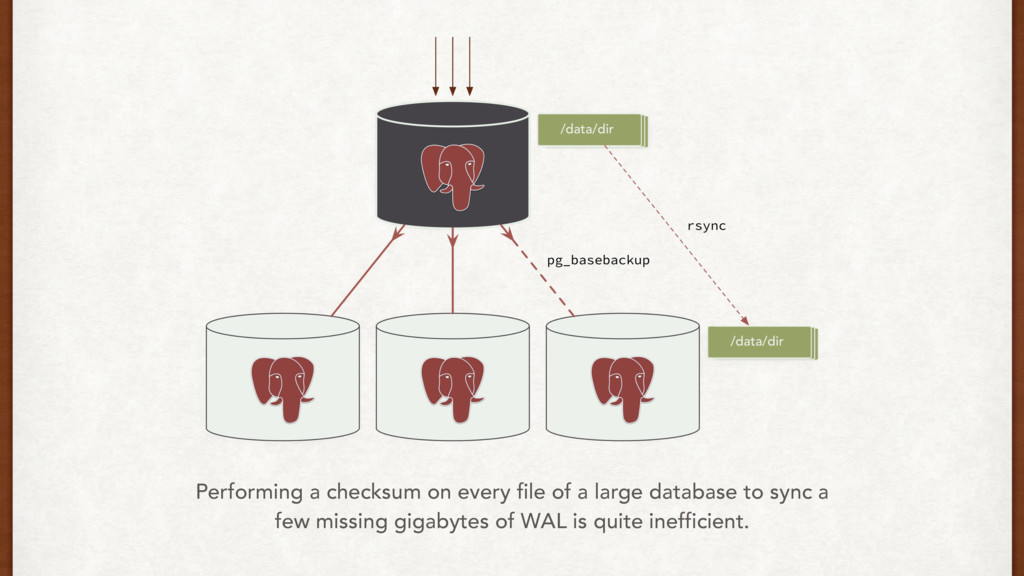
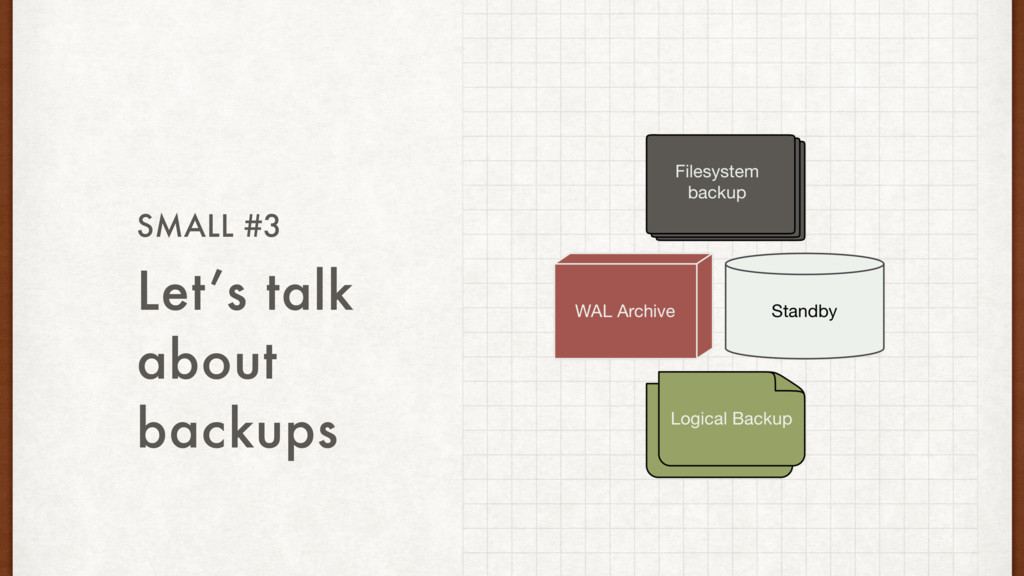
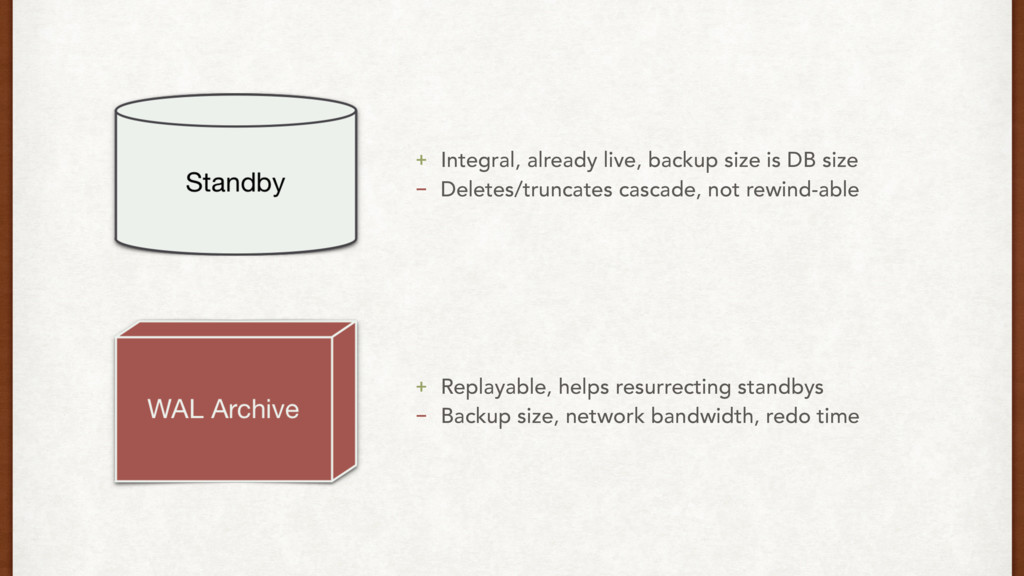
part of setting a standby. Think about it. • We can prevent against WAL recovery issues using: • WAL archives • Rsync • Filesystem backups • Things to monitor: network throughput, DB load and disk i/o on master
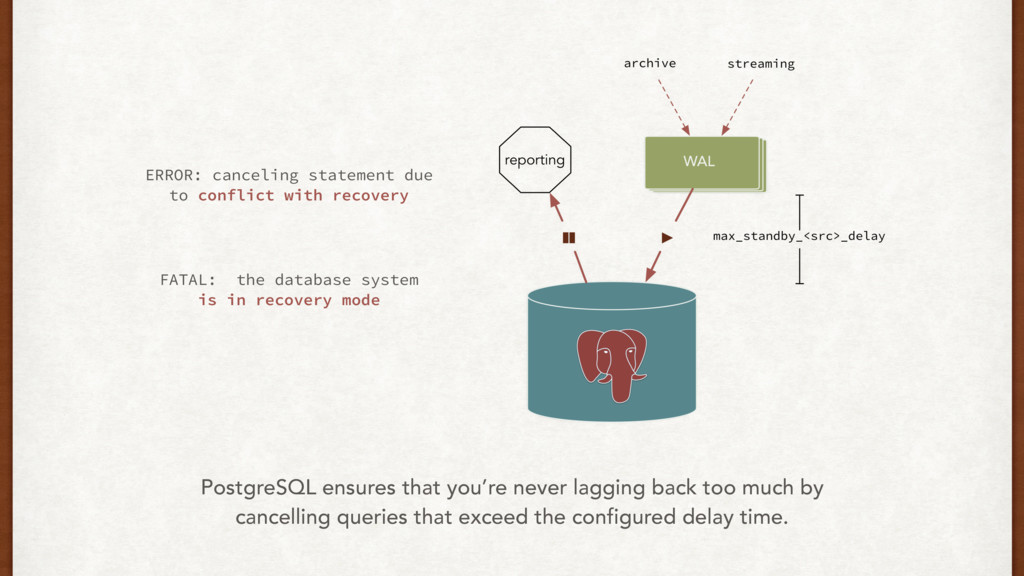
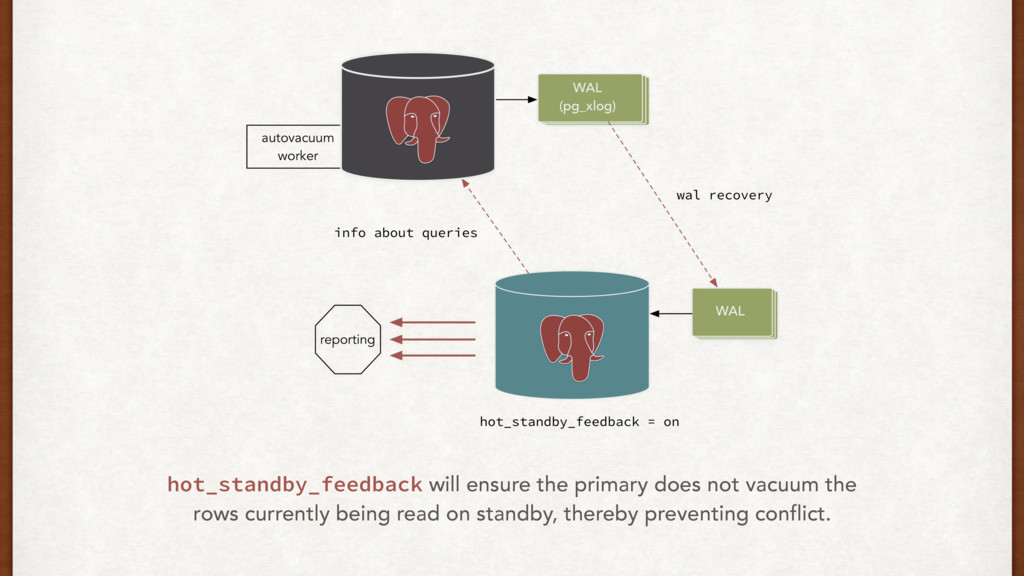
going on? ERROR: canceling statement due to conflict with recovery Detail: User query might have needed to see row versions that must be removed Oh no, too many long queries!
database system is in recovery mode PostgreSQL ensures that you’re never lagging back too much by cancelling queries that exceed the configured delay time.
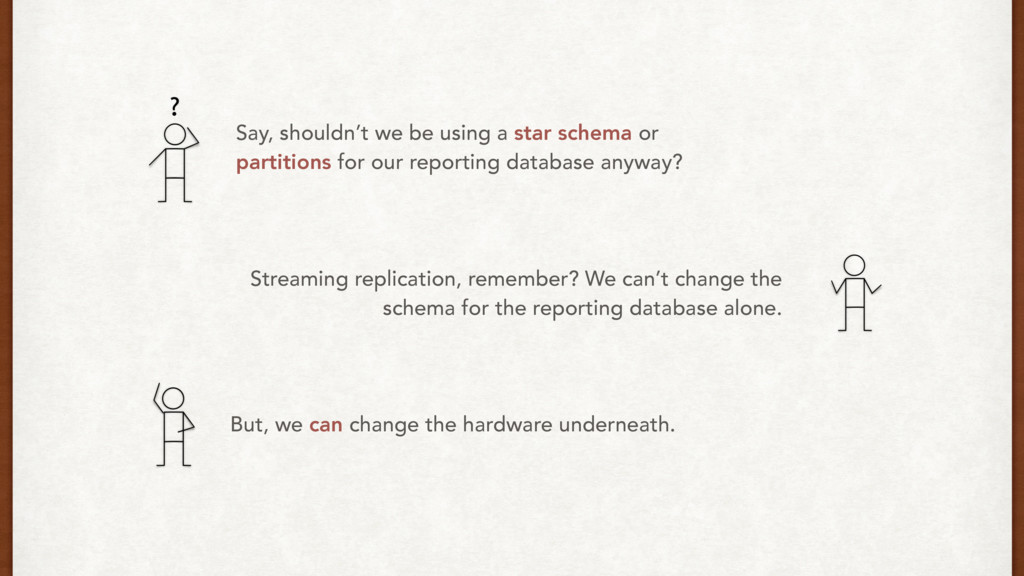
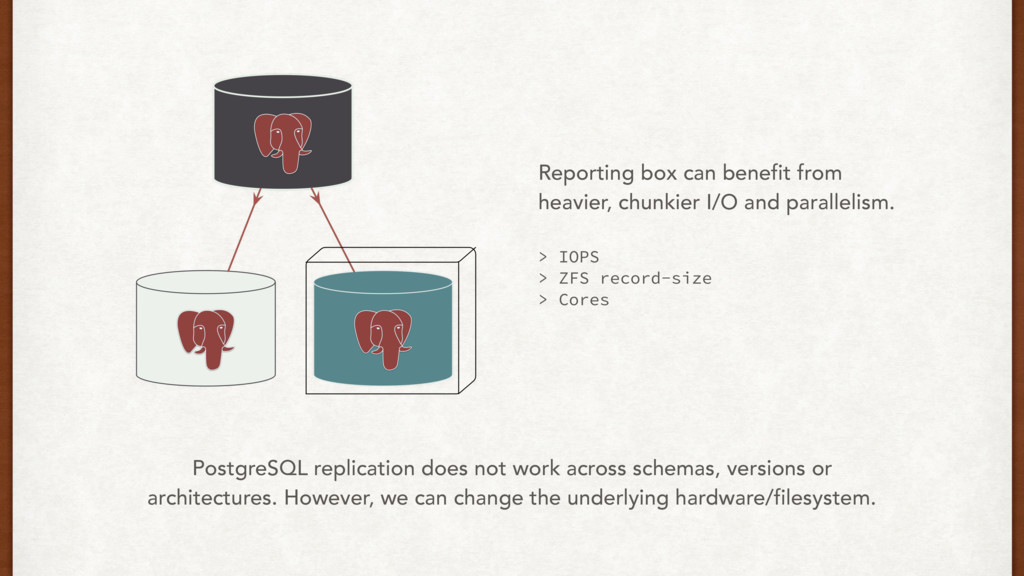
for our reporting database anyway? Streaming replication, remember? We can’t change the schema for the reporting database alone. But, we can change the hardware underneath.
> IOPS > ZFS record-size > Cores PostgreSQL replication does not work across schemas, versions or architectures. However, we can change the underlying hardware/filesystem.
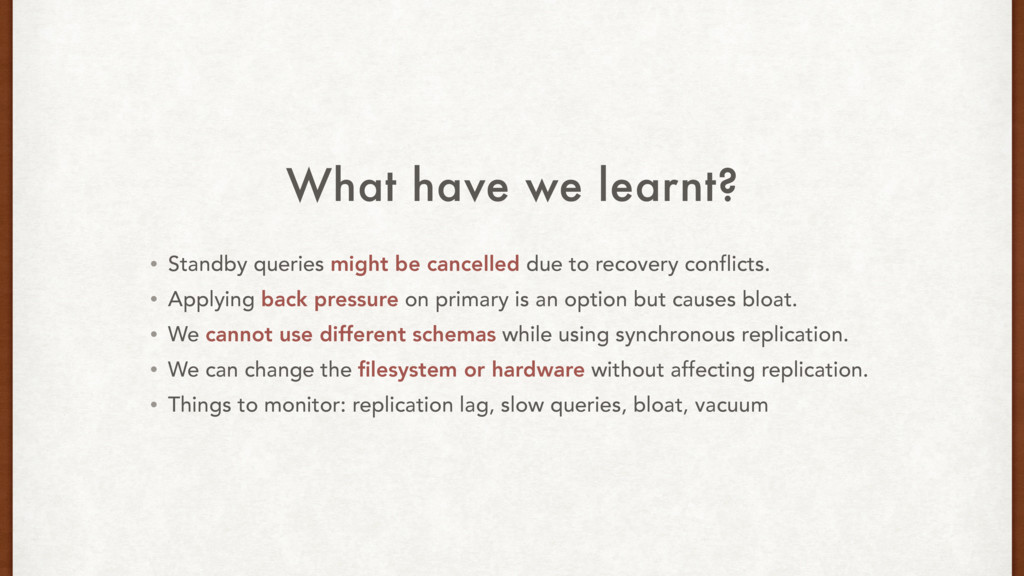
due to recovery conflicts. • Applying back pressure on primary is an option but causes bloat. • We cannot use different schemas while using synchronous replication. • We can change the filesystem or hardware without affecting replication. • Things to monitor: replication lag, slow queries, bloat, vacuum