Upgrade to Pro — share decks privately, control downloads, hide ads and more …

Monitoring OpenStack and Dynamic Infrastructure

Monitoring OpenStack and Dynamic Infrastructure

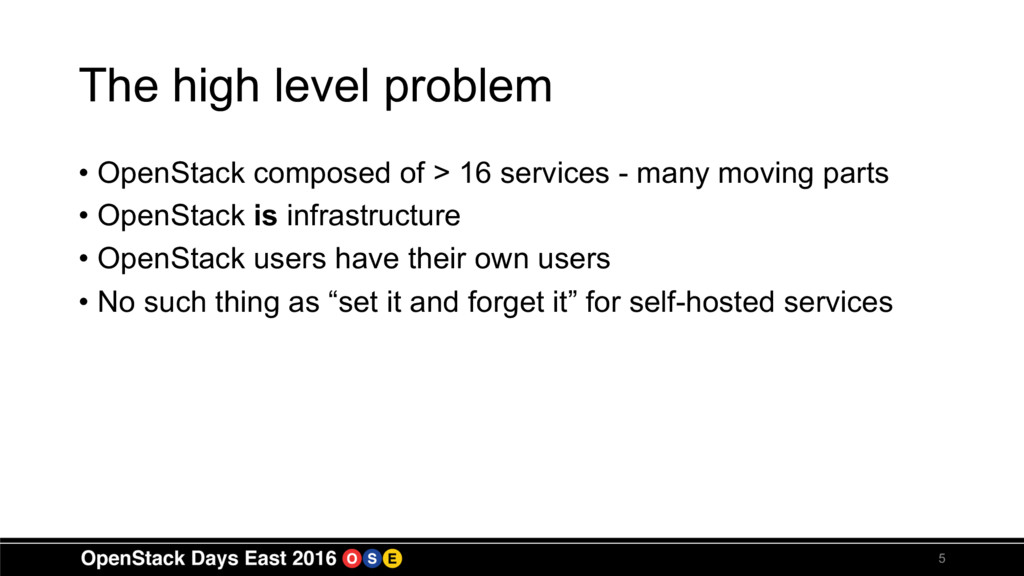
If you are running OpenStack, it's a central component of your infrastructure, providing the foundation for your VM, network, and systems management. Failure is not an option and monitoring is key.

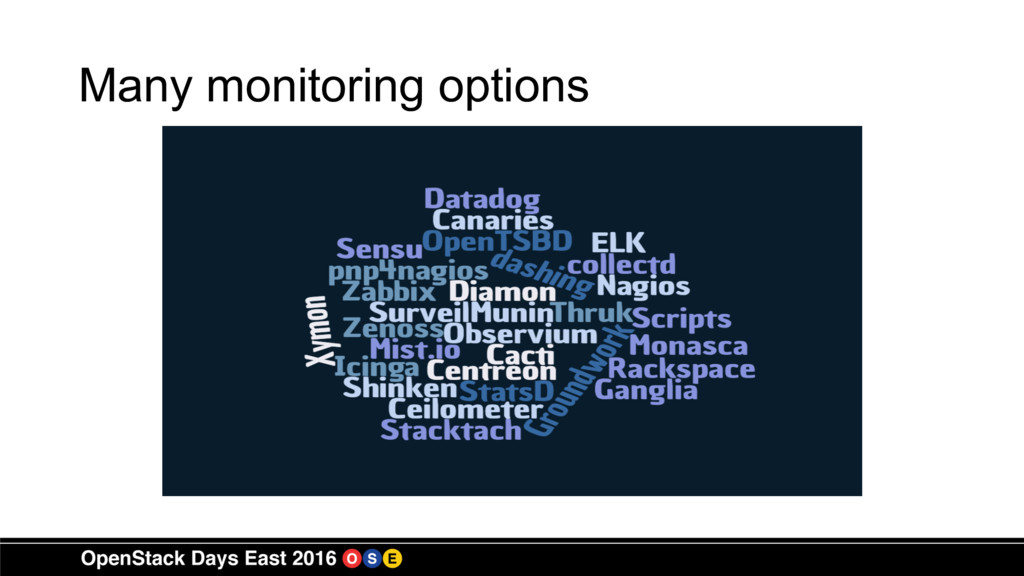
So what are your options around monitoring?

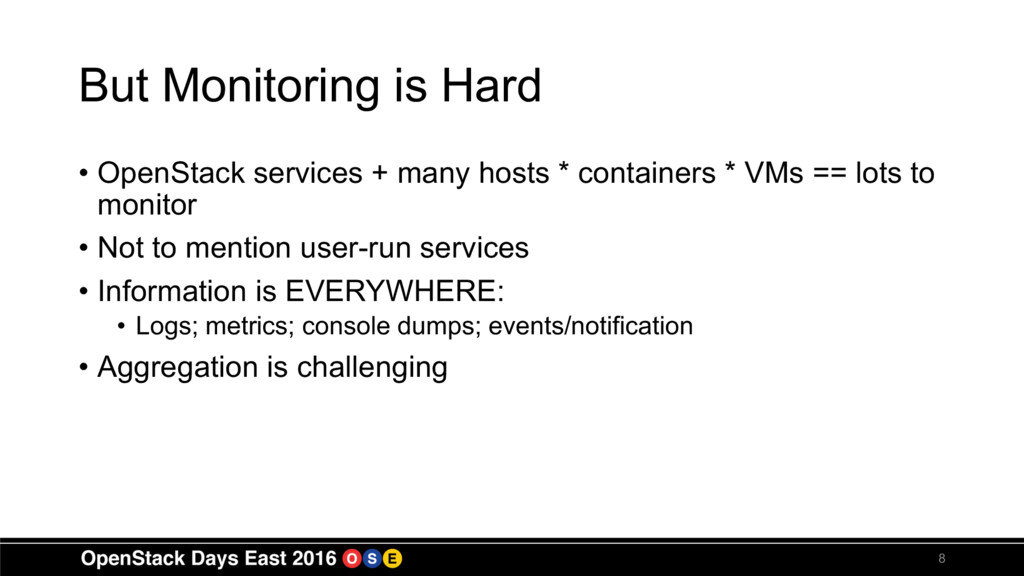
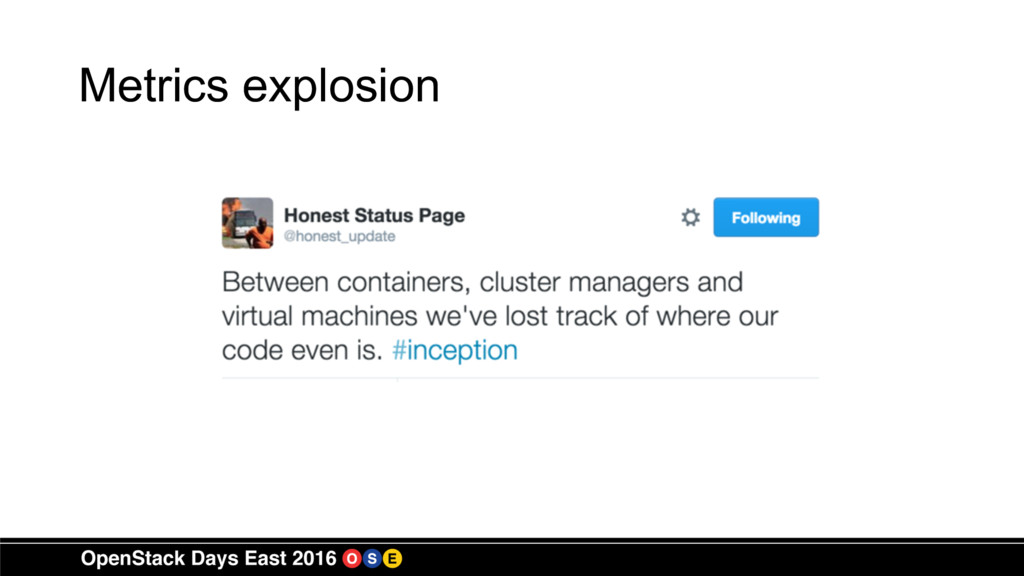
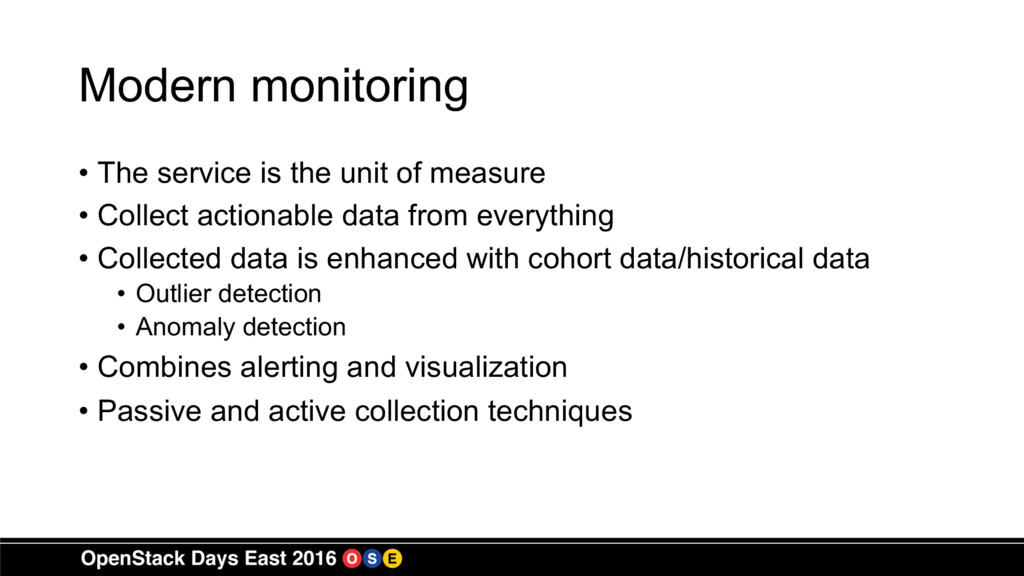
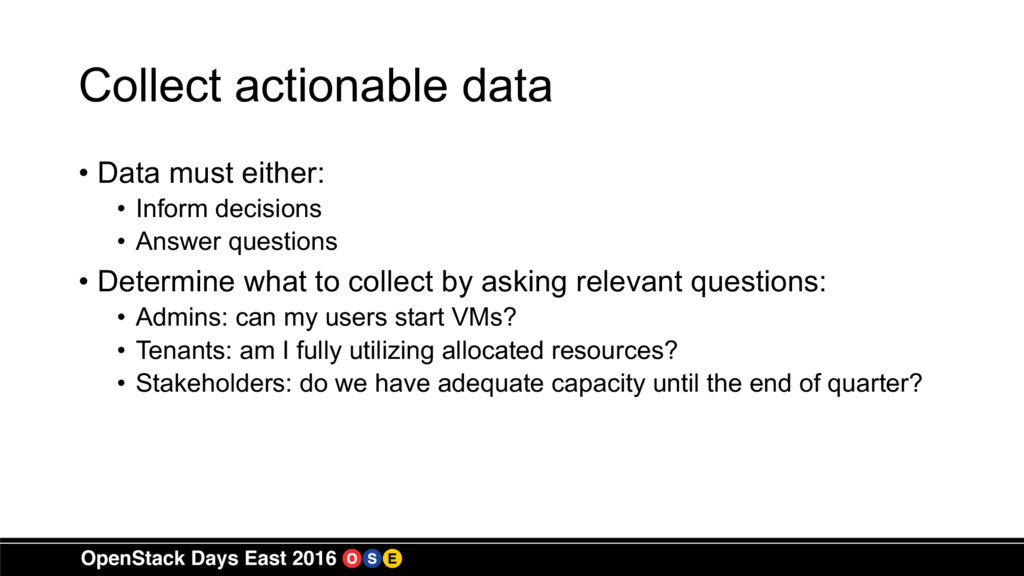
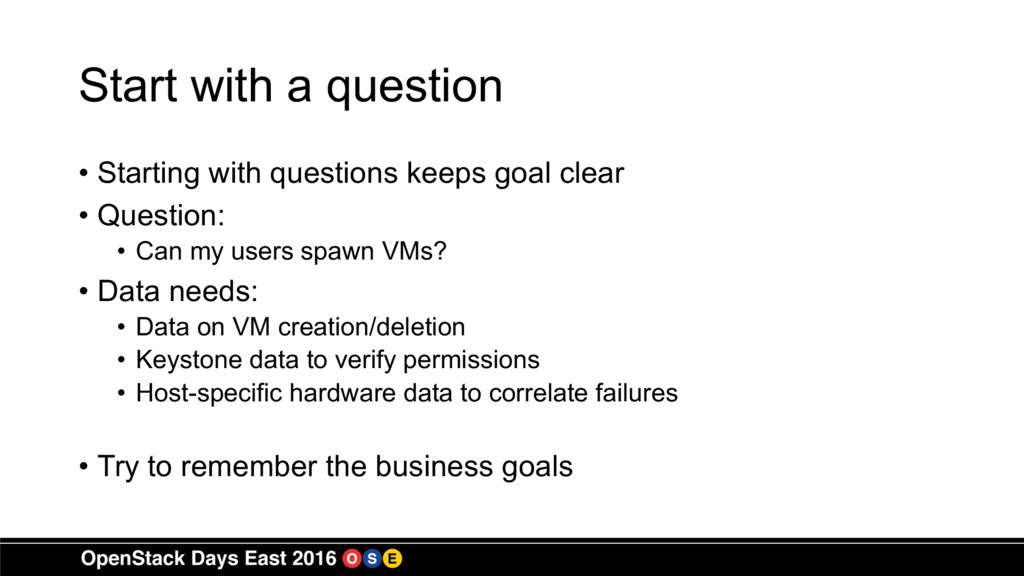
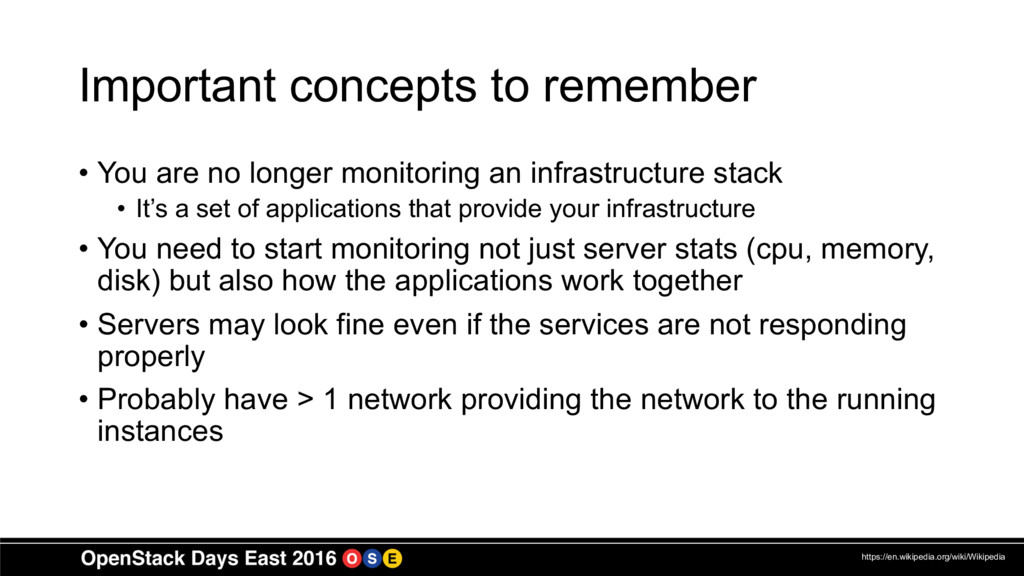
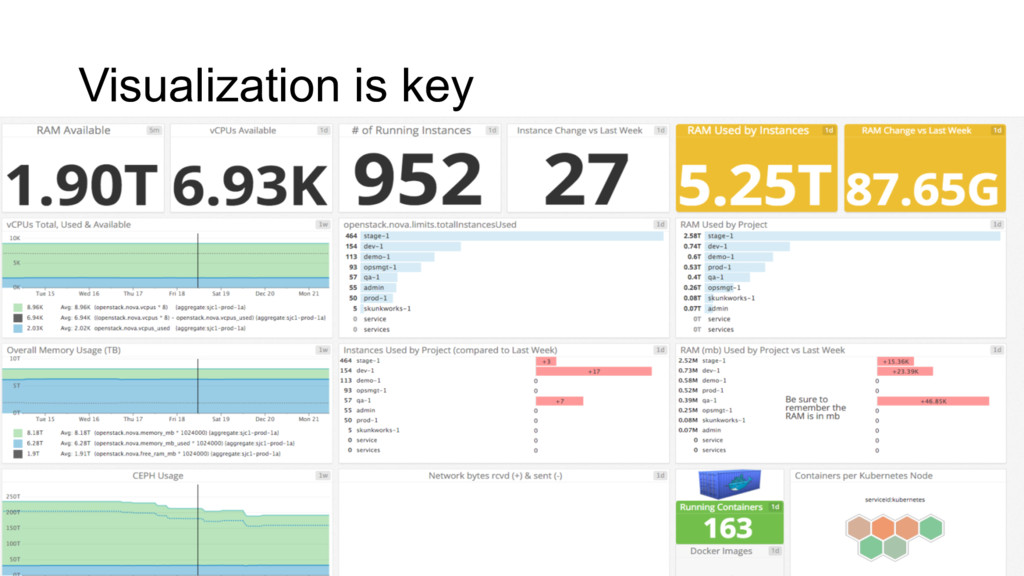
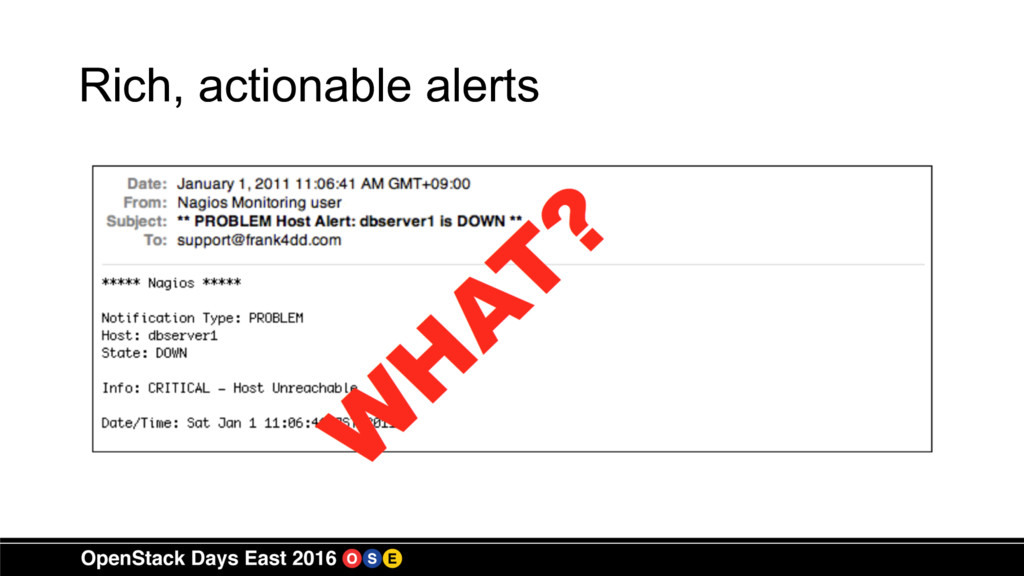
And how do you know what metrics to look at to know that your environment is available and performing optimally?

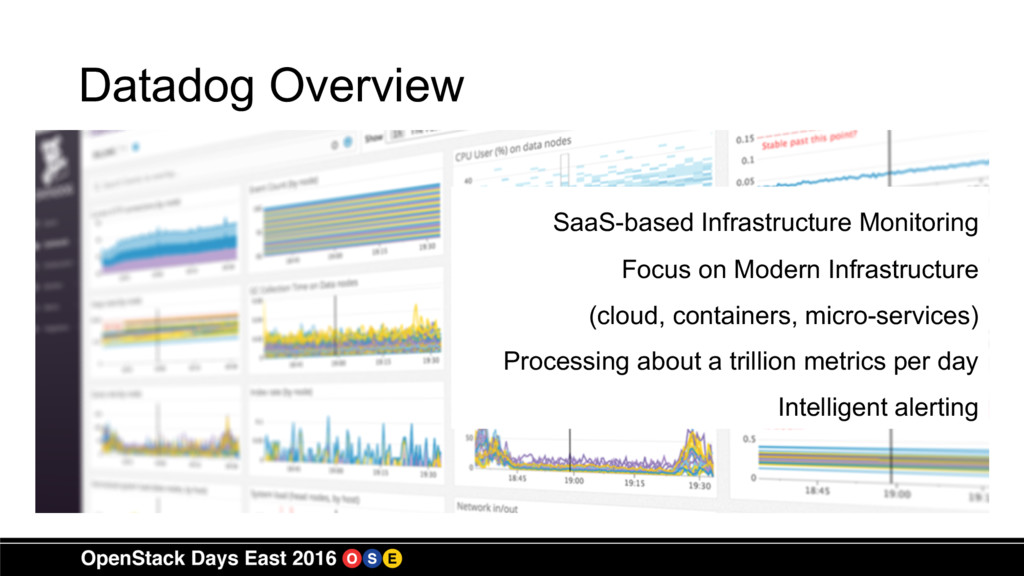
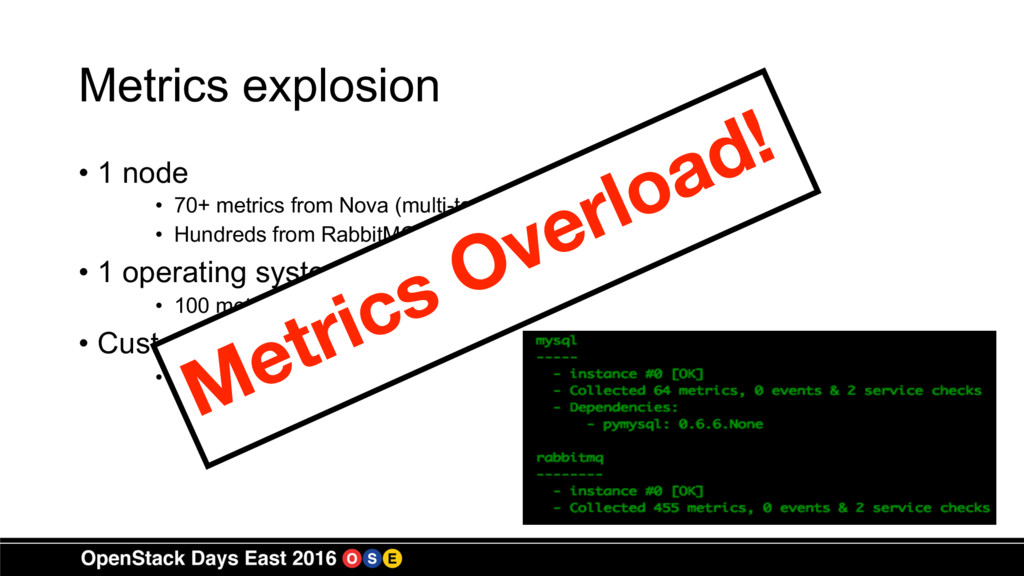
At Datadog we collect a trillion metrics a day for our customers on a variety of platforms
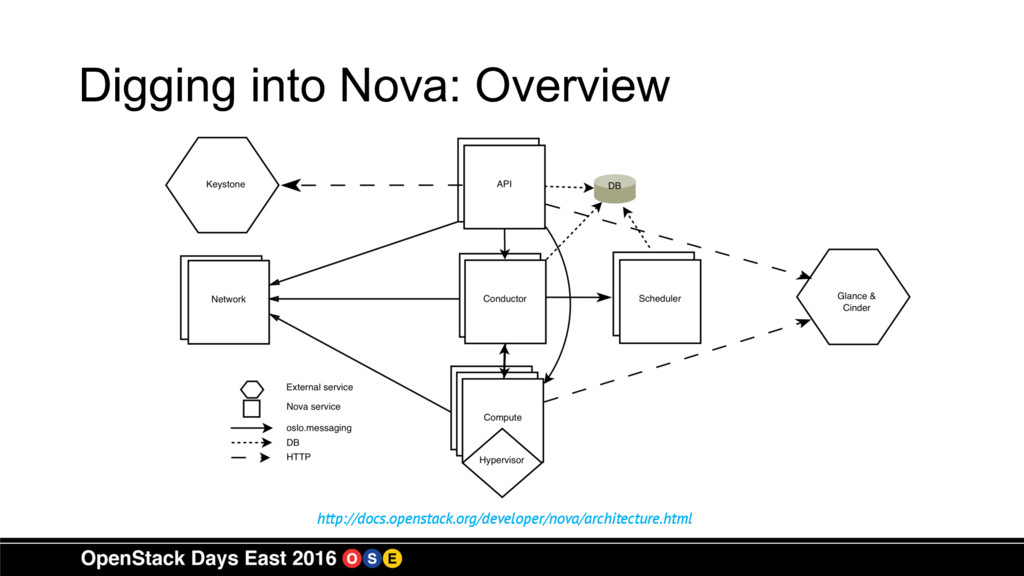
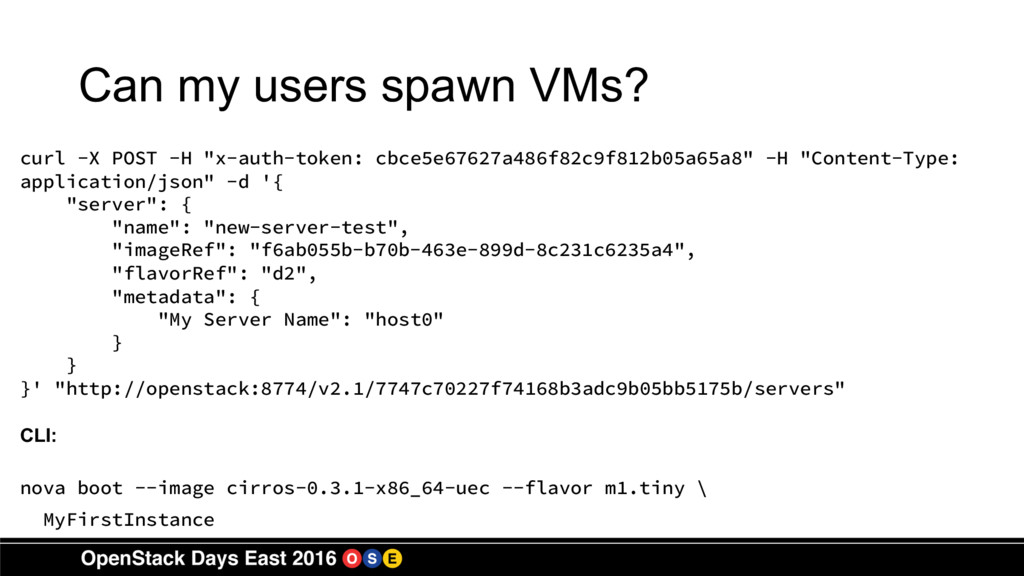
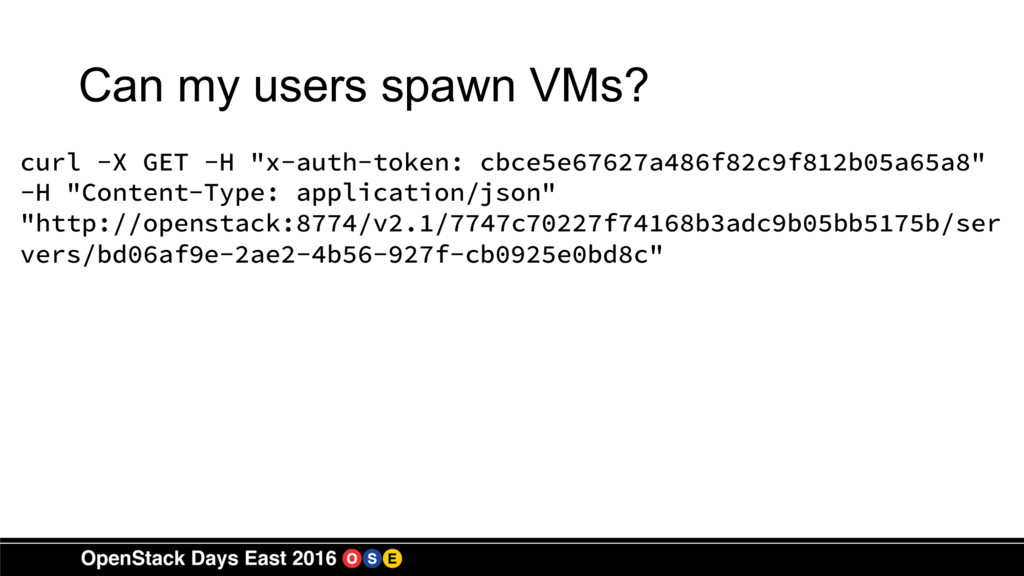
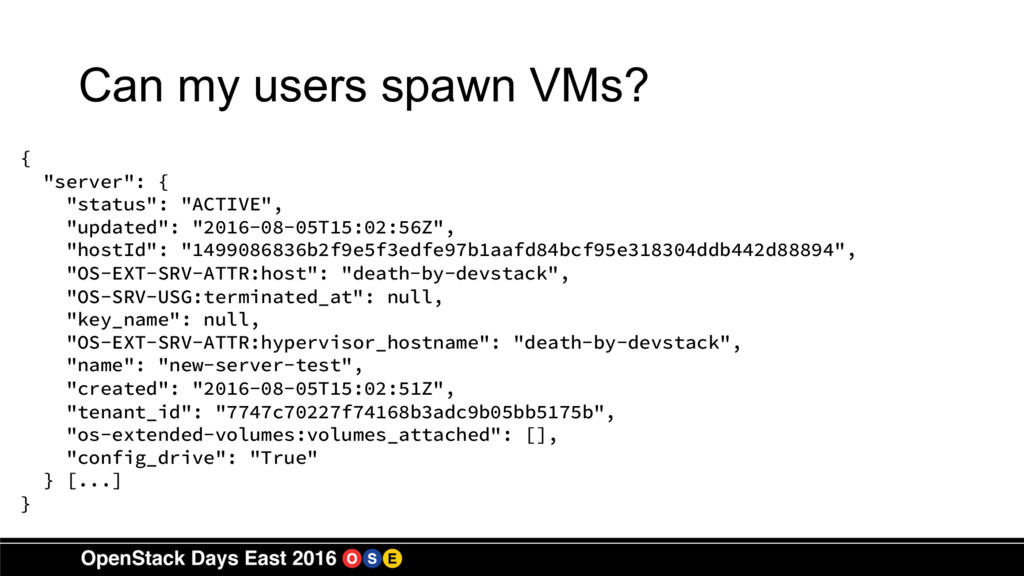
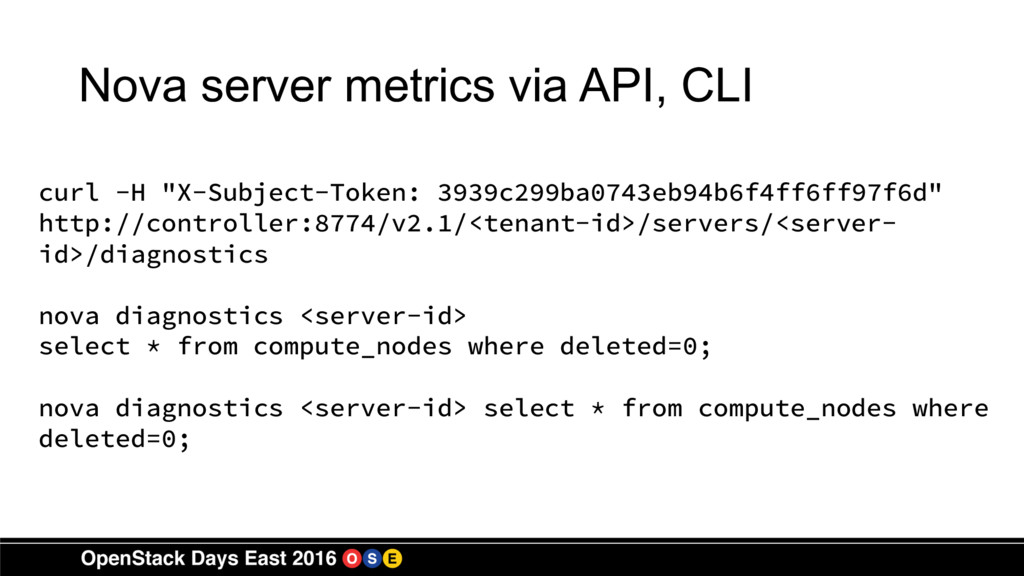
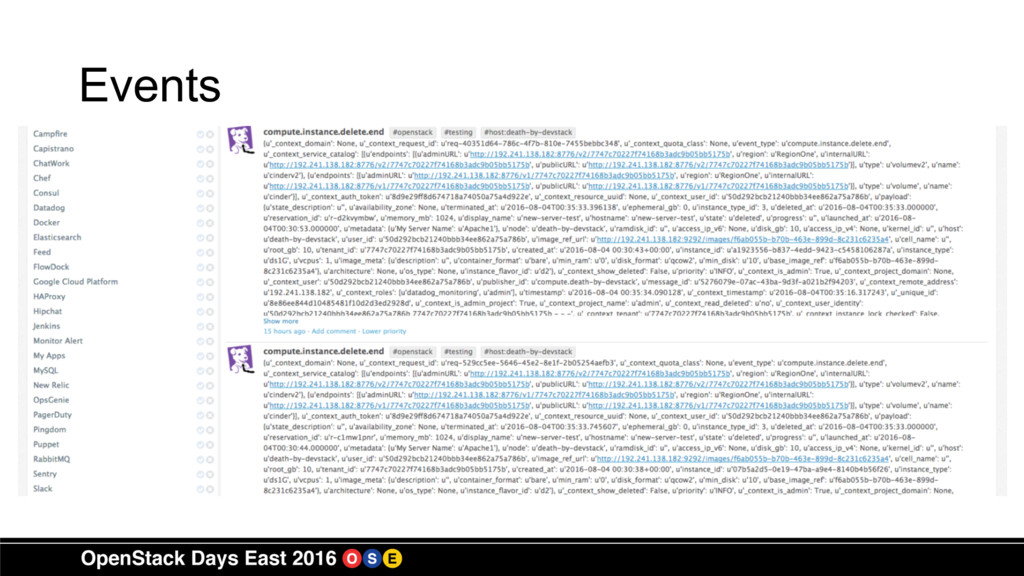
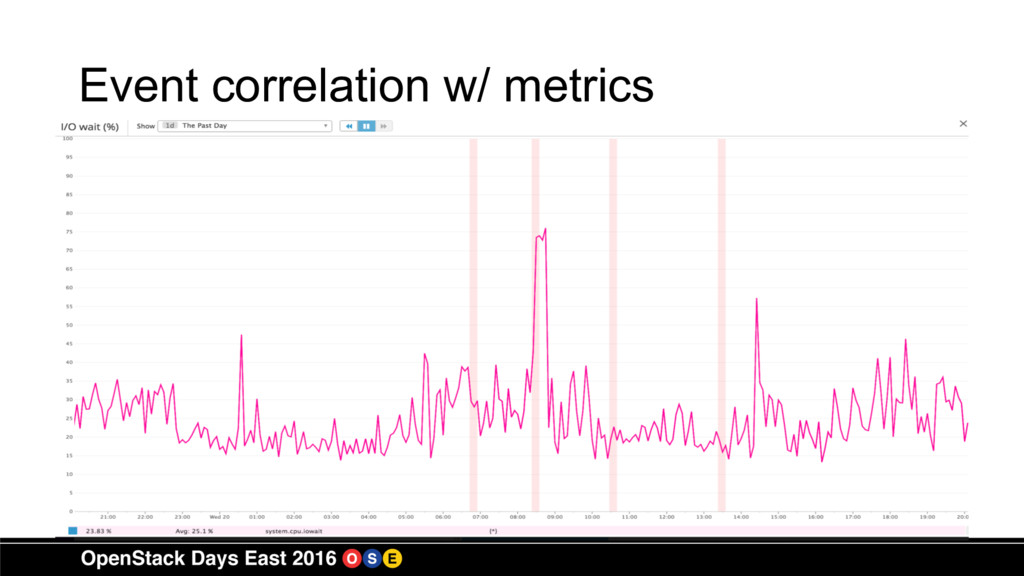
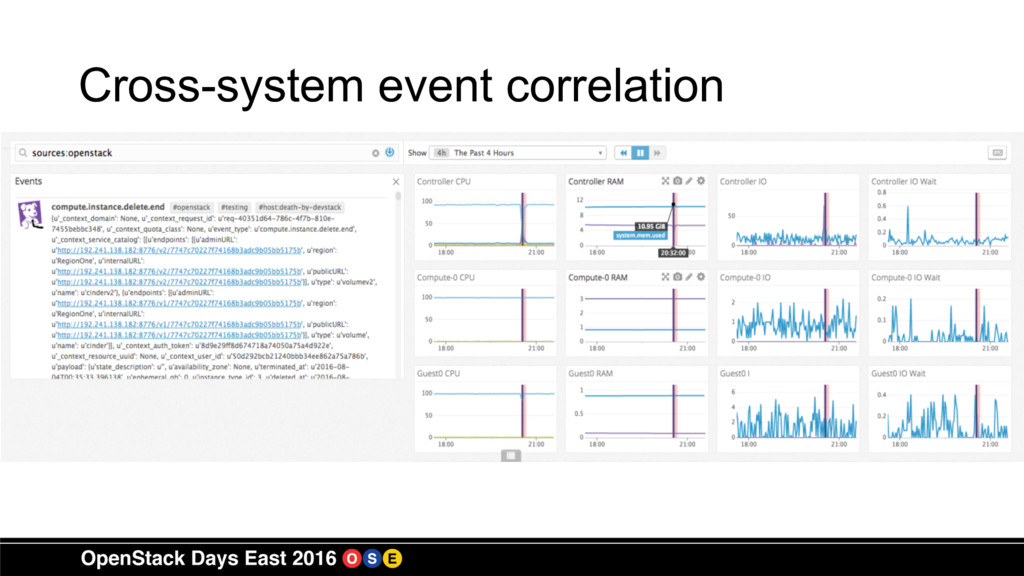
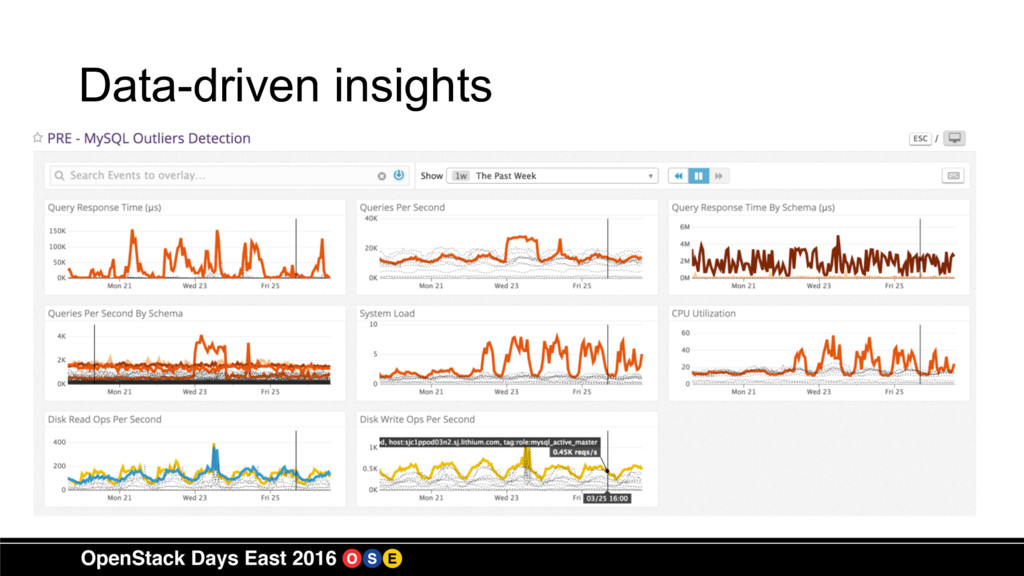
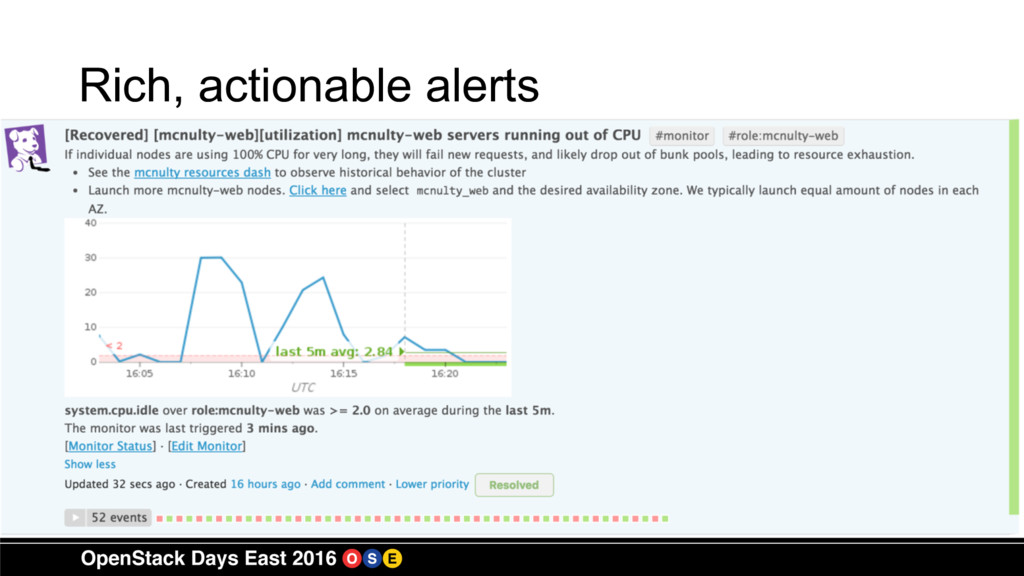
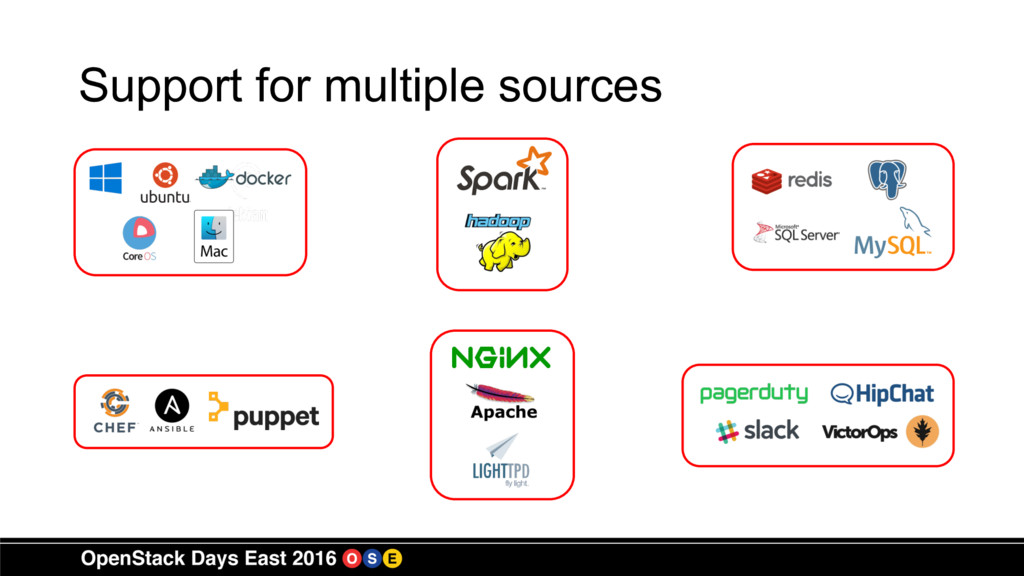
including OpenStack and have learned a lot about how to sift through all the data. This session will show you how to access performance data from OpenStack Nova, RabbitMQ, and other sources within your OpenStack environment. We will also look at parsing this data and figuring out how to take the appropriate action to ensure the environment remains healthy.

Check out this blog post for more information about our integration:
https://www.datadoghq.com/blog/openstack-monitoring-nova/

Matt Williams

August 24, 2016
Tweet

More Decks by Matt Williams

Other Decks in Technology

Transcript

  1. Datadog Overview SaaS-based Infrastructure Monitoring Focus on Modern Infrastructure (cloud,

    containers, micro-services) Processing about a trillion metrics per day Intelligent alerting
  2. The high level problem • OpenStack composed of > 16

    services - many moving parts • OpenStack is infrastructure • OpenStack users have their own users • No such thing as “set it and forget it” for self-hosted services 5
  3. But Monitoring is Hard • OpenStack services + many hosts

    * containers * VMs == lots to monitor • Not to mention user-run services • Information is EVERYWHERE: • Logs; metrics; console dumps; events/notification • Aggregation is challenging 8
  4. Metrics explosion • 1 node • 70+ metrics from Nova

    (multi-tenant metrics) • Hundreds from RabbitMQ/supporting software • 1 operating system (e.g., Linux) • 100 metrics per instance • Custom Applications • 50~ metrics
  5. Traditional monitoring • Host-centric • Collect ALL THE DATA/Instrument ALL

    THE THINGS • Historical data is good to have • Passive collection
  6. Modern monitoring • The service is the unit of measure

    • Collect actionable data from everything • Collected data is enhanced with cohort data/historical data • Outlier detection • Anomaly detection • Combines alerting and visualization • Passive and active collection techniques
  7. Collect actionable data • Data must either: • Inform decisions

    • Answer questions • Determine what to collect by asking relevant questions: • Admins: can my users start VMs? • Tenants: am I fully utilizing allocated resources? • Stakeholders: do we have adequate capacity until the end of quarter?
  8. Start with a question • Starting with questions keeps goal

    clear • Question: • Can my users spawn VMs? • Data needs: • Data on VM creation/deletion • Keystone data to verify permissions • Host-specific hardware data to correlate failures • Try to remember the business goals
  9. Everyone wants metrics • Operators need metrics on infrastructure and

    OpenStack services • Service administrators need metrics on the services they provide • End users want metrics on the applications they run
  10. Digging into Nova: Overview • Daemons • Are they up?

    • APIs: • Up? • Responding quickly? Without errors? • Services: • Full functionality? • Doing their thing quickly?
  11. Digging into Nova: Daemons • Question: • Are the necessary

    daemons running (correctly)? • Data needs: • ps output/process check • Keystone logs to verify permissions • Host-specific hardware data to correlate failures
  12. Digging into Nova: APIs • Questions: • Are the APIs

    up? • Are they responding quickly? • Data needs: • Service check for availability • Latency monitoring • Network data
  13. Digging into Nova: Functionality • Questions: • Can users start/stop

    VMs? • Are volumes attaching correctly? • Data needs: • Canaries routinely check VM spawning • Keystone logs for failed authorizations • Hardware metrics
  14. Tools are available out of the box • Horizon •

    Difficult to create cross-tenant and/or rollup reports • Multi-region compounds the cross-tenant issues • Not very user friendly for all teams involved (Ops, DevOps, Dev, Finance, Mgmt, etc.) • Doesn’t have time-based metrics to show usage over time • Nova APIs • Rolling your own? Who really has time for that? • Need to run graphite (or similar) to represent the data • Push metrics into statsd or similar service using Python
  15. Getting our hands dirty: tools • curl • top •

    ps • nova • Mysql client • RabbitMQ client
  16. Are the daemons running? root 26721 0.0 0.0 11992 2220

    pts/20 S+ 21:59 0:00 grep --color=auto nova stack 28910 1.2 0.5 240576 92412 pts/11 S+ Aug01 45:16 /usr/bin/python /usr/local/bin/nova- scheduler --config-file /etc/nova/nova.conf stack 29915 1.2 0.7 270672 120208 pts/8 S+ Aug01 44:59 /usr/bin/python /usr/local/bin/nova- api stack 29937 1.2 0.4 229212 80636 pts/9 S+ Aug01 44:11 /usr/bin/python /usr/local/bin/nova- conductor --config-file /etc/nova/nova.conf stack 29945 0.0 0.7 283088 127160 pts/8 S+ Aug01 0:04 /usr/bin/python /usr/local/bin/nova- api stack 29946 1.1 0.8 311104 141984 pts/8 S+ Aug01 40:36 /usr/bin/python /usr/local/bin/nova- api
  17. curl -X POST -H "x-auth-token: cbce5e67627a486f82c9f812b05a65a8" -H "Content-Type: application/json" -d

    '{ "server": { "name": "new-server-test", "imageRef": "f6ab055b-b70b-463e-899d-8c231c6235a4", "flavorRef": "d2", "metadata": { "My Server Name": "host0" } } }' "http://openstack:8774/v2.1/7747c70227f74168b3adc9b05bb5175b/servers" CLI: nova boot --image cirros-0.3.1-x86_64-uec --flavor m1.tiny \ MyFirstInstance Can my users spawn VMs?
  18. Can my users spawn VMs? curl -X GET -H "x-auth-token:

    cbce5e67627a486f82c9f812b05a65a8" -H "Content-Type: application/json" "http://openstack:8774/v2.1/7747c70227f74168b3adc9b05bb5175b/ser vers/bd06af9e-2ae2-4b56-927f-cb0925e0bd8c"
  19. { "server": { "status": "ACTIVE", "updated": "2016-08-05T15:02:56Z", "hostId": "1499086836b2f9e5f3edfe97b1aafd84bcf95e318304ddb442d88894", "OS-EXT-SRV-ATTR:host":

    "death-by-devstack", "OS-SRV-USG:terminated_at": null, "key_name": null, "OS-EXT-SRV-ATTR:hypervisor_hostname": "death-by-devstack", "name": "new-server-test", "created": "2016-08-05T15:02:51Z", "tenant_id": "7747c70227f74168b3adc9b05bb5175b", "os-extended-volumes:volumes_attached": [], "config_drive": "True" } [...] } Can my users spawn VMs?
  20. Nova server metrics via API, CLI curl -H "X-Subject-Token: 3939c299ba0743eb94b6f4ff6ff97f6d"

    http://controller:8774/v2.1/<tenant-id>/servers/<server- id>/diagnostics nova diagnostics <server-id> select * from compute_nodes where deleted=0; nova diagnostics <server-id> select * from compute_nodes where deleted=0;
  21. Important concepts to remember • You are no longer monitoring

    an infrastructure stack • It’s a set of applications that provide your infrastructure • You need to start monitoring not just server stats (cpu, memory, disk) but also how the applications work together • Servers may look fine even if the services are not responding properly • Probably have > 1 network providing the network to the running instances https://en.wikipedia.org/wiki/Wikipedia