Upgrade to Pro — share decks privately, control downloads, hide ads and more …

Graphs are Feeding the World

Graphs are Feeding the World

Slides from a talk given at GraphConnect San Francisco, 21 October 2015
http://graphconnect.com/speaker/tim-williamson/

Video of this talk can be found on YouTube:
https://youtu.be/6KEvLURBenM

Abstract:

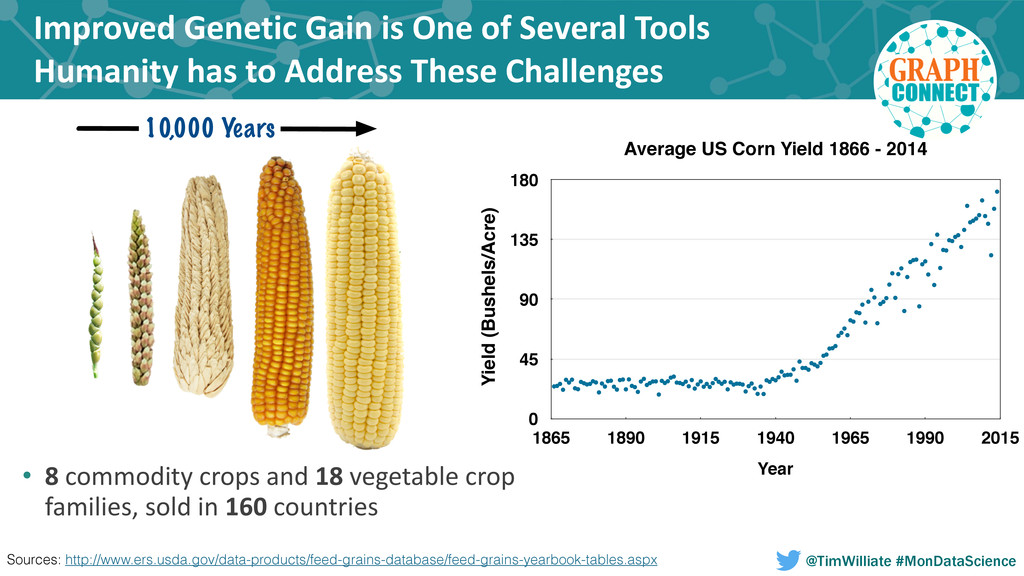
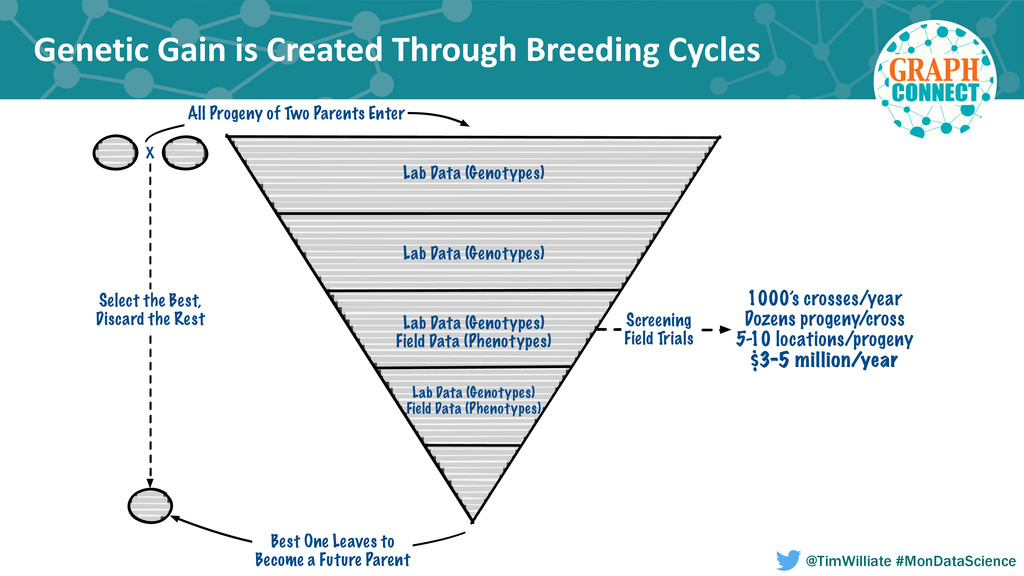
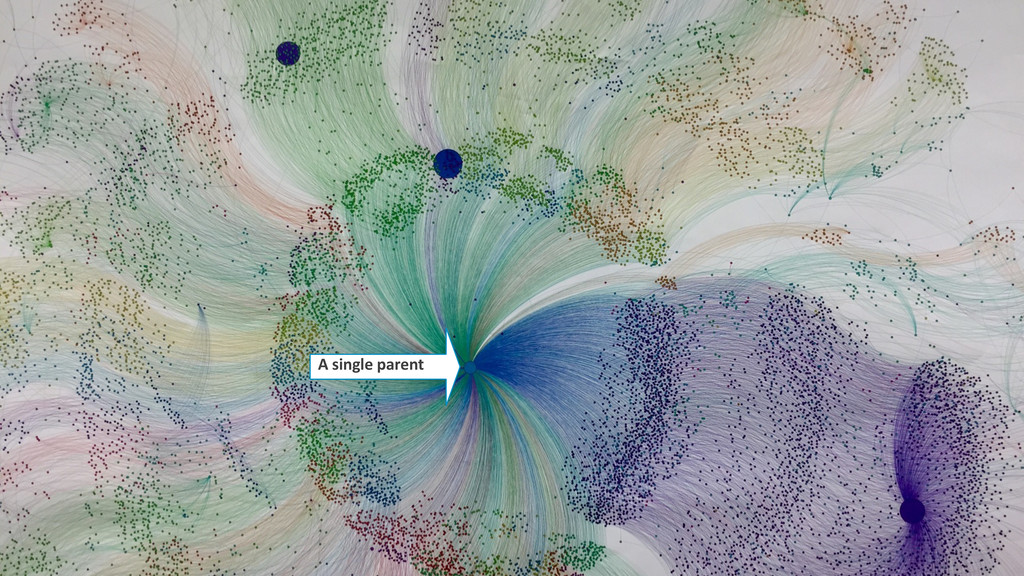
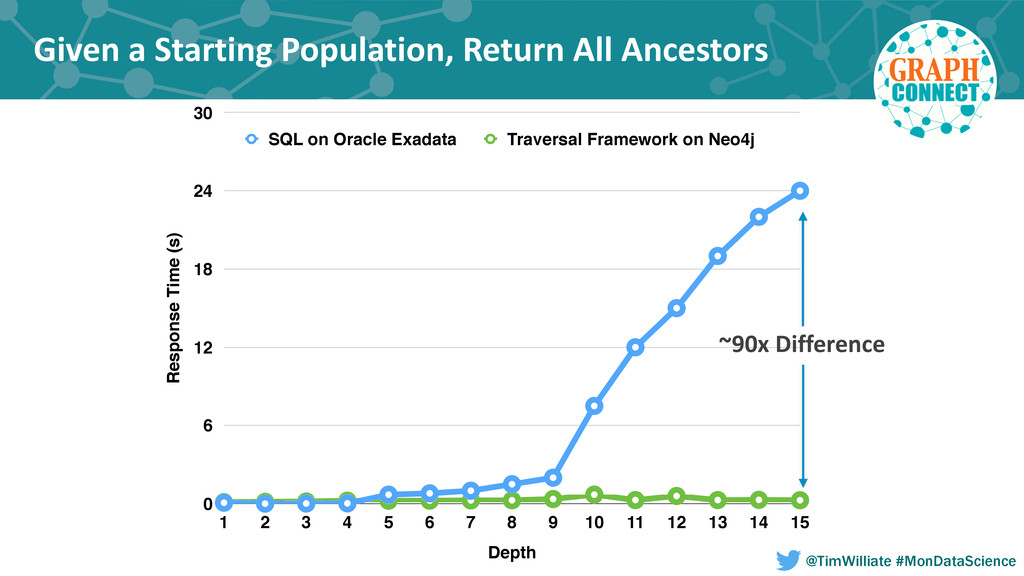
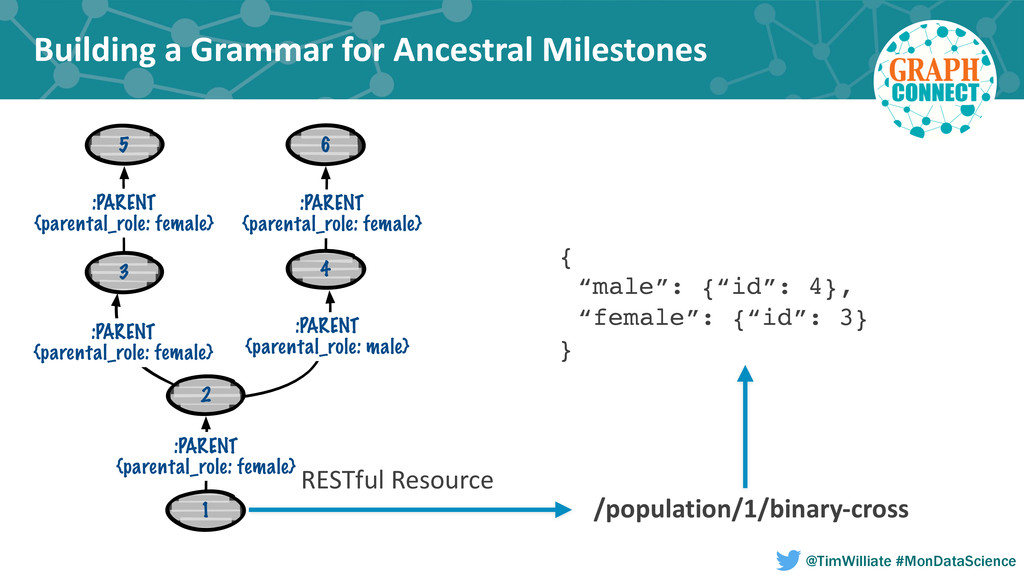
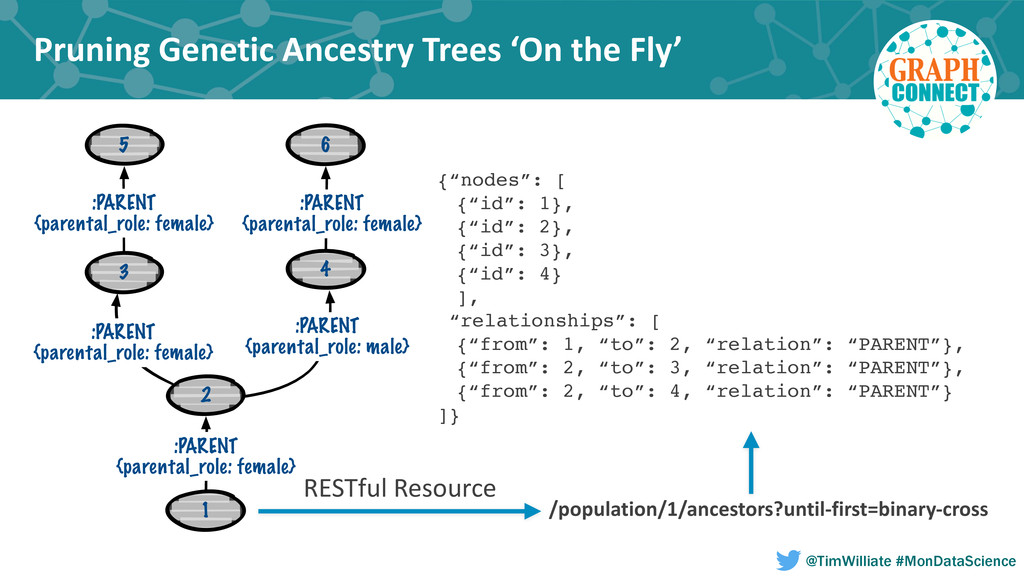
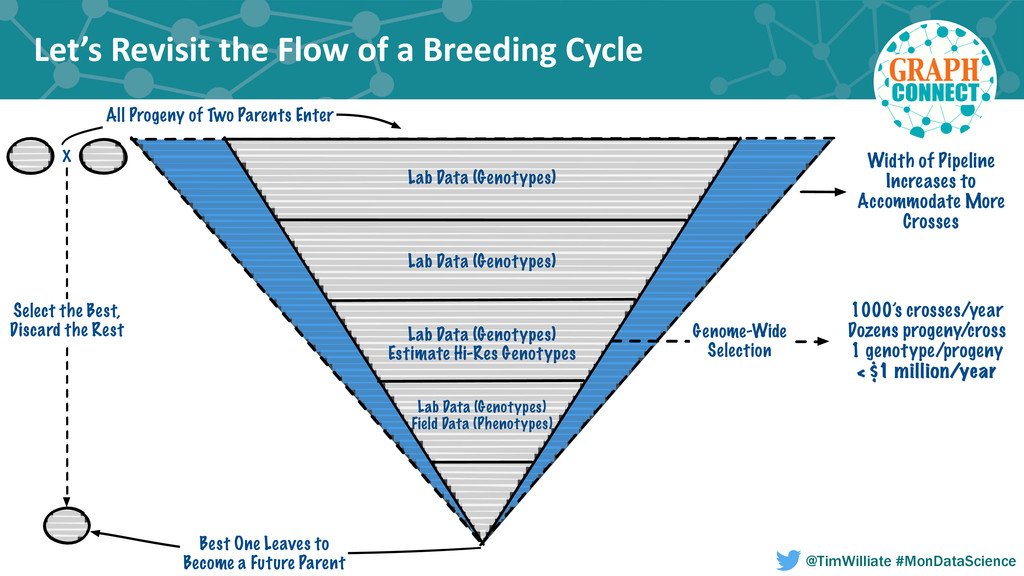
Modern agriculture has seen only four major transformations in the last century that started with the hybridization of crops including corn and the development of biotech traits; both of which dramatically improved farm productivity and profitability. More recently the application of molecular techniques to crop development combined with a nondestructive seed sampling process called seed chipping have increased the rate of yield gain in new hybrids and varieties of row crops such as corn, soybeans and cotton. The agricultural industry is currently in the midst of an information revolution that will enable farmers globally to meet the growing need for food, fuel and fiber as the world population climbs to 10 billion and a greater fraction shifts to an animal based diet. This information revolution requires the near real-time integration of multiple disparate data sources including ancestry, genomic, market and grower data. Each one of these data sources spans one or more decades and are complex in and of themselves. An example is the movement of seeds through the product development pipeline, beginning at the earliest recorded discovery breeding cross, and ending with the most recent commercialized products. Historically the constraints of modeling and processing this data within a relational database has made drawing inferences from this dataset complex and computationally infeasible at the scale required for modern analytics uses such as prescriptive breeding and genome-wide selection.

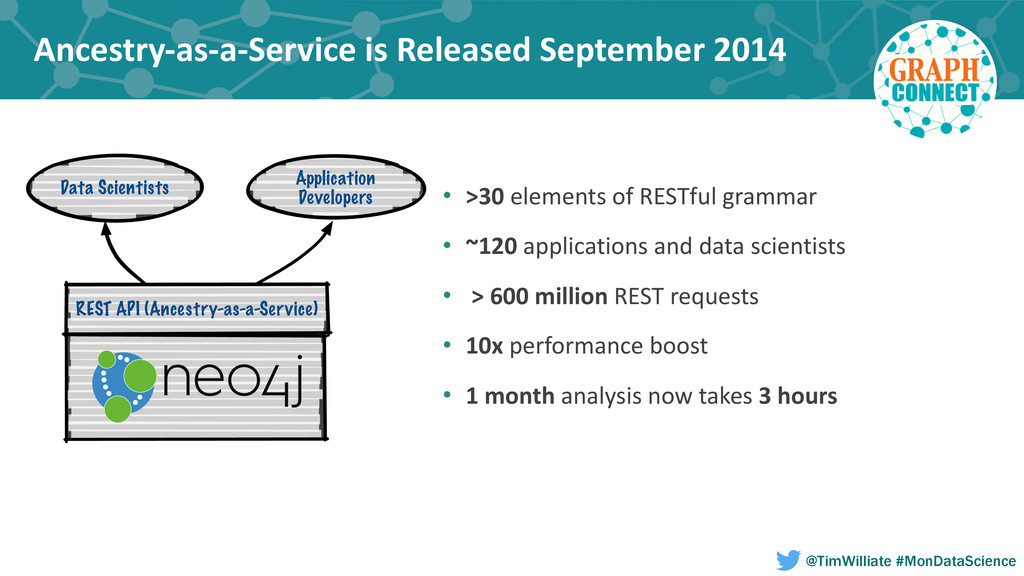
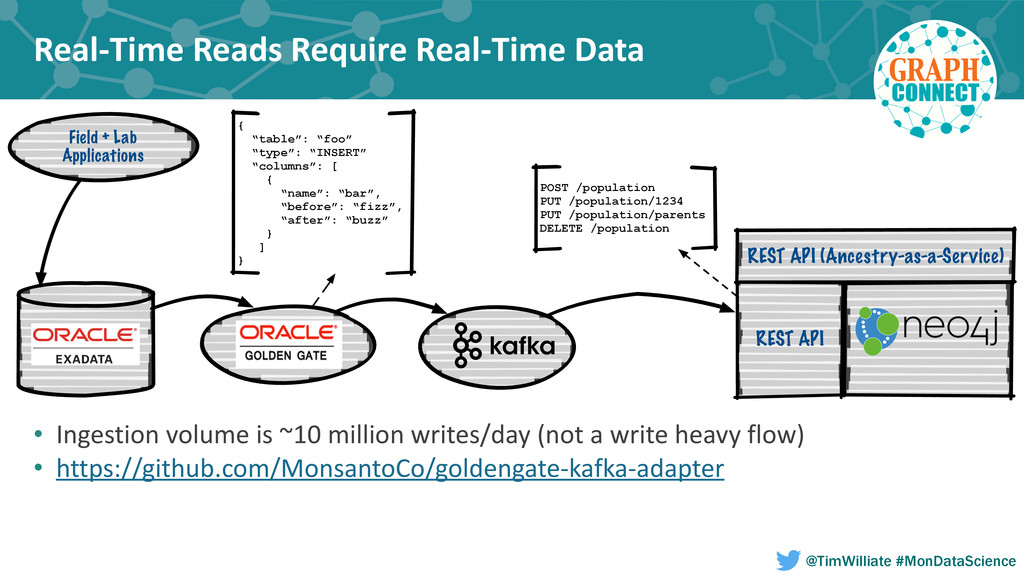
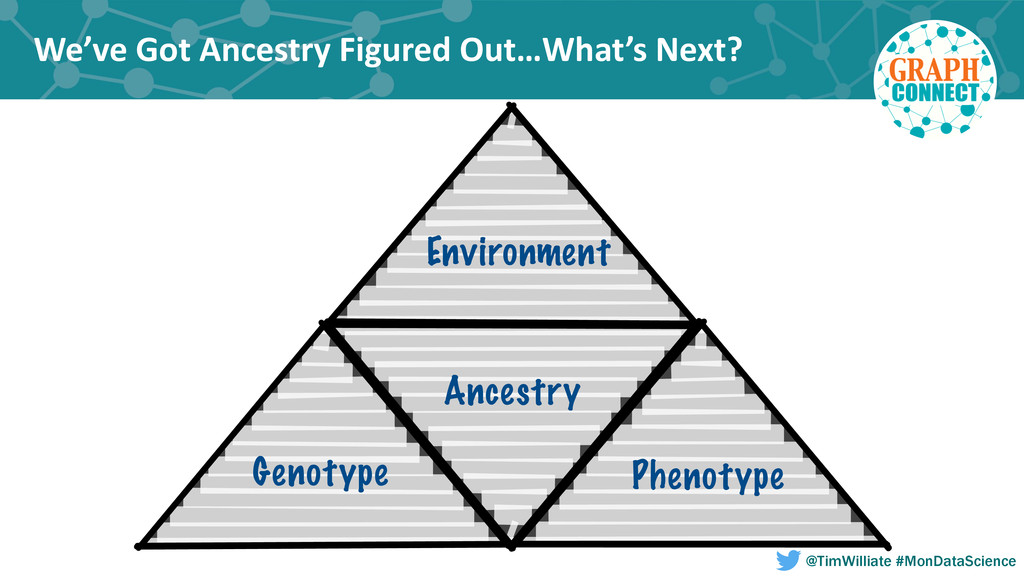
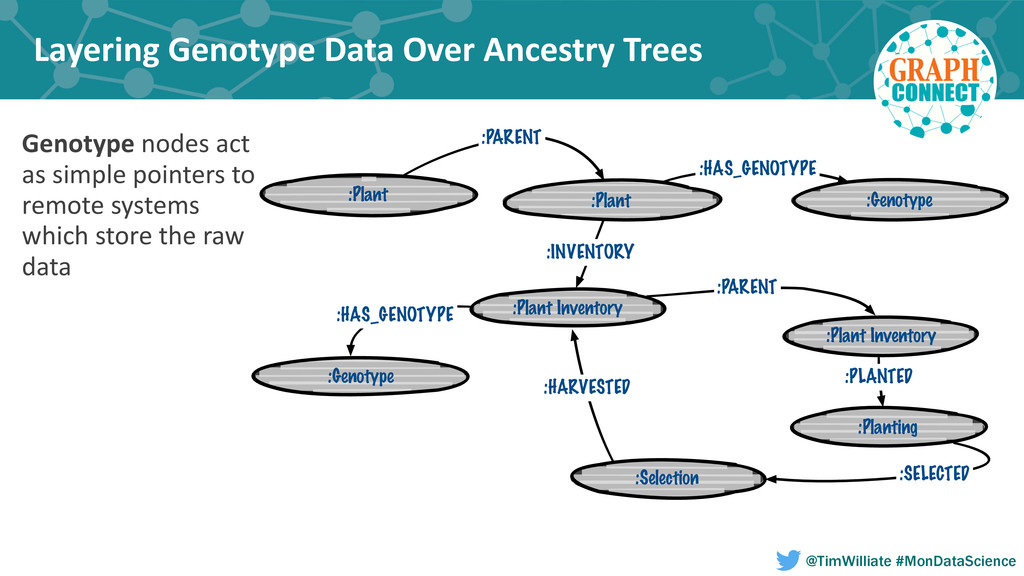
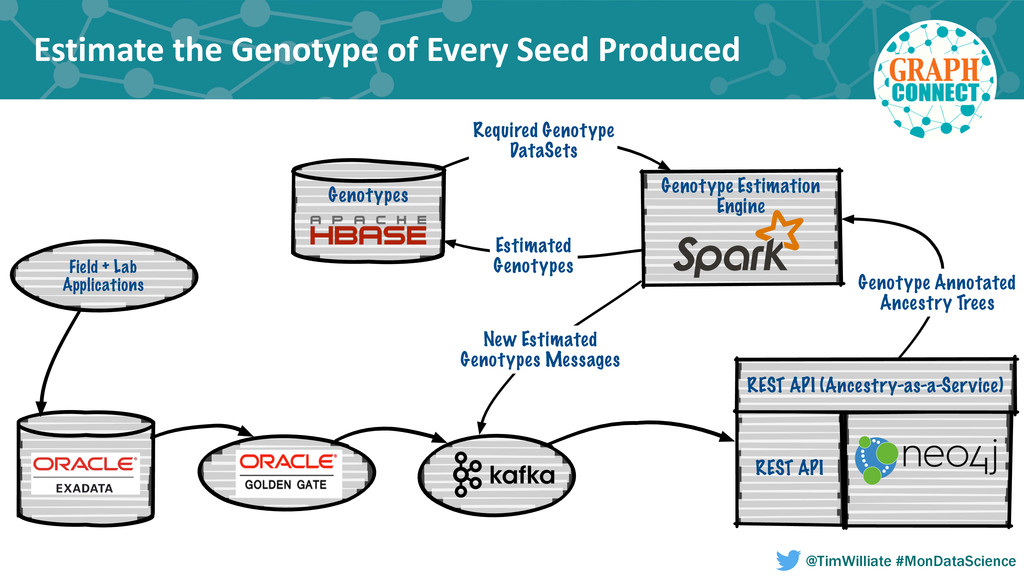
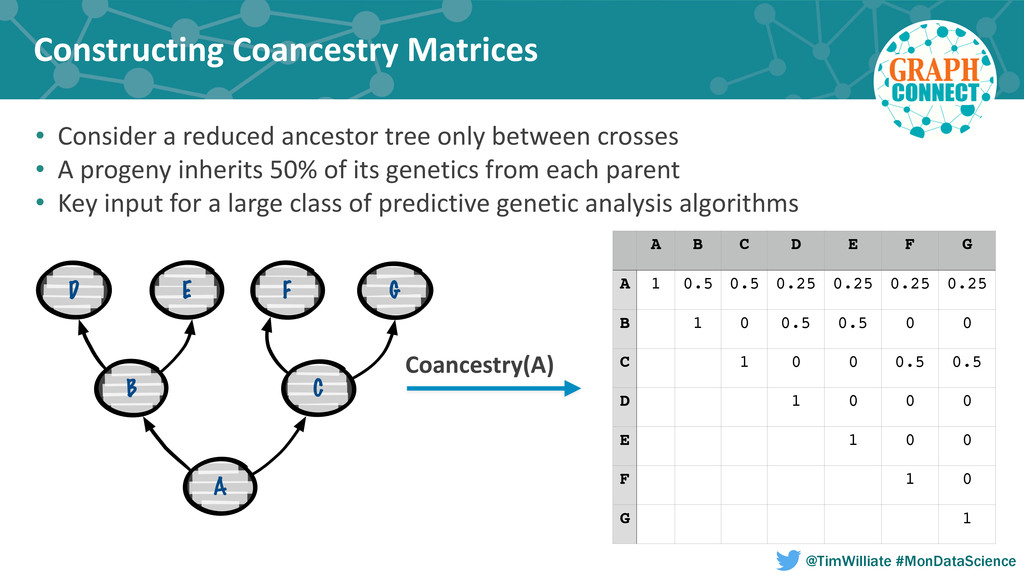
In this talk we present how we leveraged a polyglot environment, with a graph database implemented in Neo4j at the core, to enable this shift in agricultural product development. We will share examples of how the transformation of our genetic ancestry dataset into a graph has replaced months of computational effort. Our approach to polyglot persistence will be discussed via our use of a distributed commit log, Apache Kafka, to feed our graph store from sources of live transactional data. Finally, we will touch upon how we are using these technologies to annotate our genetic ancestry dataset with molecular genomics data in order to build a computational platform capable of imputing the genotype of every seed produced during new product development.

Tim Williamson

October 21, 2015
Tweet

More Decks by Tim Williamson

Other Decks in Programming

Transcript

  1. Graphs  are  Feeding  the  World

    Tim  Williamson  (@TimWilliate)

    Data  Scientist  
    Monsanto

    View Slide

  2. Our  Growing  Planet  Faces  Difficult  Challenges
    Sources: http://esa.un.org/unpd/wpp/; UN FAO Food Balance Sheet, “World Health Organization
    Global and regional food consumption patterns and trends”; The World Bank, Food and Agriculture
    Organization of the United Nations (FAO-STAT), Monsanto Internal Calculations; @TimWilliate #MonDataScience
    Rising
    Population
    Growing enough for
    a growing world
    Global Population
    1980 TODAY 2050
    4.4B
    7.1B
    9.6B+
    Limited
    Farmland
    Farmers will need to
    produce enough food
    with fewer resources
    to support our
    world population
    Acres per Person
    1961 2050
    1 <1/3
    Changing
    Economies
    and Diets
    A growing global middle
    class is choosing animal
    protein – meat, eggs,
    and dairy – as a larger
    part of their diet
    Dietary Percentage of Protein
    14%
    1965 2030
    9%
    Changing
    Climate
    Farmers are impacted
    by climate change
    in many ways:
    WATER AVAILABILITY ISSUES
    INCREASINGLY
    UNPREDICTABLE WEATHER
    INSECT RANGE EXPANSION
    WEED PRESSURE CHANGES
    CROP DISEASE INCREASES
    PLANTING ZONE SHIFTS

    View Slide

  3. Improved  Genetic  Gain  is  One  of  Several  Tools  
    Humanity  has  to  Address  These  Challenges
    Sources: http://www.ers.usda.gov/data-products/feed-grains-database/feed-grains-yearbook-tables.aspx
    • 8  commodity  crops  and  18  vegetable  crop  
    families,  sold  in  160  countries
    Average US Corn Yield 1866 - 2014
    Yield (Bushels/Acre)
    0
    45
    90
    135
    180
    Year
    1865 1890 1915 1940 1965 1990 2015
    @TimWilliate #MonDataScience
    10,000 Years

    View Slide

  4. Genetic  Gain  is  Created  Through  Breeding  Cycles
    @TimWilliate #MonDataScience
    X
    Lab Data (Genotypes)
    Field Data (Phenotypes)
    Lab Data (Genotypes)
    Field Data (Phenotypes)
    Lab Data (Genotypes)
    Lab Data (Genotypes)
    Select the Best,
    Discard the Rest
    All Progeny of Two Parents Enter
    Best One Leaves to
    Become a Future Parent
    1000’s crosses/year
    Dozens progeny/cross
    5-10 locations/progeny
    $3-5 million/year
    Screening
    Field Trials

    View Slide

  5. Every  Breeding  Cycle  Extends  a  Tree  of  Genetic  Ancestry
    @TimWilliate #MonDataScience
    C
    A B
    A B
    C

    View Slide

  6. A  single  parent

    View Slide

  7. Forcing  Genetic  Ancestry  Data  into  Rows  and  Columns
    • In  our  relational  store,  genetic  ancestry  data  was  spread  across  a  hierarchy  of  ~11  
    tables  representing  a  total  of  ~895  million  rows  
    • Every  read  became  an  unpleasant  exercise  in  CONNECT BY PRIOR
    @TimWilliate #MonDataScience
    Plant Plant:Plant Relationship
    plant id attributes… plant id parent plant id parental role

    View Slide

  8. Given  a  Starting  Population,  Return  All  Ancestors
    Response Time (s)
    0
    6
    12
    18
    24
    30
    Depth
    1 2 3 4 5 6 7 8 9 10 11 12 13 14 15
    SQL on Oracle Exadata
    @TimWilliate #MonDataScience

    View Slide

  9. Genetic  Ancestry  is  a  Naturally  Occurring  Graph
    • ~700  million  nodes  
    • ~1.2  billion  relationships  
    • ~1.7  billion  properties
    @TimWilliate #MonDataScience
    :Plant :Plant
    :PARENT
    :Plant Inventory
    :Plant Inventory
    :PARENT
    :Planting
    :PLANTED
    :Selection :SELECTED
    :HARVESTED
    :INVENTORY

    View Slide

  10. Given  a  Starting  Population,  Return  All  Ancestors
    Response Time (s)
    0
    6
    12
    18
    24
    30
    Depth
    1 2 3 4 5 6 7 8 9 10 11 12 13 14 15
    SQL on Oracle Exadata Traversal Framework on Neo4j
    ~90x  Difference
    @TimWilliate #MonDataScience

    View Slide

  11. Retrieving  Genetic  Ancestry  in  a  ‘RESTful’  Style
    4
    2
    3
    :PARENT
    {parental_role: male}
    :PARENT
    {parental_role: female}
    1
    5
    :PARENT
    {parental_role: female}
    :PARENT
    {parental_role: female}
    6
    :PARENT
    {parental_role: female}
    /population/1/ancestors
    RESTful  Resource
    {“nodes”: [
    {“id”: 1},
    {“id”: 2},
    {“id”: 3},
    {“id”: 4},
    {“id”: 5},
    {“id”: 6}
    ],
    “relationships”: [
    {“from”: 1, “to”: 2, “relation”: “PARENT”},
    {“from”: 2, “to”: 3, “relation”: “PARENT”},
    {“from”: 2, “to”: 4, “relation”: “PARENT”},
    {“from”: 3, “to”: 5, “relation”: “PARENT”}
    {“from”: 4, “to”: 6, “relation”: “PARENT”}
    ]}
    @TimWilliate #MonDataScience

    View Slide

  12. Building  a  Grammar  for  Ancestral  Milestones
    /population/1/binary-­‐cross
    RESTful  Resource
    {
    “male”: {“id”: 4},
    “female”: {“id”: 3}
    }
    4
    2
    3
    :PARENT
    {parental_role: male}
    :PARENT
    {parental_role: female}
    1
    5
    :PARENT
    {parental_role: female}
    :PARENT
    {parental_role: female}
    6
    :PARENT
    {parental_role: female}
    @TimWilliate #MonDataScience

    View Slide

  13. Pruning  Genetic  Ancestry  Trees  ‘On  the  Fly’
    /population/1/ancestors?until-­‐first=binary-­‐cross
    RESTful  Resource
    {“nodes”: [
    {“id”: 1},
    {“id”: 2},
    {“id”: 3},
    {“id”: 4}
    ],
    “relationships”: [
    {“from”: 1, “to”: 2, “relation”: “PARENT”},
    {“from”: 2, “to”: 3, “relation”: “PARENT”},
    {“from”: 2, “to”: 4, “relation”: “PARENT”}
    ]}
    4
    2
    3
    :PARENT
    {parental_role: male}
    :PARENT
    {parental_role: female}
    1
    5
    :PARENT
    {parental_role: female}
    :PARENT
    {parental_role: female}
    6
    :PARENT
    {parental_role: female}
    @TimWilliate #MonDataScience

    View Slide

  14. Ancestry-­‐as-­‐a-­‐Service  is  Released  September  2014
    REST API (Ancestry-as-a-Service)
    Data Scientists
    Application
    Developers • >30  elements  of  RESTful  grammar  
    • ~120  applications  and  data  scientists  
    •  >  600  million  REST  requests  
    • 10x  performance  boost    
    • 1  month  analysis  now  takes  3  hours
    @TimWilliate #MonDataScience

    View Slide

  15. Real-­‐Time  Reads  Require  Real-­‐Time  Data
    • Ingestion  volume  is  ~10  million  writes/day  (not  a  write  heavy  flow)  
    • https://github.com/MonsantoCo/goldengate-­‐kafka-­‐adapter
    Field + Lab
    Applications
    {
    “table”: “foo”
    “type”: “INSERT”
    “columns”: [
    {
    “name”: “bar”,
    “before”: “fizz”,
    “after”: “buzz”
    }
    ]
    }
    REST API
    REST API (Ancestry-as-a-Service)
    POST /population
    PUT /population/1234
    PUT /population/parents
    DELETE /population
    @TimWilliate #MonDataScience

    View Slide

  16. We’ve  Got  Ancestry  Figured  Out…What’s  Next?
    Genotype Phenotype
    Environment
    Ancestry
    @TimWilliate #MonDataScience

    View Slide

  17. Layering  Genotype  Data  Over  Ancestry  Trees
    Genotype  nodes  act  
    as  simple  pointers  to  
    remote  systems  
    which  store  the  raw  
    data
    @TimWilliate #MonDataScience
    :Plant :Plant
    :PARENT
    :Plant Inventory
    :Plant Inventory
    :PARENT
    :Planting
    :PLANTED
    :Selection :SELECTED
    :HARVESTED
    :INVENTORY
    :Genotype
    :HAS_GENOTYPE
    :Genotype
    :HAS_GENOTYPE

    View Slide

  18. Retrieving  Ancestry  Trees  Annotated  with  Genotypes  
    {“nodes”: [
    {“id”: 1, “genotypes”: [{“id”: 123}]},
    {“id”: 2},
    {“id”: 3},
    {“id”: 4, “genotypes”: [{“id”: 456}]},
    {“id”: 5, “genotypes”: [{“id”: 789}]}
    ],
    “relationships”: [
    {“from”: 1, “to”: 2, “relation”: “PARENT}”,
    {“from”: 2, “to”: 3, “relation”: “PARENT}”,
    {“from”: 3, “to”: 4, “relation”: “PARENT”},
    {“from”: 3, “to”: 5, “relation”: “PARENT”}
    ]}
    3
    2
    1
    :Genotype
    {marker_count: 300}
    :Genotype
    {marker_count: 60,000}
    :Genotype
    {marker_count: 60,000}
    5
    4
    /population/1/ancestors?until=genotyped-­‐ancestor&props=genotypes
    @TimWilliate #MonDataScience

    View Slide

  19. Estimate  the  Genotype  of  Every  Seed  Produced
    Genotypes
    Field + Lab
    Applications
    REST API
    REST API (Ancestry-as-a-Service)
    Genotype Estimation
    Engine
    Genotype Annotated
    Ancestry Trees
    Required Genotype
    DataSets
    Estimated
    Genotypes
    New Estimated
    Genotypes Messages
    @TimWilliate #MonDataScience

    View Slide

  20. Let’s  Revisit  the  Flow  of  a  Breeding  Cycle
    @TimWilliate #MonDataScience
    X
    Lab Data (Genotypes)
    Estimate Hi-Res Genotypes
    Lab Data (Genotypes)
    Field Data (Phenotypes)
    Lab Data (Genotypes)
    Lab Data (Genotypes)
    Select the Best,
    Discard the Rest
    All Progeny of Two Parents Enter
    Best One Leaves to
    Become a Future Parent
    1000’s crosses/year
    Dozens progeny/cross
    1 genotype/progeny
    < $1 million/year
    Genome-Wide
    Selection
    Width of Pipeline
    Increases to
    Accommodate More
    Crosses

    View Slide

  21. A  Glimpse  Inside  Our  Active  ‘Graphy’  Work
    Sources: http://biodiversitylibrary.org/page/27066167#page/125/mode/1up
    @TimWilliate #MonDataScience

    View Slide

  22. Constructing  Coancestry  Matrices
    A
    B C
    E
    D G
    F
    A B C D E F G
    A 1 0.5 0.5 0.25 0.25 0.25 0.25
    B 1 0 0.5 0.5 0 0
    C 1 0 0 0.5 0.5
    D 1 0 0 0
    E 1 0 0
    F 1 0
    G 1
    Coancestry(A)
    • Consider  a  reduced  ancestor  tree  only  between  crosses  
    • A  progeny  inherits  50%  of  its  genetics  from  each  parent  
    • Key  input  for  a  large  class  of  predictive  genetic  analysis  algorithms
    @TimWilliate #MonDataScience

    View Slide

  23. Thank  You  All
    @TimWilliate
    http://engineering.monsanto.com/
    Special  thanks  to  my  teammates  
    • Jason  Clark  
    • Marshall  Marietta  

    View Slide