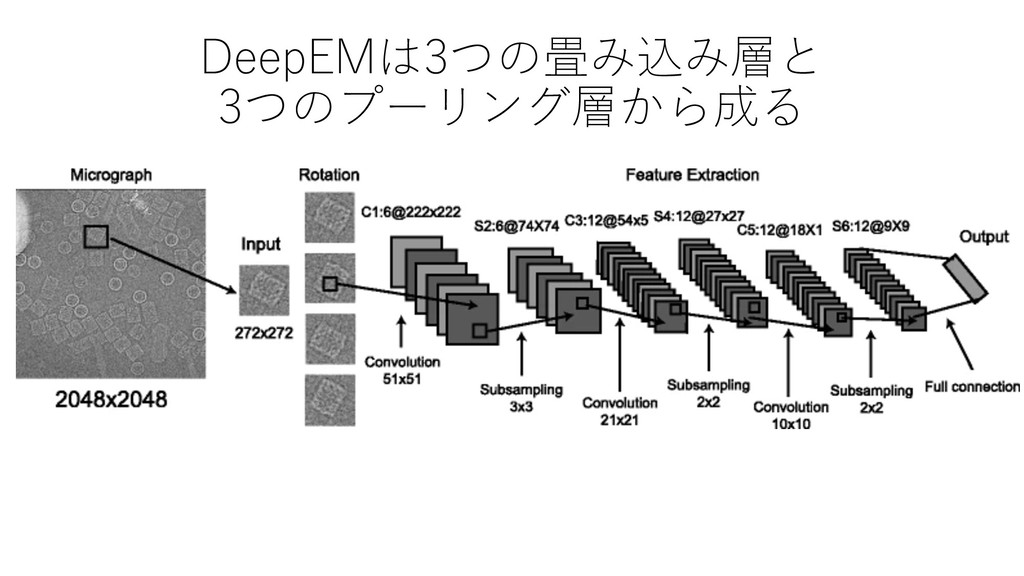
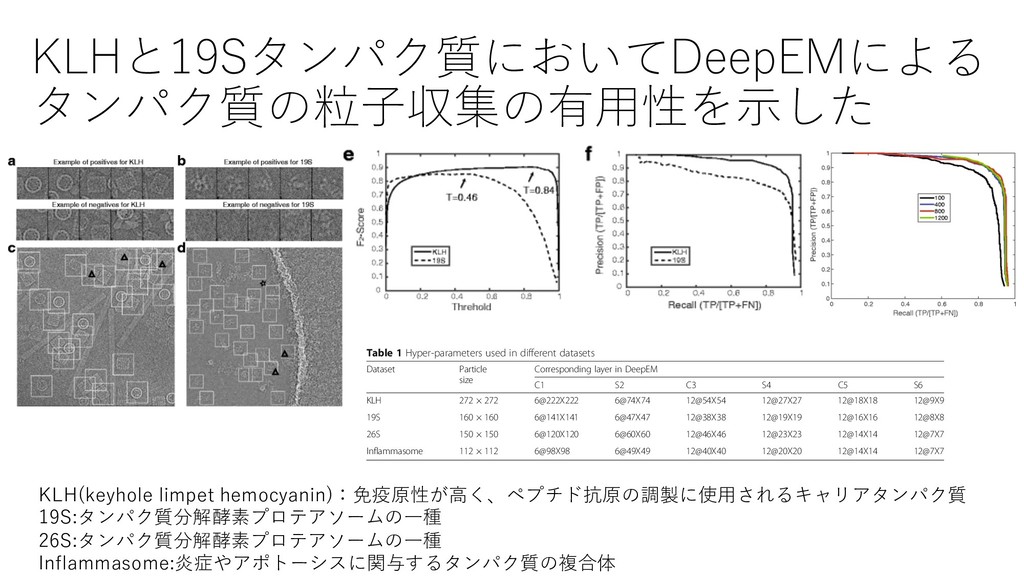
Table 1. In general, the output dimension of the convolutional layer is chosen as 70–90% of its input dimension, and the output dimension of the subsampling layer is scaled to about half its input dimension. We implemented the DeepEM algo- rithm based on the DeepLearnToolbox [31], a toolbox for the development of deep learning algorithms, in conjunc- tion with Matlab. Particle recognition and selection in the DeepEM model When a well-trained CNN is used to recognize particles, a square box of pixels is taken as the CNN input. Each input image boxed out of a testing micrograph is rotated incrementally, to generate three additional copies of the input image with rotations of 90°, 180° and 270°, relative to the original. Each copy is used as a separate input to generate a CNN output. The final expectation value of each input image is taken as the average of its four out- put values from the non-rotated and rotated copies. The boxed area is initially placed into a corner of the testing micrograph, and is raster-scanned across the whole micrograph to generate an array of CNN outputs. old score must be defined. The boxed image is identified as a candidate if the CNN output score of the particle is above the threshold score. Those particles whose CNN scores are below the threshold are rejected. We used the F-measure [32], which is a measure of the accuracy of a test that combines both precision and recall for binary classification problems, to determine the threshold score in our approach, which is defined as. Fβ ¼ 1 þ β2 À Á Ã precisionÃrecall β2Ãprecision þ recall À Á ; ð6Þ where β is a coefficient weighting the importance of precision and recall. In our method, we used the F2 score, which weights the recall higher than the precision. The F2 -score reaches its best value at 1 and its worst at 0. We defined the cutoff threshold at the highest value of the F2 -score. Secondly, candidate images were further selected based on the standard deviation of the pixel intensities. There are often carbon-rich areas or contaminants in raw micrographs where the initially detected particles may not be good choices for downstream single-particle Table 1 Hyper-parameters used in different datasets Dataset Particle size Corresponding layer in DeepEM C1 S2 C3 S4 C5 S6 KLH 272 × 272 6@222X222 6@74X74 12@54X54 12@27X27 12@18X18 12@9X9 19S 160 × 160 6@141X141 6@47X47 12@38X38 12@19X19 12@16X16 12@8X8 26S 150 × 150 6@120X120 6@60X60 12@46X46 12@23X23 12@14X14 12@7X7 Inflammasome 112 × 112 6@98X98 6@49X49 12@40X40 12@20X20 12@14X14 12@7X7 KLH(keyhole limpet hemocyanin):免疫原性が⾼く、ペプチド抗原の調製に使⽤されるキャリアタンパク質 19S:タンパク質分解酵素プロテアソームの⼀種 26S:タンパク質分解酵素プロテアソームの⼀種 Inflammasome:炎症やアポトーシスに関与するタンパク質の複合体