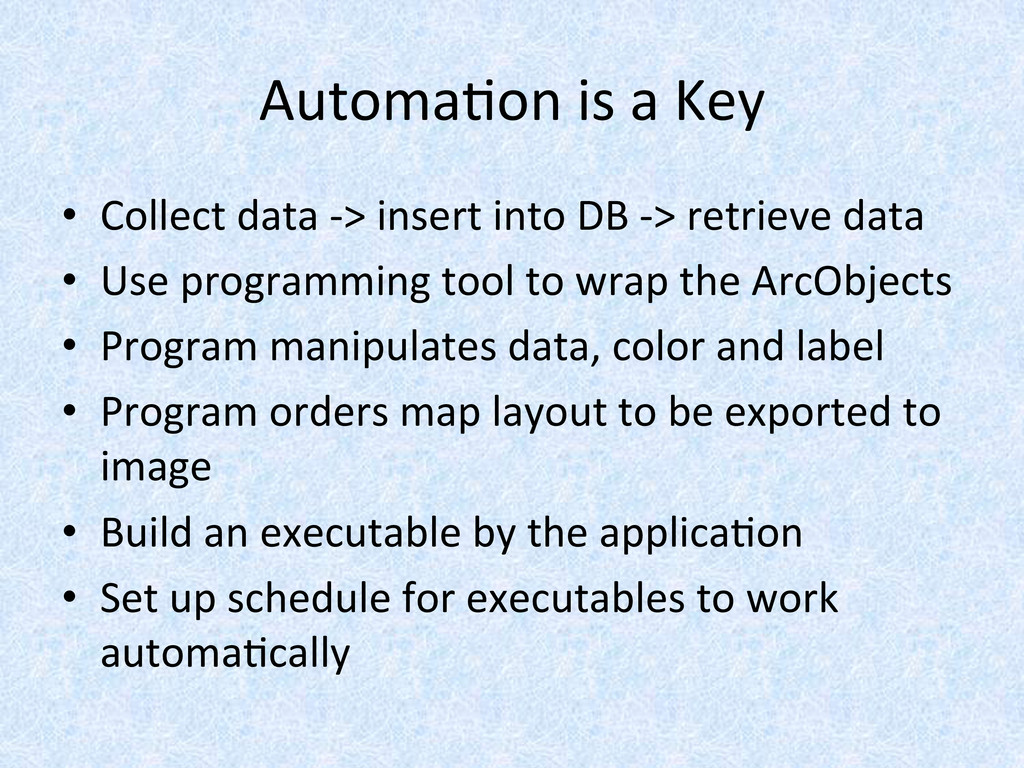
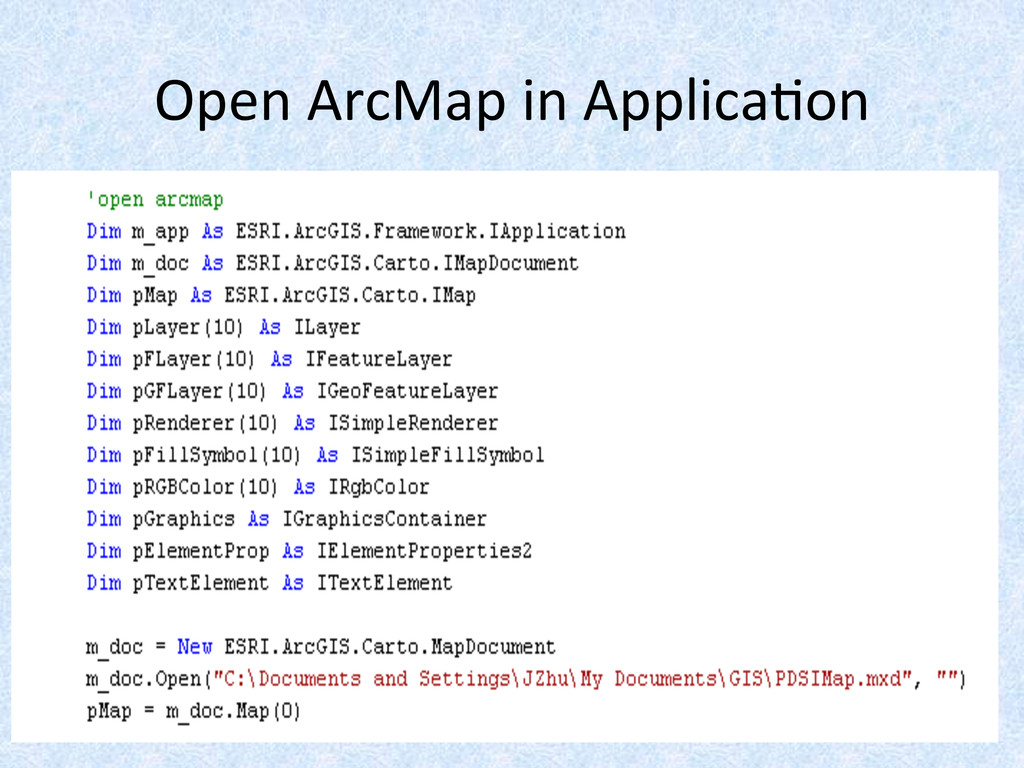
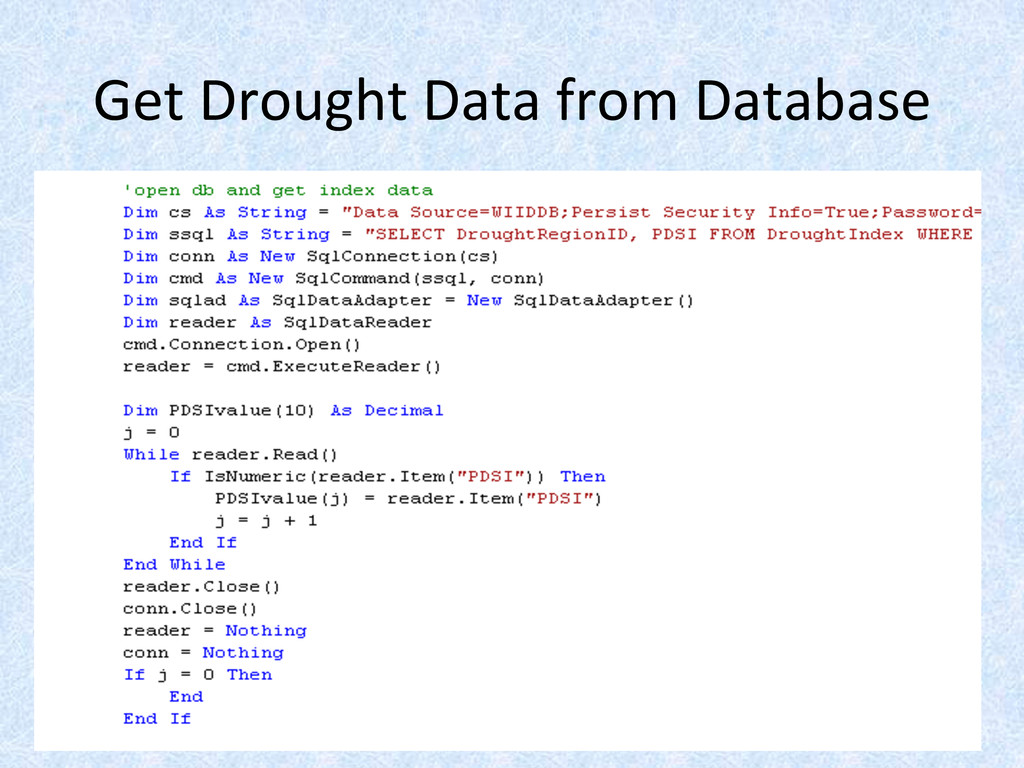
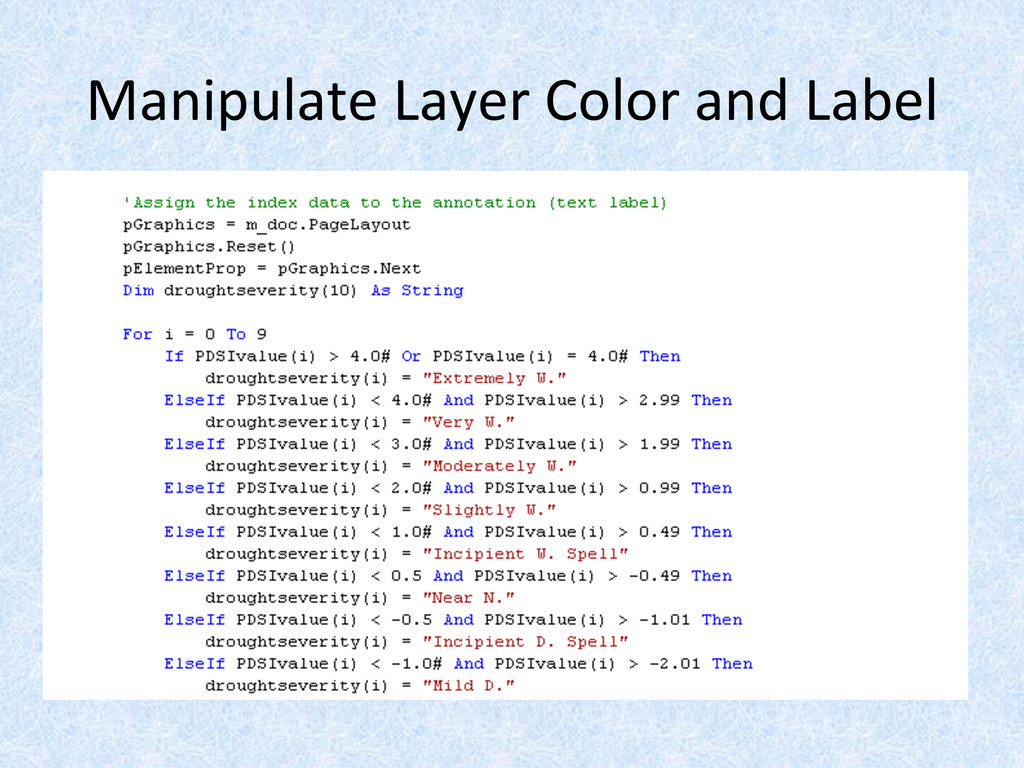
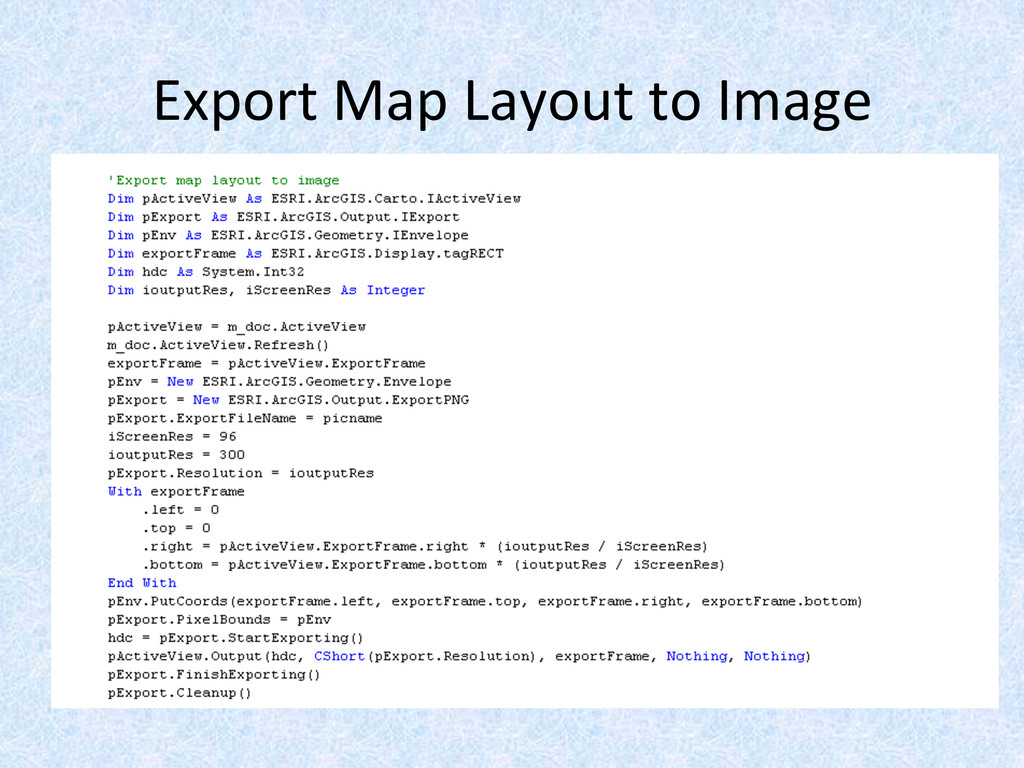
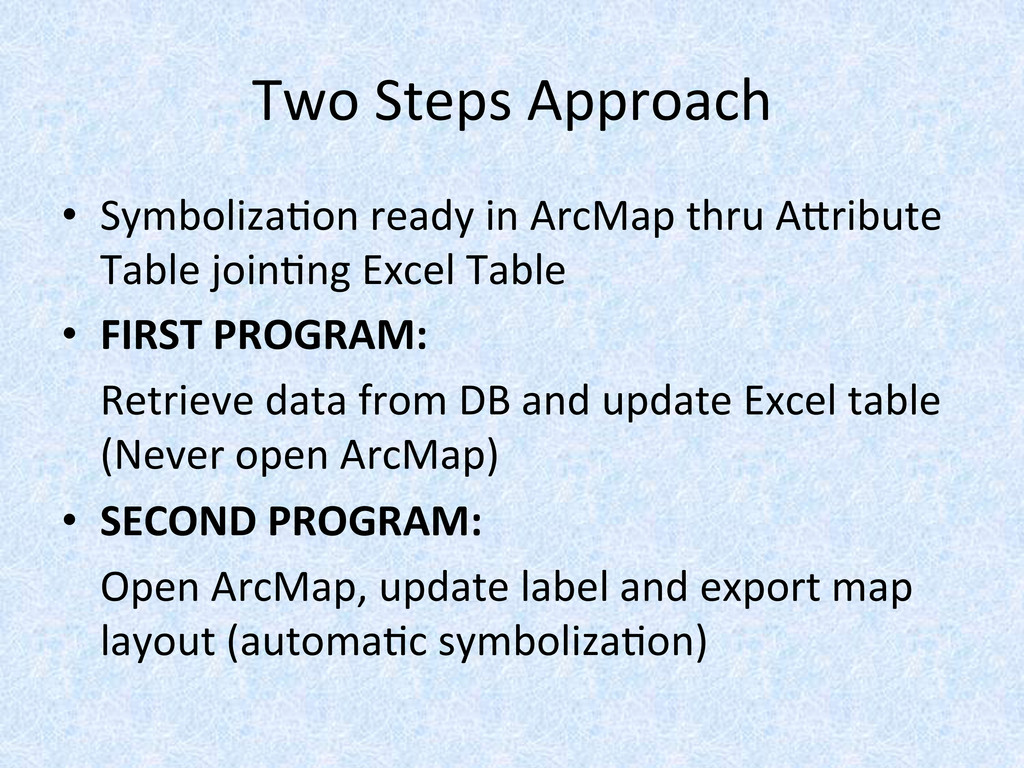
Upgrade to Pro — share decks privately, control downloads, hide ads and more …

Automation in Creating Drought Map Images by Wr...

Automation in Creating Drought Map Images by Wrapping the ArcObjects in the Application

By John Zhu

Transcript

  1. Automation in Creating Drought Map Images by Wrapping the ArcObjects

    in the Application John  Zhu,  Ph.D.   Hydrologist   Texas  Water  development  Doard  
  2. TWDB  and  Drought   •  TWDB  was  created  a@er  50’s

     drought   •  Water  Planning  by  TWDB  is  based  on  Drought-­‐ of-­‐Record  condiHon.   •  Plays  key  role  during  drought  in  term  of   financial  support   •  Plays  important  role  in  TX  Drought  Council   under  DPS   •  Collect  and  post  important  drought   informaHon  for  the  public  
  3. Important  Drought  Info   •  PDSI  -­‐  Palmer  Drought  Severity

     Index   •  SPI  –  Standardized  PrecipitaHon  Index   •  CMI  –  Crop  Moisture  Index   •  KBDI  –  Keetch-­‐Byram  Drought  Index   •  RSI  –  Reservoir  Storage  Index   •  SFI  –  Streamflow  Index   •  ……….  
  4. AutomaHon  is  a  Key   •  Collect  data  -­‐>  insert

     into  DB  -­‐>  retrieve  data   •  Use  programming  tool  to  wrap  the  ArcObjects   •  Program  manipulates  data,  color  and  label   •  Program  orders  map  layout  to  be  exported  to   image   •  Build  an  executable  by  the  applicaHon   •  Set  up  schedule  for  executables  to  work   automaHcally  
  5. Two  Steps  Approach   •  SymbolizaHon  ready  in  ArcMap  thru

     A_ribute   Table  joinHng  Excel  Table   •  FIRST  PROGRAM:    Retrieve  data  from  DB  and  update  Excel  table   (Never  open  ArcMap)   •  SECOND  PROGRAM:    Open  ArcMap,  update  label  and  export  map   layout  (automaHc  symbolizaHon)  
  6. Conclusions   •  Extremely  reliable   •  100%  efficiency  

    •  Draw  beauHful  map  without  hand   •  Management  is  saHsfied   •  Public  is  happy