Upgrade to Pro — share decks privately, control downloads, hide ads and more …

Introduction to performance analysis in openSUS...

Sponsored · Ship Features Fearlessly Turn features on and off without deploys. Used by thousands of Ruby developers. →

Introduction to performance analysis in openSUSE using perf

Avatar for Tony Jones

Tony Jones

June 25, 2016

Other Decks in Programming

Transcript

  1. Introduction to performance analysis in openSUSE® Using Perf Tony Jones

    – Senior Software Engineer SUSE Labs Portland, Oregon USA [email protected]
  2. 2 Give yourself a break • Performance analysis is not

    easy • It’s rarely black and white, more shades of grey. • Lots of subjectivity
  3. 3 Methodologies and practice are useful • Methodologies are useful,

    there are lots of them. • → be methodical • If you have to dig in, know what options exist. • Write code to test hypothesis/understand tools.
  4. 4 There are lots of tools, perf is one •

    And it’s not the first one you want to use. ‒ dmesg/syslog ‒ top ‒ iostat/vmstat ‒ Iotop ‒ pidstat ‒ strace
  5. 5 Performance Counters • Hardware resource to aid performance analysis.

    • Available on x86 since Pentium 3. • Availability via CPUID and MSR • Basic PMU functionality “standardized” with arch_perfmon_v1 thru v4 • Beyond this, additional PMUs micro-architecture specific
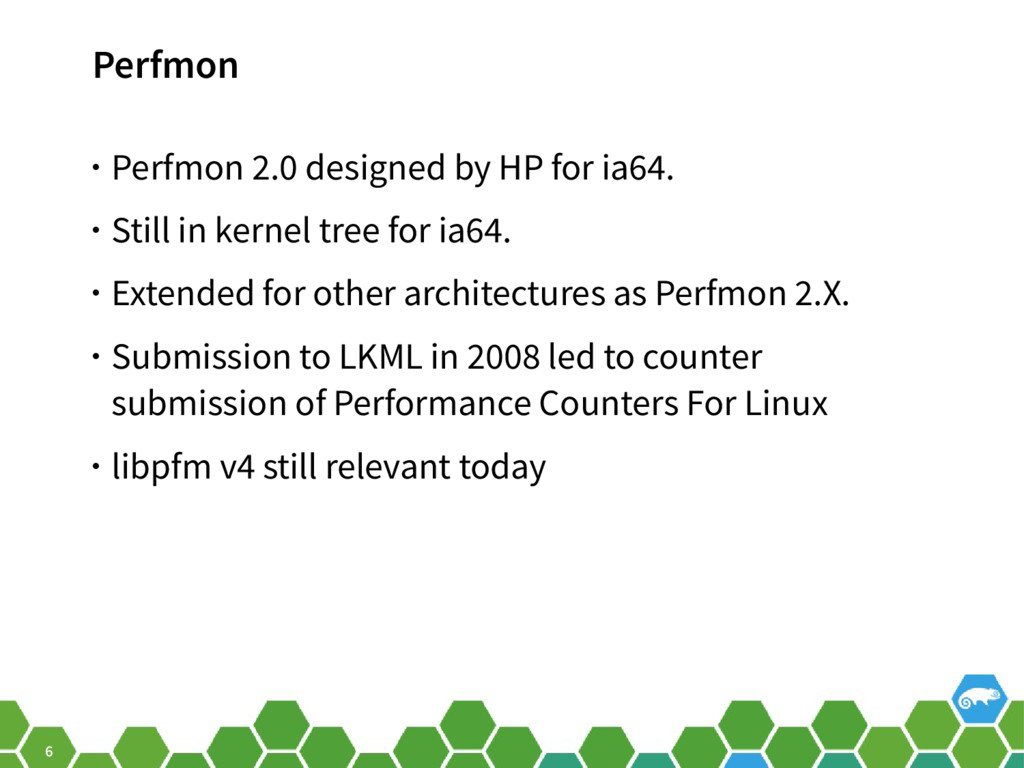
  6. 6 Perfmon • Perfmon 2.0 designed by HP for ia64.

    • Still in kernel tree for ia64. • Extended for other architectures as Perfmon 2.X. • Submission to LKML in 2008 led to counter submission of Performance Counters For Linux • libpfm v4 still relevant today
  7. 7 Perf • Introduced in 2009 in as Performance Counters

    for Linux, kernel version 2.6.31 • Now known as ‘perf events’ • A swiss-army knife but still mostly focused on cpu usage and integration with tracing.
  8. 8 Where to begin • Install perf :) • perf

    cmd ‒ top ‒ list ‒ record ‒ report ‒ annotate ‒ trace
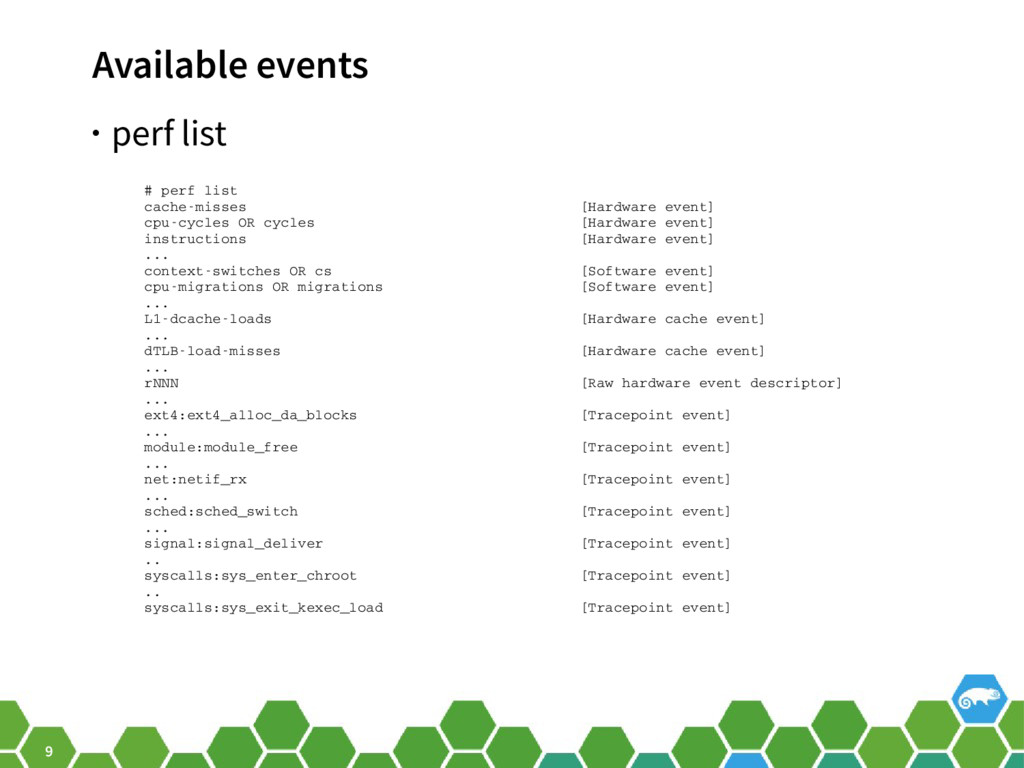
  9. 9 Available events • perf list # perf list cache­misses

    [Hardware event] cpu­cycles OR cycles [Hardware event] instructions [Hardware event] ... context­switches OR cs [Software event] cpu­migrations OR migrations [Software event] ... L1­dcache­loads [Hardware cache event] ... dTLB­load­misses [Hardware cache event] ... rNNN [Raw hardware event descriptor] ... ext4:ext4_alloc_da_blocks [Tracepoint event] ... module:module_free [Tracepoint event] ... net:netif_rx [Tracepoint event] ... sched:sched_switch [Tracepoint event] ... signal:signal_deliver [Tracepoint event] .. syscalls:sys_enter_chroot [Tracepoint event] .. syscalls:sys_exit_kexec_load [Tracepoint event]
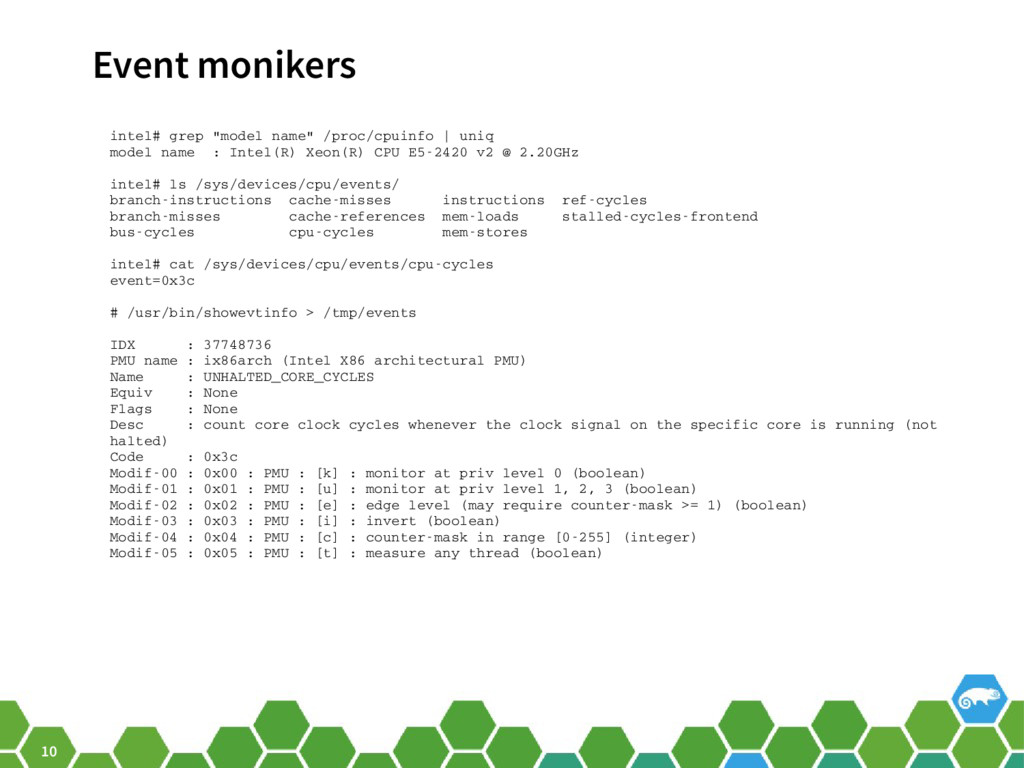
  10. 10 Event monikers intel# grep "model name" /proc/cpuinfo | uniq

    model name : Intel(R) Xeon(R) CPU E5­2420 v2 @ 2.20GHz intel# ls /sys/devices/cpu/events/ branch­instructions cache­misses instructions ref­cycles branch­misses cache­references mem­loads stalled­cycles­frontend bus­cycles cpu­cycles mem­stores intel# cat /sys/devices/cpu/events/cpu­cycles event=0x3c # /usr/bin/showevtinfo > /tmp/events IDX : 37748736 PMU name : ix86arch (Intel X86 architectural PMU) Name : UNHALTED_CORE_CYCLES Equiv : None Flags : None Desc : count core clock cycles whenever the clock signal on the specific core is running (not halted) Code : 0x3c Modif­00 : 0x00 : PMU : [k] : monitor at priv level 0 (boolean) Modif­01 : 0x01 : PMU : [u] : monitor at priv level 1, 2, 3 (boolean) Modif­02 : 0x02 : PMU : [e] : edge level (may require counter­mask >= 1) (boolean) Modif­03 : 0x03 : PMU : [i] : invert (boolean) Modif­04 : 0x04 : PMU : [c] : counter­mask in range [0­255] (integer) Modif­05 : 0x05 : PMU : [t] : measure any thread (boolean)
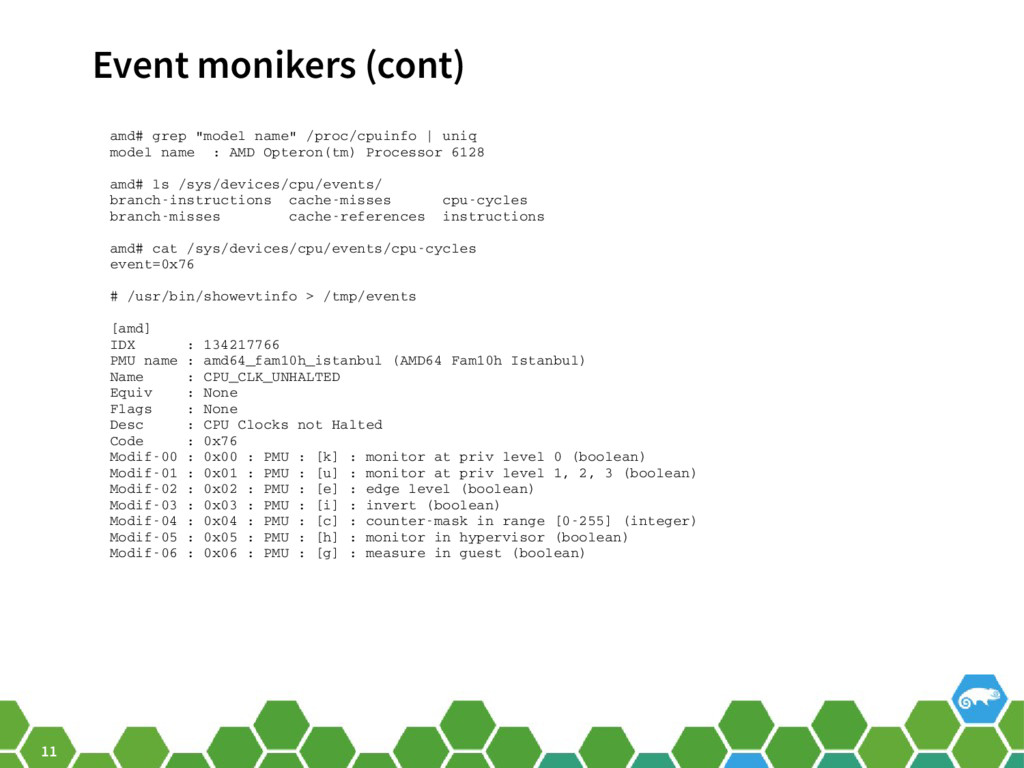
  11. 11 Event monikers (cont) amd# grep "model name" /proc/cpuinfo |

    uniq model name : AMD Opteron(tm) Processor 6128 amd# ls /sys/devices/cpu/events/ branch­instructions cache­misses cpu­cycles branch­misses cache­references instructions amd# cat /sys/devices/cpu/events/cpu­cycles event=0x76 # /usr/bin/showevtinfo > /tmp/events [amd] IDX : 134217766 PMU name : amd64_fam10h_istanbul (AMD64 Fam10h Istanbul) Name : CPU_CLK_UNHALTED Equiv : None Flags : None Desc : CPU Clocks not Halted Code : 0x76 Modif­00 : 0x00 : PMU : [k] : monitor at priv level 0 (boolean) Modif­01 : 0x01 : PMU : [u] : monitor at priv level 1, 2, 3 (boolean) Modif­02 : 0x02 : PMU : [e] : edge level (boolean) Modif­03 : 0x03 : PMU : [i] : invert (boolean) Modif­04 : 0x04 : PMU : [c] : counter­mask in range [0­255] (integer) Modif­05 : 0x05 : PMU : [h] : monitor in hypervisor (boolean) Modif­06 : 0x06 : PMU : [g] : measure in guest (boolean)
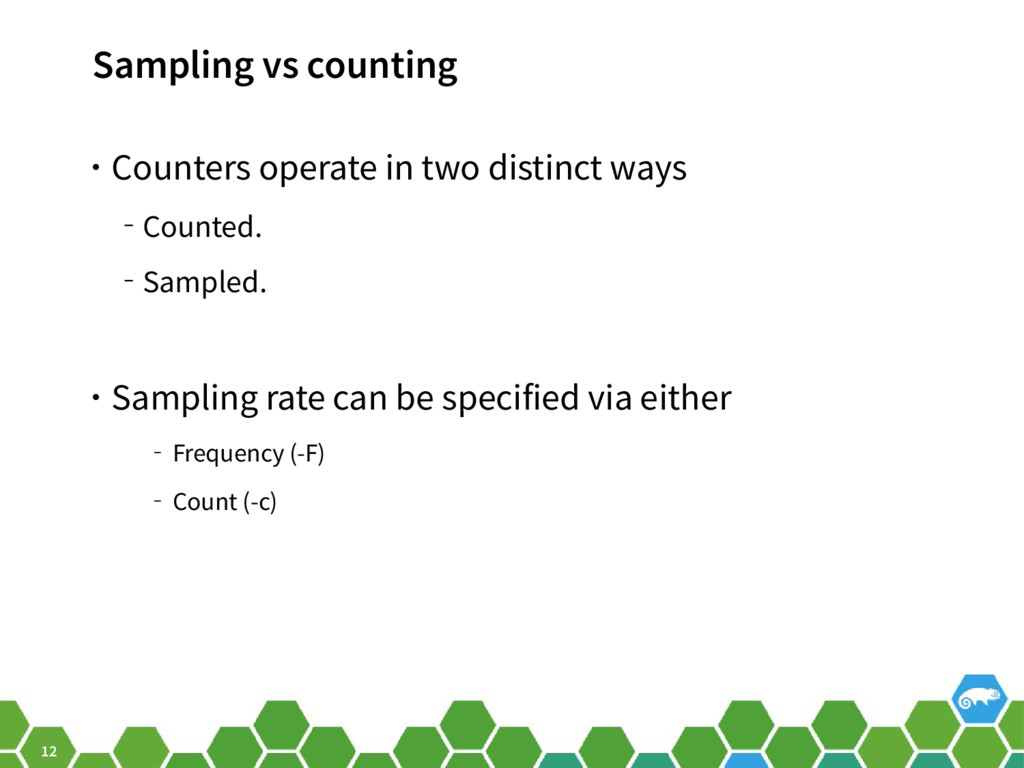
  12. 12 Sampling vs counting • Counters operate in two distinct

    ways ‒ Counted. ‒ Sampled. • Sampling rate can be specified via either ‒ Frequency (-F) ‒ Count (-c)
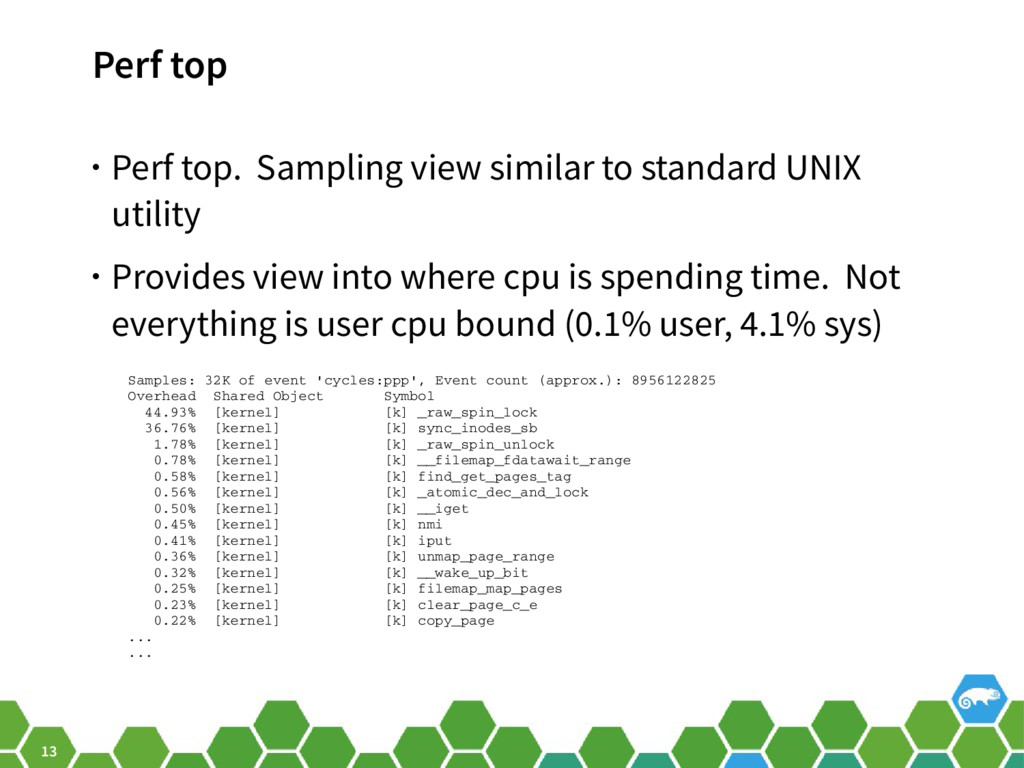
  13. 13 Perf top • Perf top. Sampling view similar to

    standard UNIX utility • Provides view into where cpu is spending time. Not everything is user cpu bound (0.1% user, 4.1% sys) Samples: 32K of event 'cycles:ppp', Event count (approx.): 8956122825 Overhead Shared Object Symbol 44.93% [kernel] [k] _raw_spin_lock 36.76% [kernel] [k] sync_inodes_sb 1.78% [kernel] [k] _raw_spin_unlock 0.78% [kernel] [k] __filemap_fdatawait_range 0.58% [kernel] [k] find_get_pages_tag 0.56% [kernel] [k] _atomic_dec_and_lock 0.50% [kernel] [k] __iget 0.45% [kernel] [k] nmi 0.41% [kernel] [k] iput 0.36% [kernel] [k] unmap_page_range 0.32% [kernel] [k] __wake_up_bit 0.25% [kernel] [k] filemap_map_pages 0.23% [kernel] [k] clear_page_c_e 0.22% [kernel] [k] copy_page ... ...
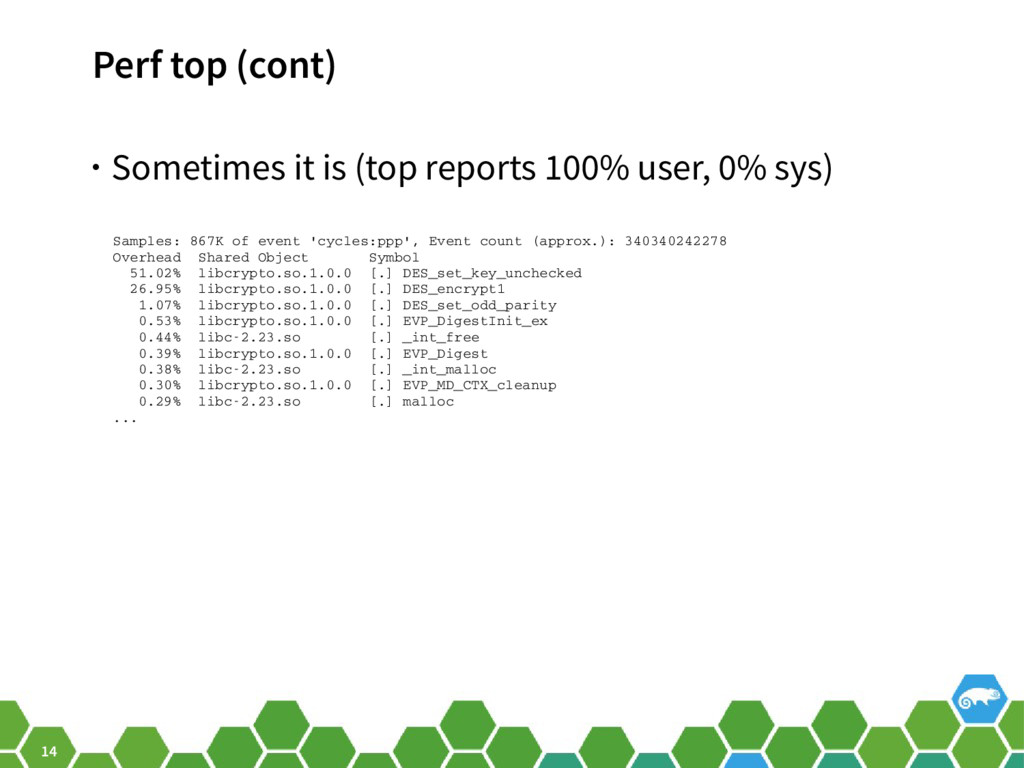
  14. 14 Perf top (cont) • Sometimes it is (top reports

    100% user, 0% sys) Samples: 867K of event 'cycles:ppp', Event count (approx.): 340340242278 Overhead Shared Object Symbol 51.02% libcrypto.so.1.0.0 [.] DES_set_key_unchecked 26.95% libcrypto.so.1.0.0 [.] DES_encrypt1 1.07% libcrypto.so.1.0.0 [.] DES_set_odd_parity 0.53% libcrypto.so.1.0.0 [.] EVP_DigestInit_ex 0.44% libc­2.23.so [.] _int_free 0.39% libcrypto.so.1.0.0 [.] EVP_Digest 0.38% libc­2.23.so [.] _int_malloc 0.30% libcrypto.so.1.0.0 [.] EVP_MD_CTX_cleanup 0.29% libc­2.23.so [.] malloc ...
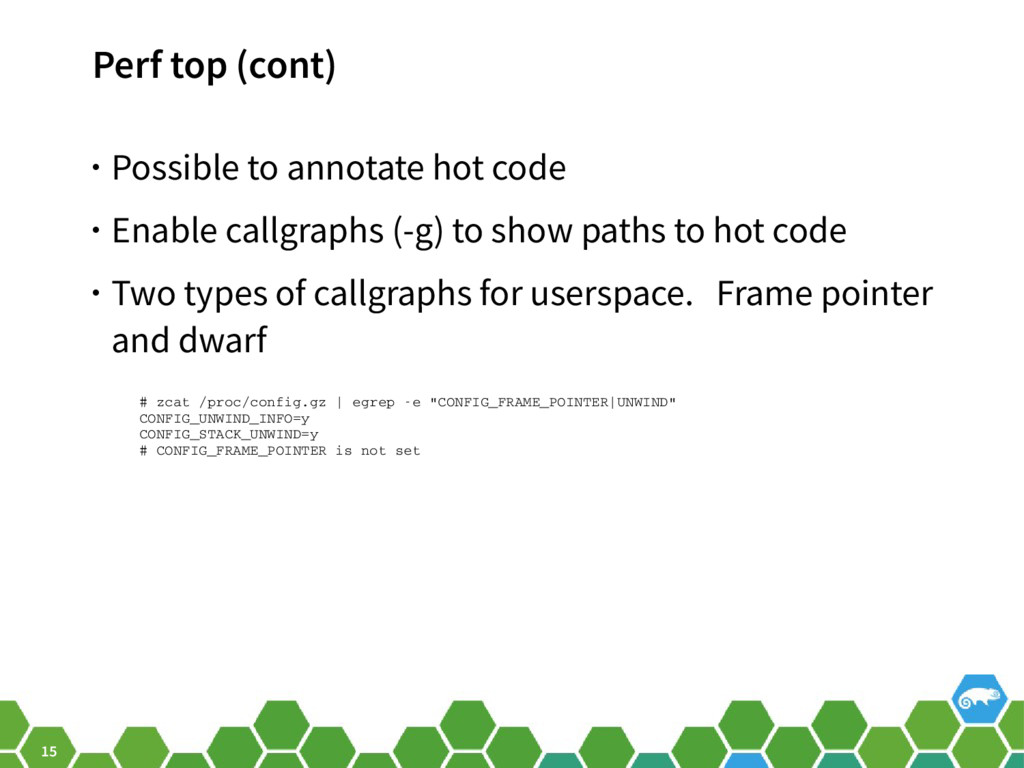
  15. 15 Perf top (cont) • Possible to annotate hot code

    • Enable callgraphs (-g) to show paths to hot code • Two types of callgraphs for userspace. Frame pointer and dwarf # zcat /proc/config.gz | egrep ­e "CONFIG_FRAME_POINTER|UNWIND" CONFIG_UNWIND_INFO=y CONFIG_STACK_UNWIND=y # CONFIG_FRAME_POINTER is not set
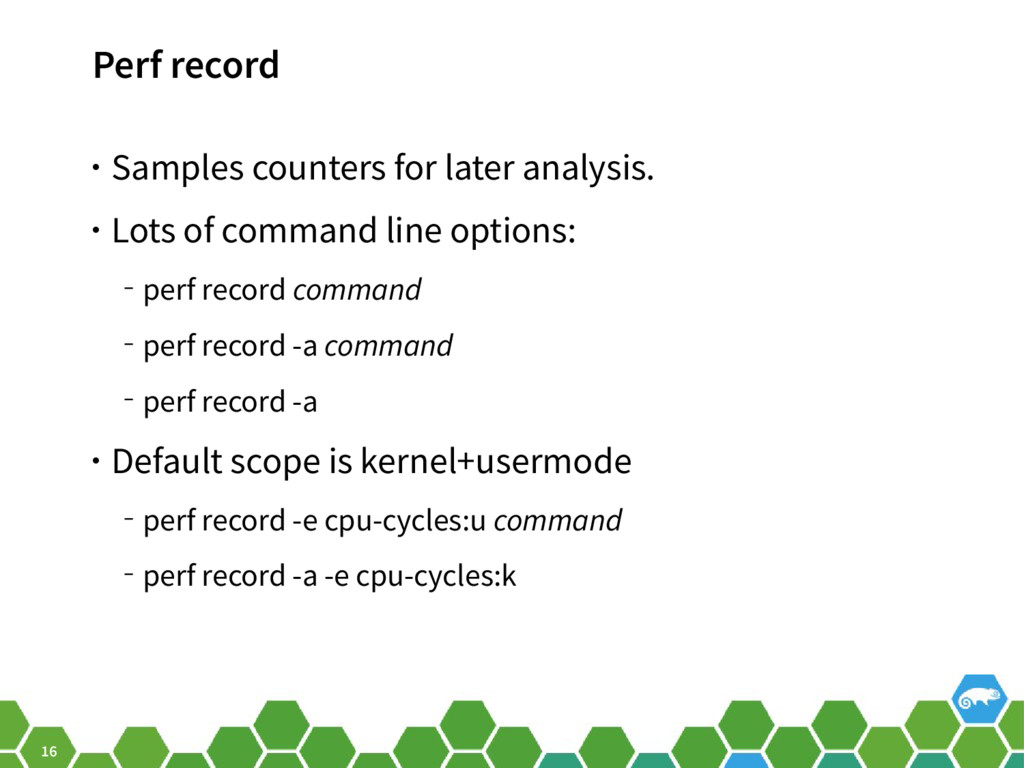
  16. 16 Perf record • Samples counters for later analysis. •

    Lots of command line options: ‒ perf record command ‒ perf record -a command ‒ perf record -a • Default scope is kernel+usermode ‒ perf record -e cpu-cycles:u command ‒ perf record -a -e cpu-cycles:k
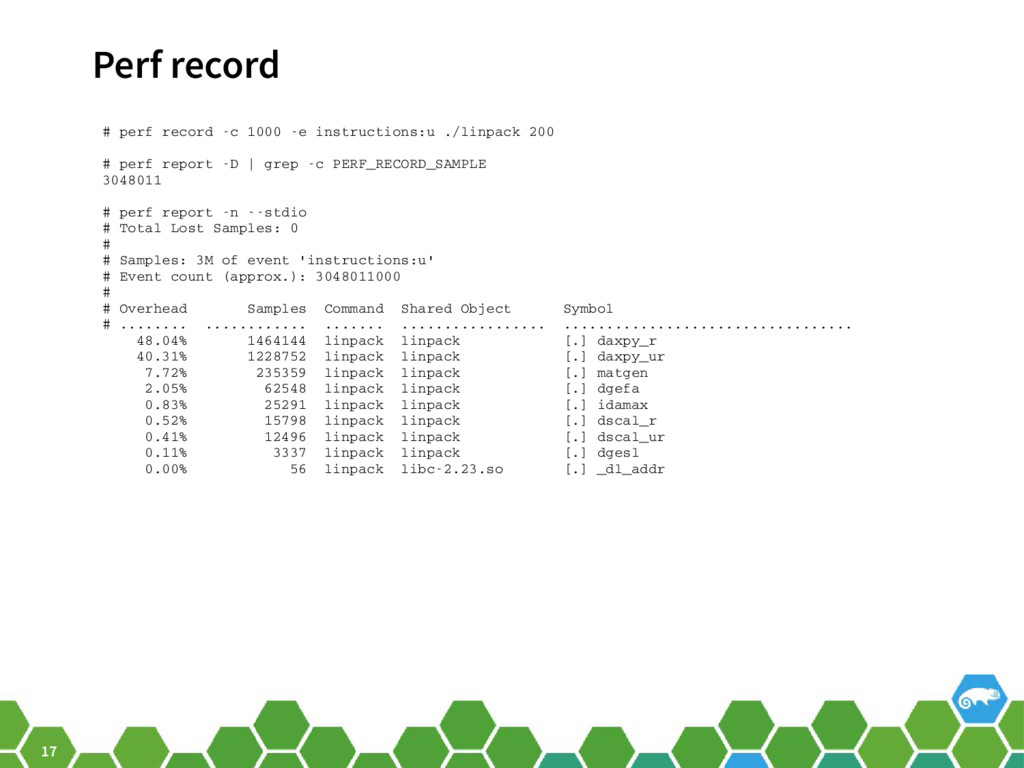
  17. 17 Perf record # perf record ­c 1000 ­e instructions:u

    ./linpack 200 # perf report ­D | grep ­c PERF_RECORD_SAMPLE 3048011 # perf report ­n ­­stdio # Total Lost Samples: 0 # # Samples: 3M of event 'instructions:u' # Event count (approx.): 3048011000 # # Overhead Samples Command Shared Object Symbol # ........ ............ ....... ................. .................................. 48.04% 1464144 linpack linpack [.] daxpy_r 40.31% 1228752 linpack linpack [.] daxpy_ur 7.72% 235359 linpack linpack [.] matgen 2.05% 62548 linpack linpack [.] dgefa 0.83% 25291 linpack linpack [.] idamax 0.52% 15798 linpack linpack [.] dscal_r 0.41% 12496 linpack linpack [.] dscal_ur 0.11% 3337 linpack linpack [.] dgesl 0.00% 56 linpack libc­2.23.so [.] _dl_addr
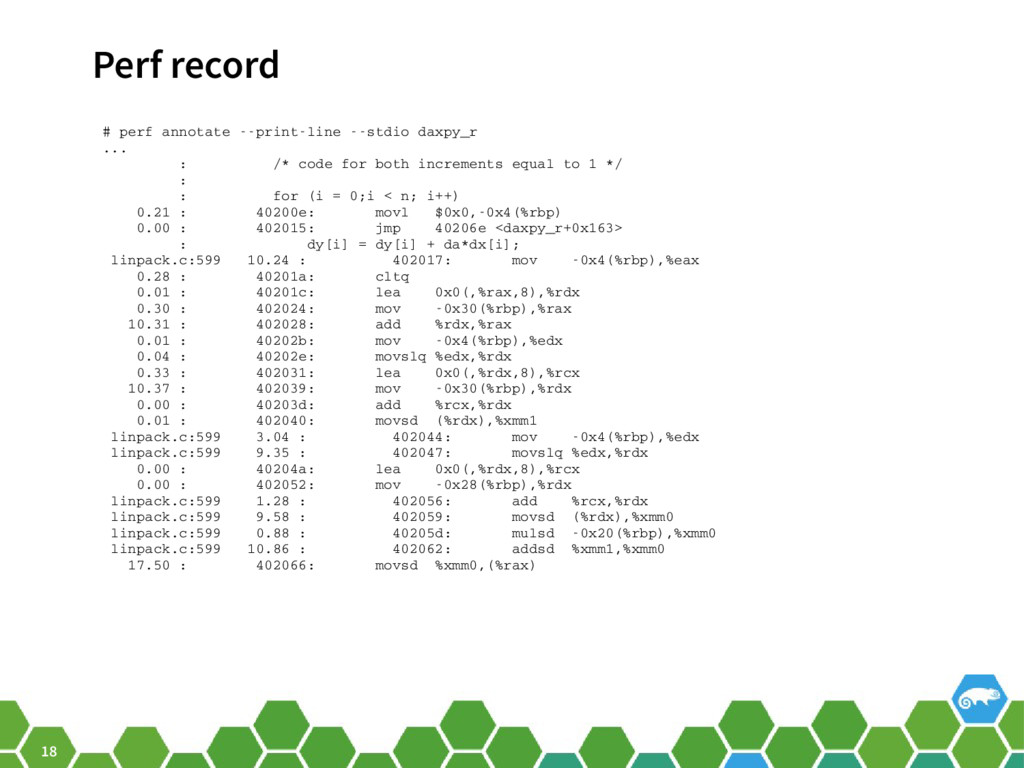
  18. 18 Perf record # perf annotate ­­print­line ­­stdio daxpy_r ...

    : /* code for both increments equal to 1 */ : : for (i = 0;i < n; i++) 0.21 : 40200e: movl $0x0,­0x4(%rbp) 0.00 : 402015: jmp 40206e <daxpy_r+0x163> : dy[i] = dy[i] + da*dx[i]; linpack.c:599 10.24 : 402017: mov ­0x4(%rbp),%eax 0.28 : 40201a: cltq 0.01 : 40201c: lea 0x0(,%rax,8),%rdx 0.30 : 402024: mov ­0x30(%rbp),%rax 10.31 : 402028: add %rdx,%rax 0.01 : 40202b: mov ­0x4(%rbp),%edx 0.04 : 40202e: movslq %edx,%rdx 0.33 : 402031: lea 0x0(,%rdx,8),%rcx 10.37 : 402039: mov ­0x30(%rbp),%rdx 0.00 : 40203d: add %rcx,%rdx 0.01 : 402040: movsd (%rdx),%xmm1 linpack.c:599 3.04 : 402044: mov ­0x4(%rbp),%edx linpack.c:599 9.35 : 402047: movslq %edx,%rdx 0.00 : 40204a: lea 0x0(,%rdx,8),%rcx 0.00 : 402052: mov ­0x28(%rbp),%rdx linpack.c:599 1.28 : 402056: add %rcx,%rdx linpack.c:599 9.58 : 402059: movsd (%rdx),%xmm0 linpack.c:599 0.88 : 40205d: mulsd ­0x20(%rbp),%xmm0 linpack.c:599 10.86 : 402062: addsd %xmm1,%xmm0 17.50 : 402066: movsd %xmm0,(%rax)
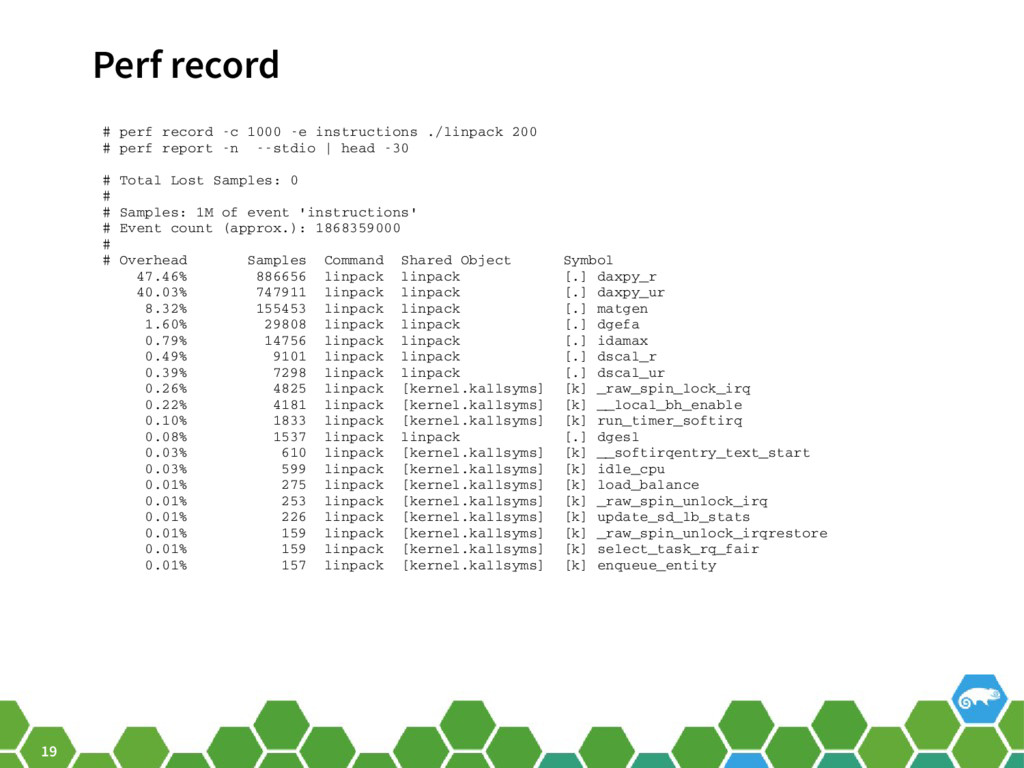
  19. 19 Perf record # perf record ­c 1000 ­e instructions

    ./linpack 200 # perf report ­n ­­stdio | head ­30 # Total Lost Samples: 0 # # Samples: 1M of event 'instructions' # Event count (approx.): 1868359000 # # Overhead Samples Command Shared Object Symbol 47.46% 886656 linpack linpack [.] daxpy_r 40.03% 747911 linpack linpack [.] daxpy_ur 8.32% 155453 linpack linpack [.] matgen 1.60% 29808 linpack linpack [.] dgefa 0.79% 14756 linpack linpack [.] idamax 0.49% 9101 linpack linpack [.] dscal_r 0.39% 7298 linpack linpack [.] dscal_ur 0.26% 4825 linpack [kernel.kallsyms] [k] _raw_spin_lock_irq 0.22% 4181 linpack [kernel.kallsyms] [k] __local_bh_enable 0.10% 1833 linpack [kernel.kallsyms] [k] run_timer_softirq 0.08% 1537 linpack linpack [.] dgesl 0.03% 610 linpack [kernel.kallsyms] [k] __softirqentry_text_start 0.03% 599 linpack [kernel.kallsyms] [k] idle_cpu 0.01% 275 linpack [kernel.kallsyms] [k] load_balance 0.01% 253 linpack [kernel.kallsyms] [k] _raw_spin_unlock_irq 0.01% 226 linpack [kernel.kallsyms] [k] update_sd_lb_stats 0.01% 159 linpack [kernel.kallsyms] [k] _raw_spin_unlock_irqrestore 0.01% 159 linpack [kernel.kallsyms] [k] select_task_rq_fair 0.01% 157 linpack [kernel.kallsyms] [k] enqueue_entity
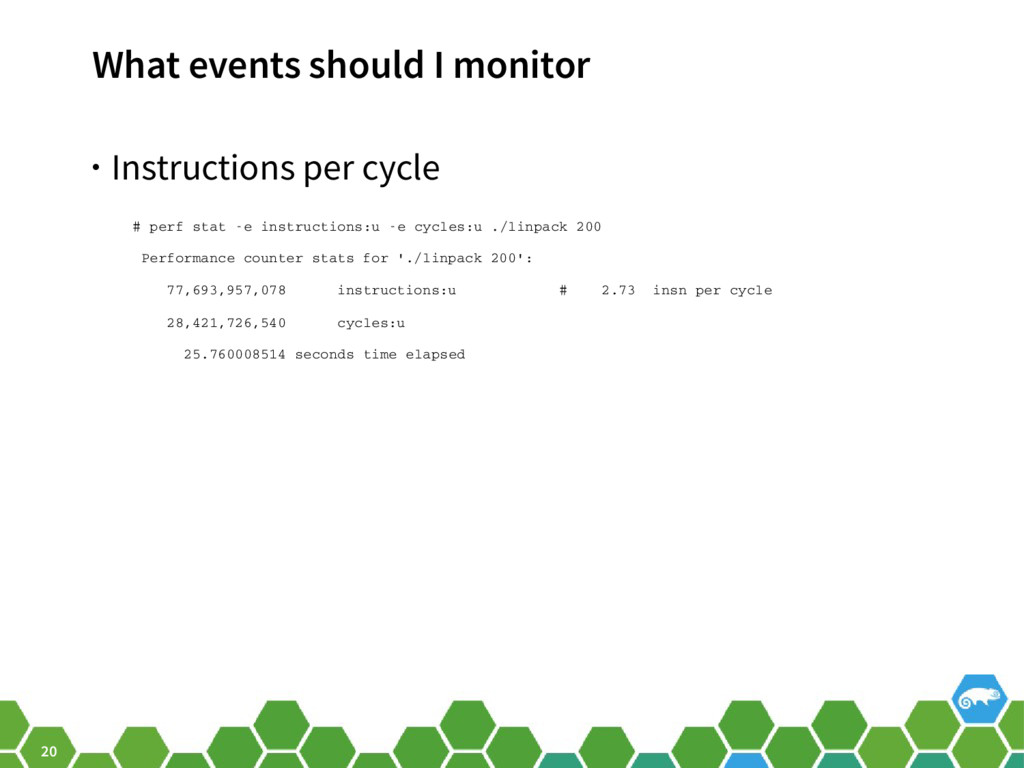
  20. 20 What events should I monitor • Instructions per cycle

    # perf stat ­e instructions:u ­e cycles:u ./linpack 200 Performance counter stats for './linpack 200': 77,693,957,078 instructions:u # 2.73 insn per cycle 28,421,726,540 cycles:u 25.760008514 seconds time elapsed
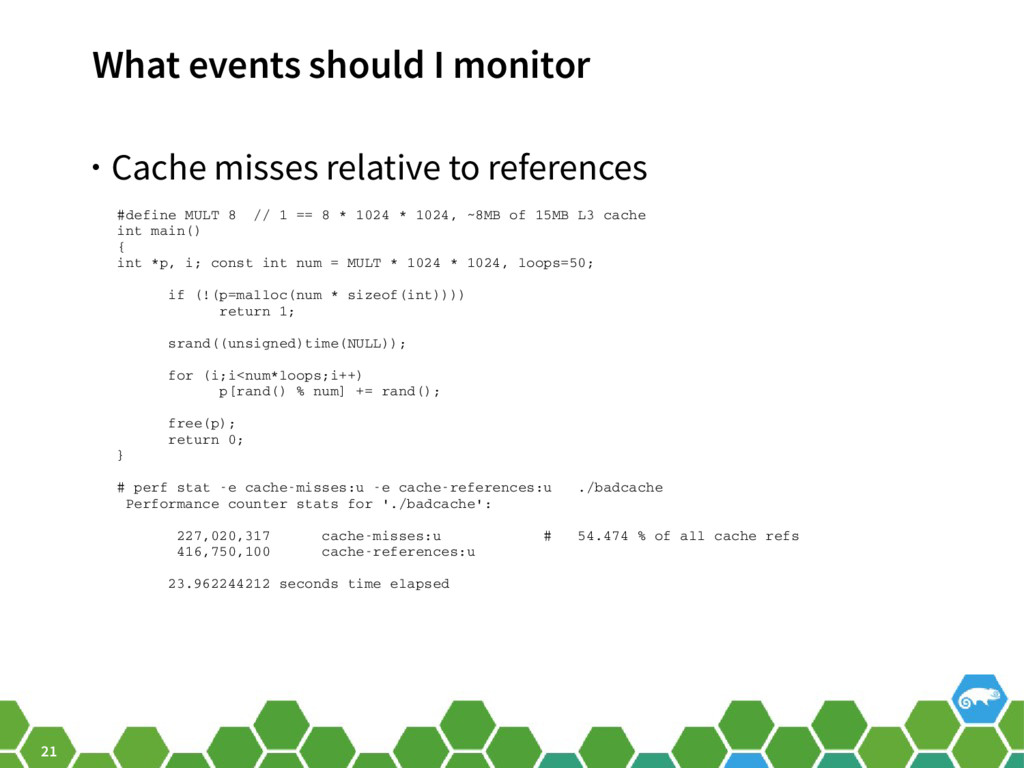
  21. 21 What events should I monitor • Cache misses relative

    to references #define MULT 8 // 1 == 8 * 1024 * 1024, ~8MB of 15MB L3 cache int main() { int *p, i; const int num = MULT * 1024 * 1024, loops=50; if (!(p=malloc(num * sizeof(int)))) return 1; srand((unsigned)time(NULL)); for (i;i<num*loops;i++) p[rand() % num] += rand(); free(p); return 0; } # perf stat ­e cache­misses:u ­e cache­references:u ./badcache Performance counter stats for './badcache': 227,020,317 cache­misses:u # 54.474 % of all cache refs 416,750,100 cache­references:u 23.962244212 seconds time elapsed
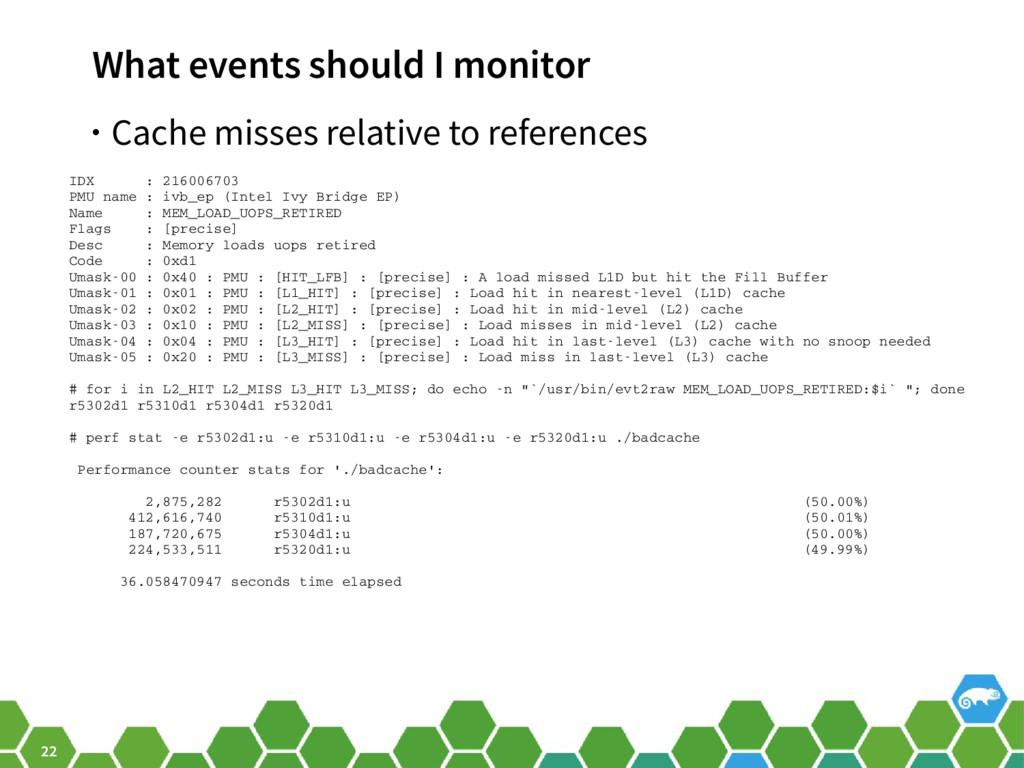
  22. 22 What events should I monitor • Cache misses relative

    to references IDX : 216006703 PMU name : ivb_ep (Intel Ivy Bridge EP) Name : MEM_LOAD_UOPS_RETIRED Flags : [precise] Desc : Memory loads uops retired Code : 0xd1 Umask­00 : 0x40 : PMU : [HIT_LFB] : [precise] : A load missed L1D but hit the Fill Buffer Umask­01 : 0x01 : PMU : [L1_HIT] : [precise] : Load hit in nearest­level (L1D) cache Umask­02 : 0x02 : PMU : [L2_HIT] : [precise] : Load hit in mid­level (L2) cache Umask­03 : 0x10 : PMU : [L2_MISS] : [precise] : Load misses in mid­level (L2) cache Umask­04 : 0x04 : PMU : [L3_HIT] : [precise] : Load hit in last­level (L3) cache with no snoop needed Umask­05 : 0x20 : PMU : [L3_MISS] : [precise] : Load miss in last­level (L3) cache # for i in L2_HIT L2_MISS L3_HIT L3_MISS; do echo ­n "`/usr/bin/evt2raw MEM_LOAD_UOPS_RETIRED:$i` "; done r5302d1 r5310d1 r5304d1 r5320d1 # perf stat ­e r5302d1:u ­e r5310d1:u ­e r5304d1:u ­e r5320d1:u ./badcache Performance counter stats for './badcache': 2,875,282 r5302d1:u (50.00%) 412,616,740 r5310d1:u (50.01%) 187,720,675 r5304d1:u (50.00%) 224,533,511 r5320d1:u (49.99%) 36.058470947 seconds time elapsed
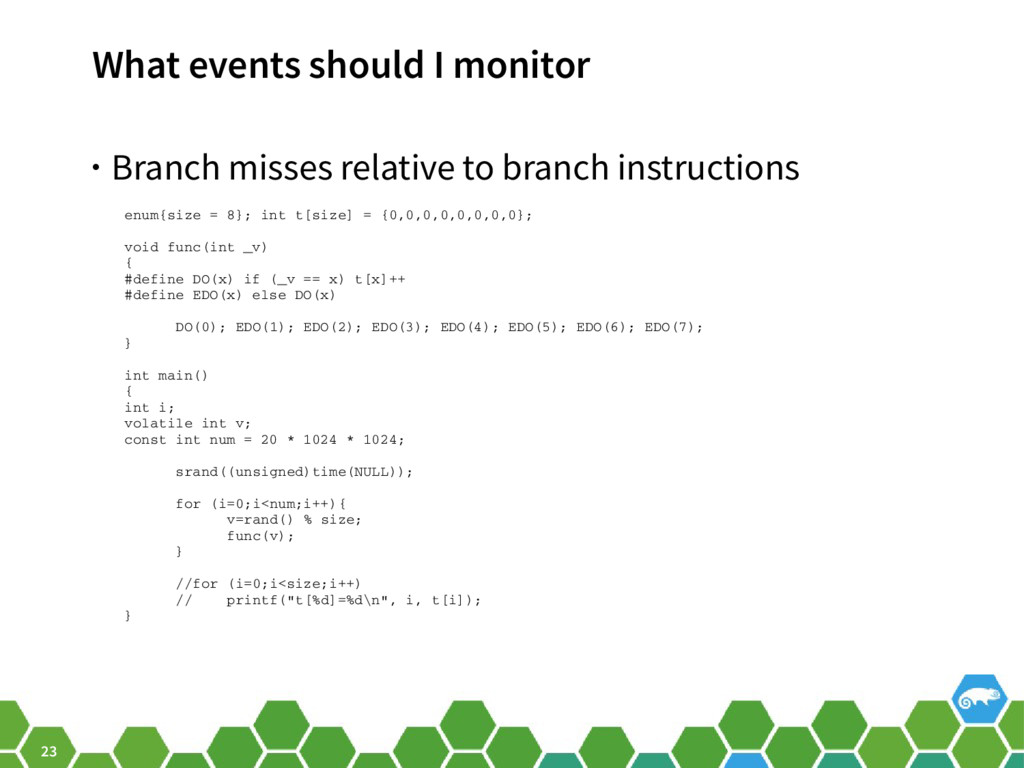
  23. 23 What events should I monitor • Branch misses relative

    to branch instructions enum{size = 8}; int t[size] = {0,0,0,0,0,0,0,0}; void func(int _v) { #define DO(x) if (_v == x) t[x]++ #define EDO(x) else DO(x) DO(0); EDO(1); EDO(2); EDO(3); EDO(4); EDO(5); EDO(6); EDO(7); } int main() { int i; volatile int v; const int num = 20 * 1024 * 1024; srand((unsigned)time(NULL)); for (i=0;i<num;i++){ v=rand() % size; func(v); } //for (i=0;i<size;i++) // printf("t[%d]=%d\n", i, t[i]); }
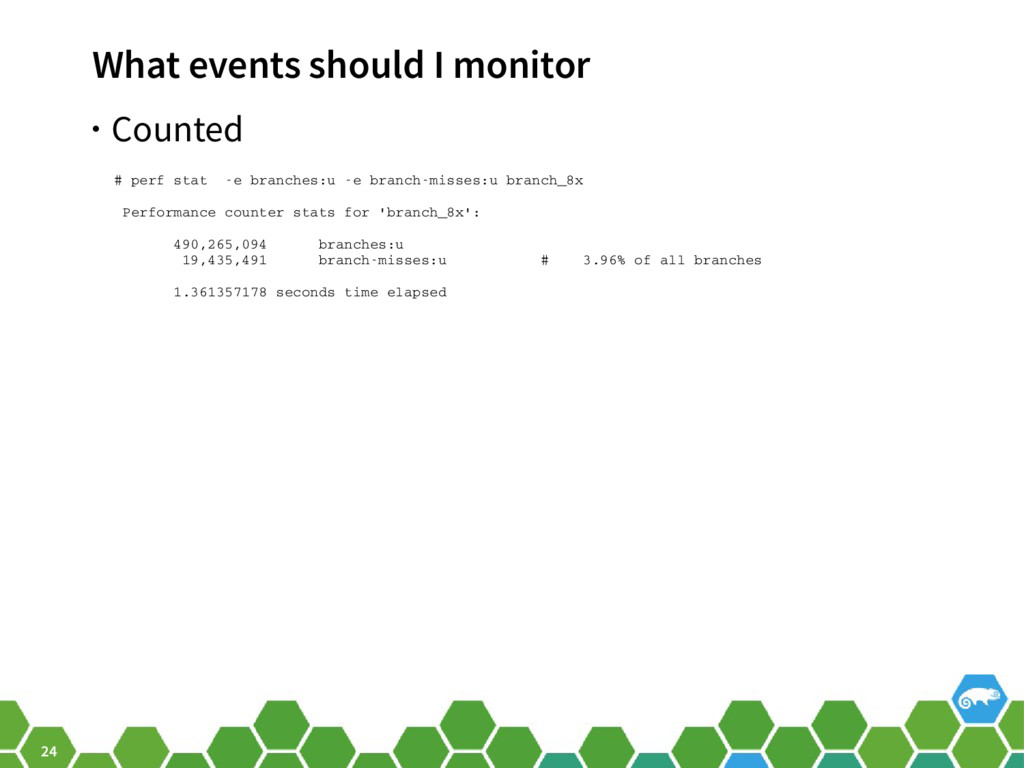
  24. 24 What events should I monitor • Counted # perf

    stat ­e branches:u ­e branch­misses:u branch_8x Performance counter stats for 'branch_8x': 490,265,094 branches:u 19,435,491 branch­misses:u # 3.96% of all branches 1.361357178 seconds time elapsed
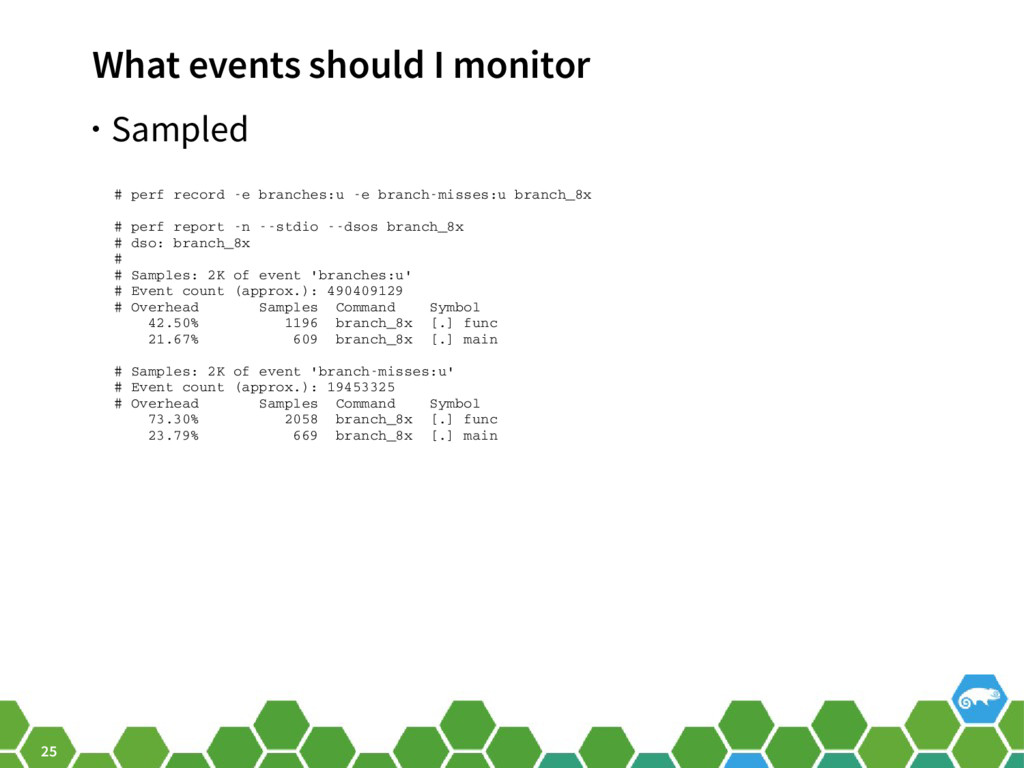
  25. 25 What events should I monitor • Sampled # perf

    record ­e branches:u ­e branch­misses:u branch_8x # perf report ­n ­­stdio ­­dsos branch_8x # dso: branch_8x # # Samples: 2K of event 'branches:u' # Event count (approx.): 490409129 # Overhead Samples Command Symbol 42.50% 1196 branch_8x [.] func 21.67% 609 branch_8x [.] main # Samples: 2K of event 'branch­misses:u' # Event count (approx.): 19453325 # Overhead Samples Command Symbol 73.30% 2058 branch_8x [.] func 23.79% 669 branch_8x [.] main
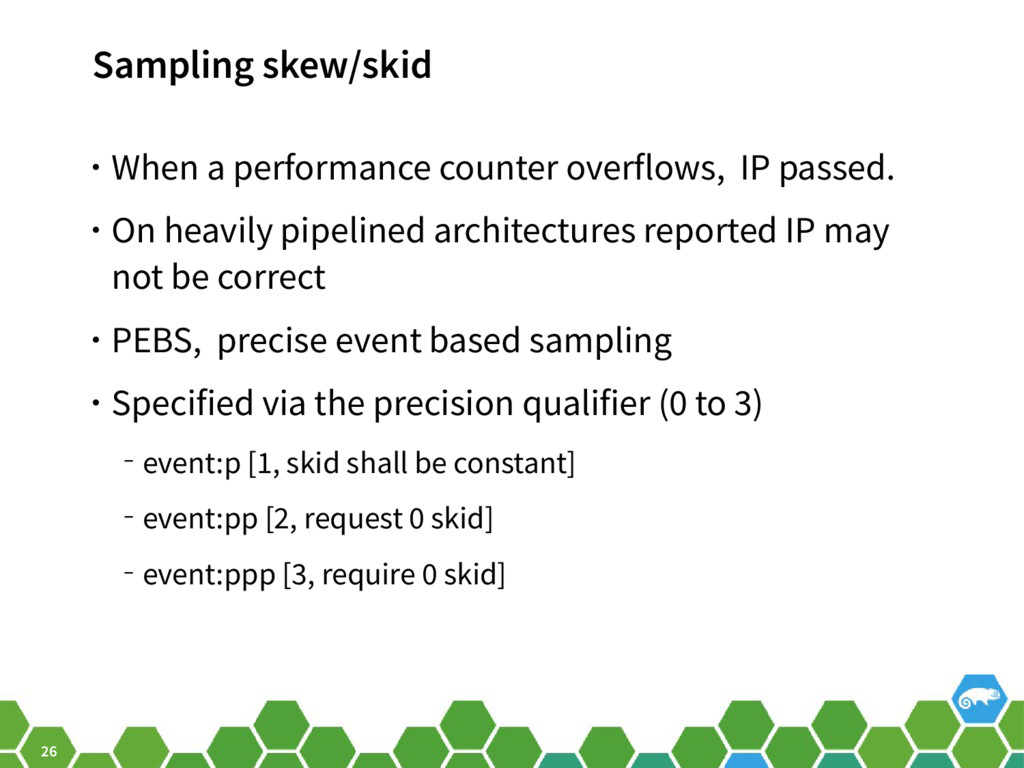
  26. 26 Sampling skew/skid • When a performance counter overflows, IP

    passed. • On heavily pipelined architectures reported IP may not be correct • PEBS, precise event based sampling • Specified via the precision qualifier (0 to 3) ‒ event:p [1, skid shall be constant] ‒ event:pp [2, request 0 skid] ‒ event:ppp [3, require 0 skid]
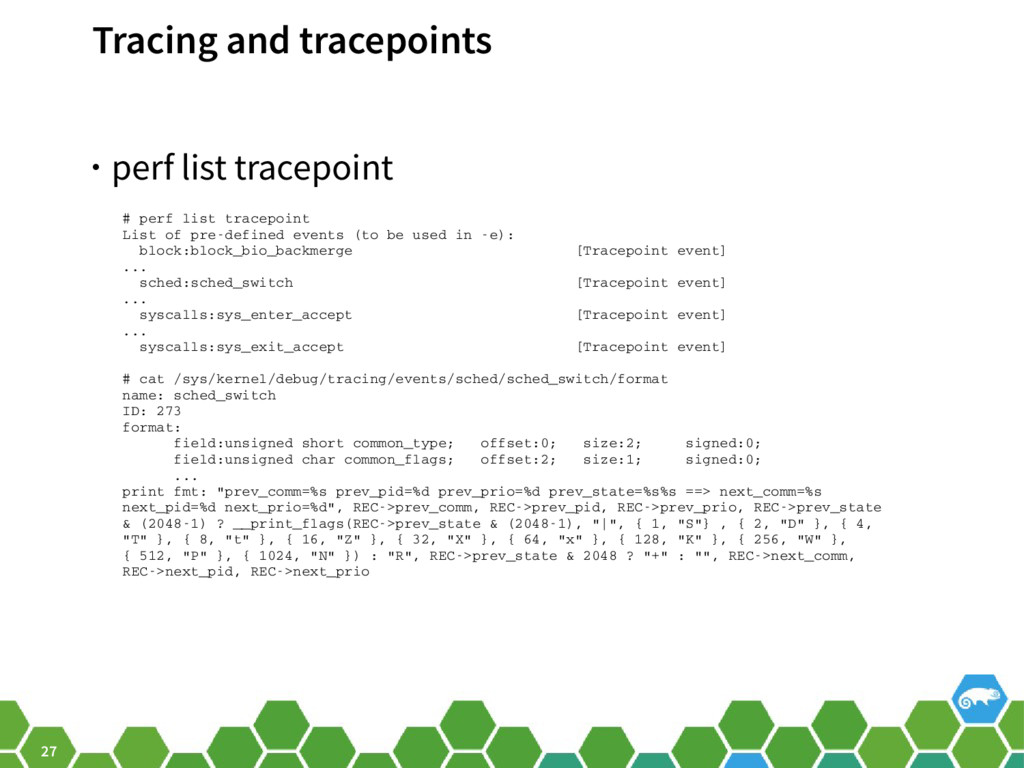
  27. 27 Tracing and tracepoints • perf list tracepoint # perf

    list tracepoint List of pre­defined events (to be used in ­e): block:block_bio_backmerge [Tracepoint event] ... sched:sched_switch [Tracepoint event] ... syscalls:sys_enter_accept [Tracepoint event] ... syscalls:sys_exit_accept [Tracepoint event] # cat /sys/kernel/debug/tracing/events/sched/sched_switch/format name: sched_switch ID: 273 format: field:unsigned short common_type; offset:0; size:2; signed:0; field:unsigned char common_flags; offset:2; size:1; signed:0; ... print fmt: "prev_comm=%s prev_pid=%d prev_prio=%d prev_state=%s%s ==> next_comm=%s next_pid=%d next_prio=%d", REC­>prev_comm, REC­>prev_pid, REC­>prev_prio, REC­>prev_state & (2048­1) ? __print_flags(REC­>prev_state & (2048­1), "|", { 1, "S"} , { 2, "D" }, { 4, "T" }, { 8, "t" }, { 16, "Z" }, { 32, "X" }, { 64, "x" }, { 128, "K" }, { 256, "W" }, { 512, "P" }, { 1024, "N" }) : "R", REC­>prev_state & 2048 ? "+" : "", REC­>next_comm, REC­>next_pid, REC­>next_prio
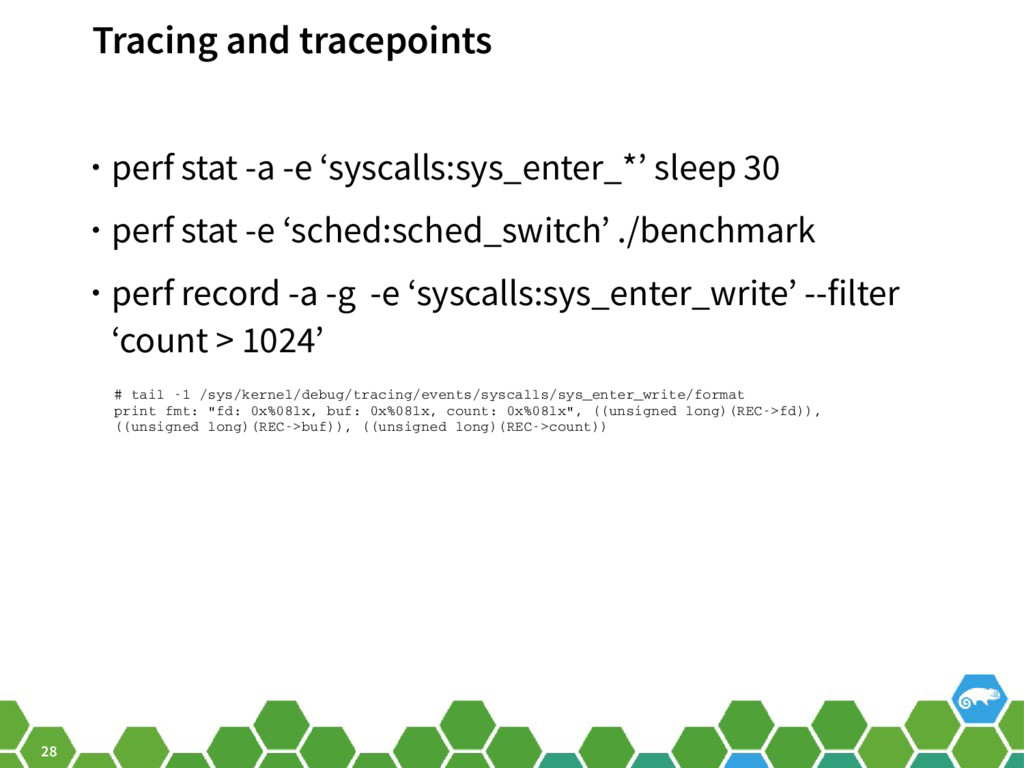
  28. 28 Tracing and tracepoints • perf stat -a -e ‘syscalls:sys_enter_*’

    sleep 30 • perf stat -e ‘sched:sched_switch’ ./benchmark • perf record -a -g -e ‘syscalls:sys_enter_write’ --filter ‘count > 1024’ # tail ­1 /sys/kernel/debug/tracing/events/syscalls/sys_enter_write/format print fmt: "fd: 0x%08lx, buf: 0x%08lx, count: 0x%08lx", ((unsigned long)(REC­>fd)), ((unsigned long)(REC­>buf)), ((unsigned long)(REC­>count))
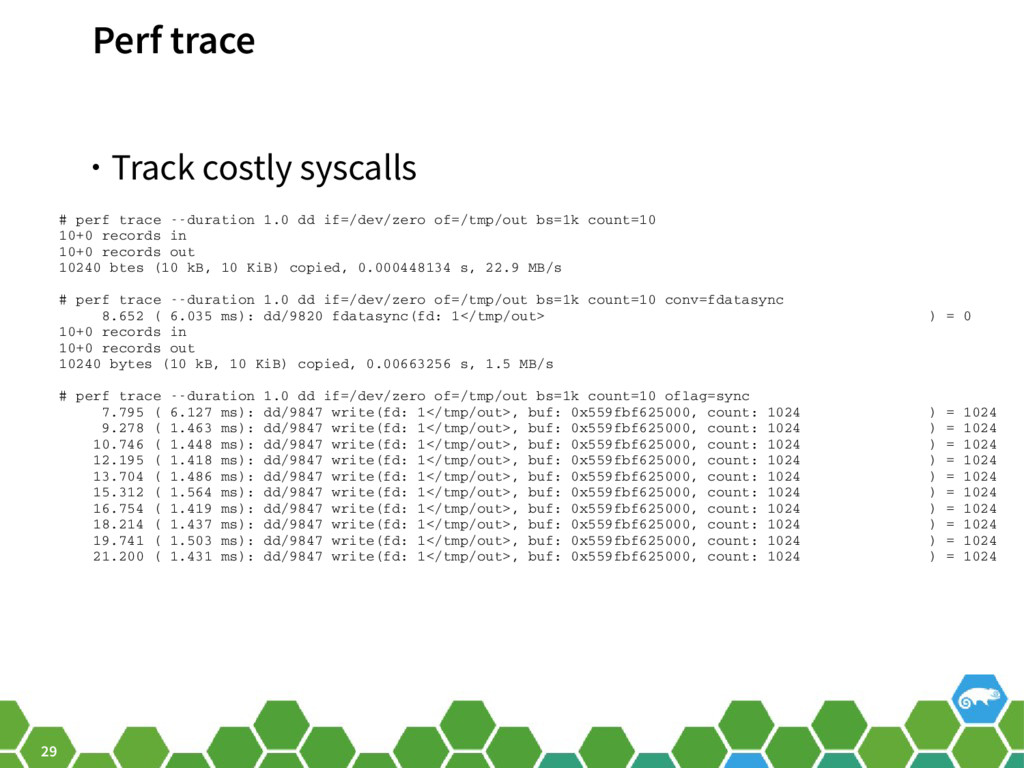
  29. 29 Perf trace • Track costly syscalls # perf trace

    ­­duration 1.0 dd if=/dev/zero of=/tmp/out bs=1k count=10 10+0 records in 10+0 records out 10240 btes (10 kB, 10 KiB) copied, 0.000448134 s, 22.9 MB/s # perf trace ­­duration 1.0 dd if=/dev/zero of=/tmp/out bs=1k count=10 conv=fdatasync 8.652 ( 6.035 ms): dd/9820 fdatasync(fd: 1</tmp/out> ) = 0 10+0 records in 10+0 records out 10240 bytes (10 kB, 10 KiB) copied, 0.00663256 s, 1.5 MB/s # perf trace ­­duration 1.0 dd if=/dev/zero of=/tmp/out bs=1k count=10 oflag=sync 7.795 ( 6.127 ms): dd/9847 write(fd: 1</tmp/out>, buf: 0x559fbf625000, count: 1024 ) = 1024 9.278 ( 1.463 ms): dd/9847 write(fd: 1</tmp/out>, buf: 0x559fbf625000, count: 1024 ) = 1024 10.746 ( 1.448 ms): dd/9847 write(fd: 1</tmp/out>, buf: 0x559fbf625000, count: 1024 ) = 1024 12.195 ( 1.418 ms): dd/9847 write(fd: 1</tmp/out>, buf: 0x559fbf625000, count: 1024 ) = 1024 13.704 ( 1.486 ms): dd/9847 write(fd: 1</tmp/out>, buf: 0x559fbf625000, count: 1024 ) = 1024 15.312 ( 1.564 ms): dd/9847 write(fd: 1</tmp/out>, buf: 0x559fbf625000, count: 1024 ) = 1024 16.754 ( 1.419 ms): dd/9847 write(fd: 1</tmp/out>, buf: 0x559fbf625000, count: 1024 ) = 1024 18.214 ( 1.437 ms): dd/9847 write(fd: 1</tmp/out>, buf: 0x559fbf625000, count: 1024 ) = 1024 19.741 ( 1.503 ms): dd/9847 write(fd: 1</tmp/out>, buf: 0x559fbf625000, count: 1024 ) = 1024 21.200 ( 1.431 ms): dd/9847 write(fd: 1</tmp/out>, buf: 0x559fbf625000, count: 1024 ) = 1024
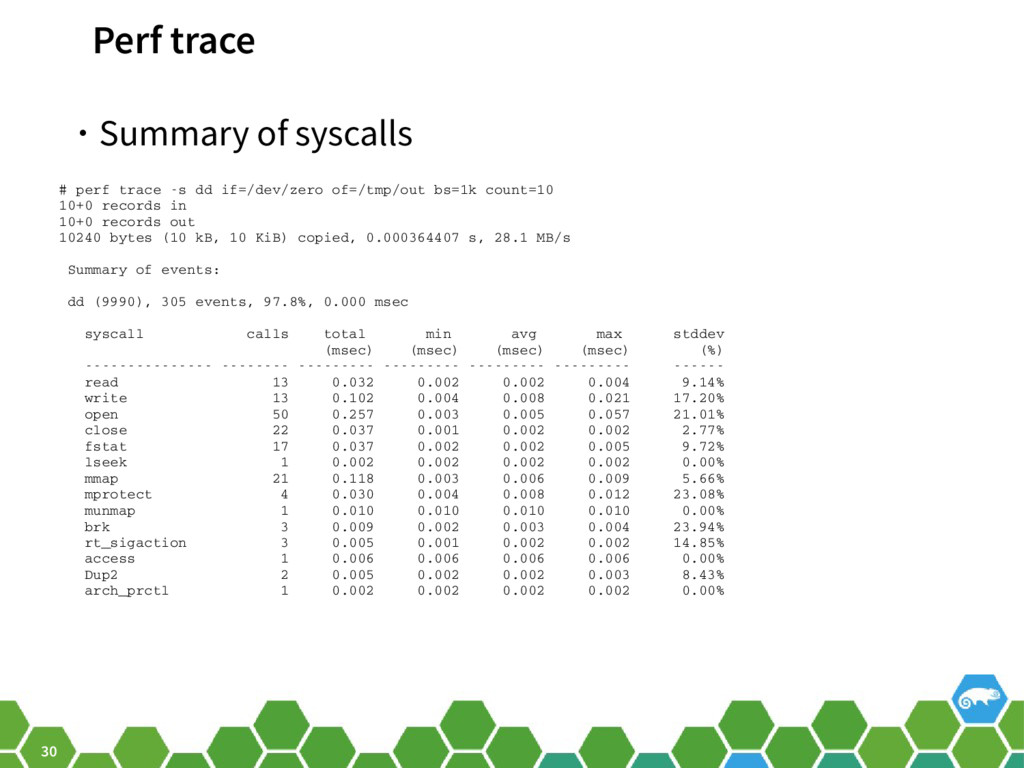
  30. 30 Perf trace • Summary of syscalls # perf trace

    ­s dd if=/dev/zero of=/tmp/out bs=1k count=10 10+0 records in 10+0 records out 10240 bytes (10 kB, 10 KiB) copied, 0.000364407 s, 28.1 MB/s Summary of events: dd (9990), 305 events, 97.8%, 0.000 msec syscall calls total min avg max stddev (msec) (msec) (msec) (msec) (%) ­­­­­­­­­­­­­­­ ­­­­­­­­ ­­­­­­­­­ ­­­­­­­­­ ­­­­­­­­­ ­­­­­­­­­ ­­­­­­ read 13 0.032 0.002 0.002 0.004 9.14% write 13 0.102 0.004 0.008 0.021 17.20% open 50 0.257 0.003 0.005 0.057 21.01% close 22 0.037 0.001 0.002 0.002 2.77% fstat 17 0.037 0.002 0.002 0.005 9.72% lseek 1 0.002 0.002 0.002 0.002 0.00% mmap 21 0.118 0.003 0.006 0.009 5.66% mprotect 4 0.030 0.004 0.008 0.012 23.08% munmap 1 0.010 0.010 0.010 0.010 0.00% brk 3 0.009 0.002 0.003 0.004 23.94% rt_sigaction 3 0.005 0.001 0.002 0.002 14.85% access 1 0.006 0.006 0.006 0.006 0.00% Dup2 2 0.005 0.002 0.002 0.003 8.43% arch_prctl 1 0.002 0.002 0.002 0.002 0.00%
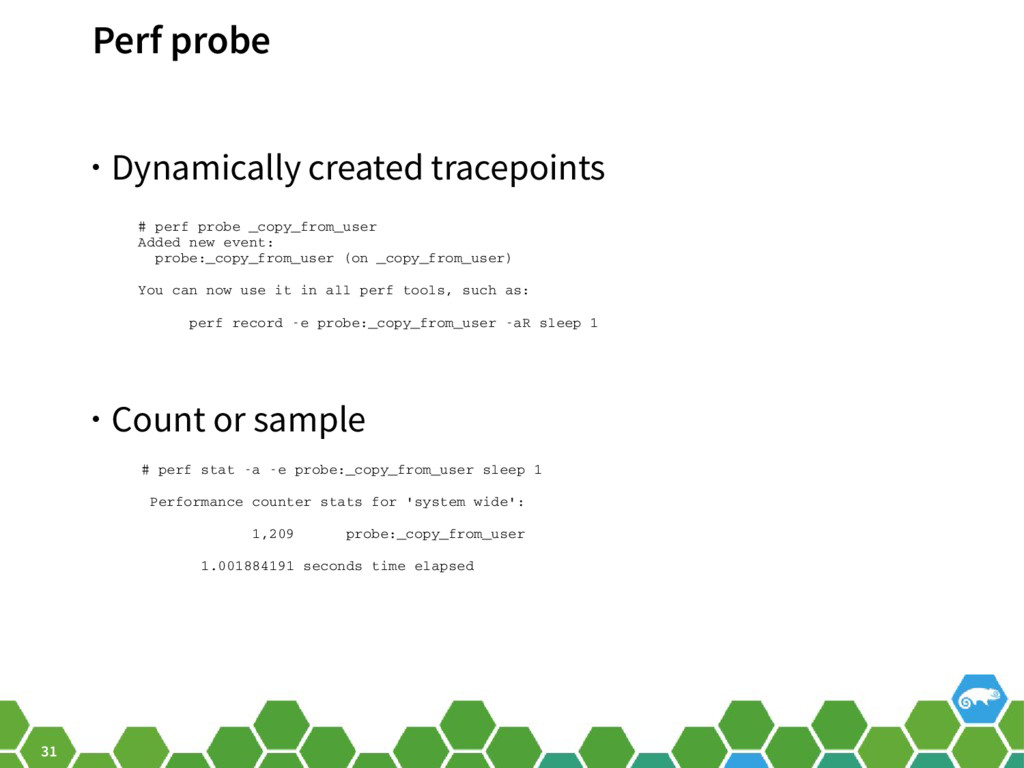
  31. 31 Perf probe • Dynamically created tracepoints • Count or

    sample # perf probe _copy_from_user Added new event: probe:_copy_from_user (on _copy_from_user) You can now use it in all perf tools, such as: perf record ­e probe:_copy_from_user ­aR sleep 1 # perf stat ­a ­e probe:_copy_from_user sleep 1 Performance counter stats for 'system wide': 1,209 probe:_copy_from_user 1.001884191 seconds time elapsed
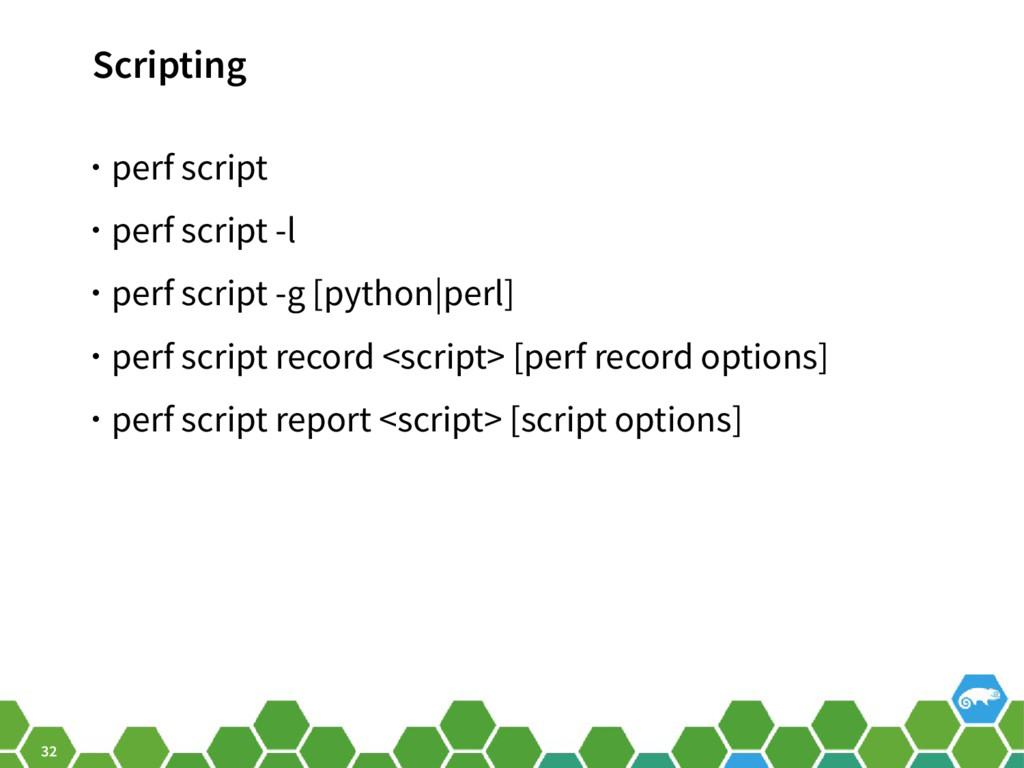
  32. 32 Scripting • perf script • perf script -l •

    perf script -g [python|perl] • perf script record <script> [perf record options] • perf script report <script> [script options]
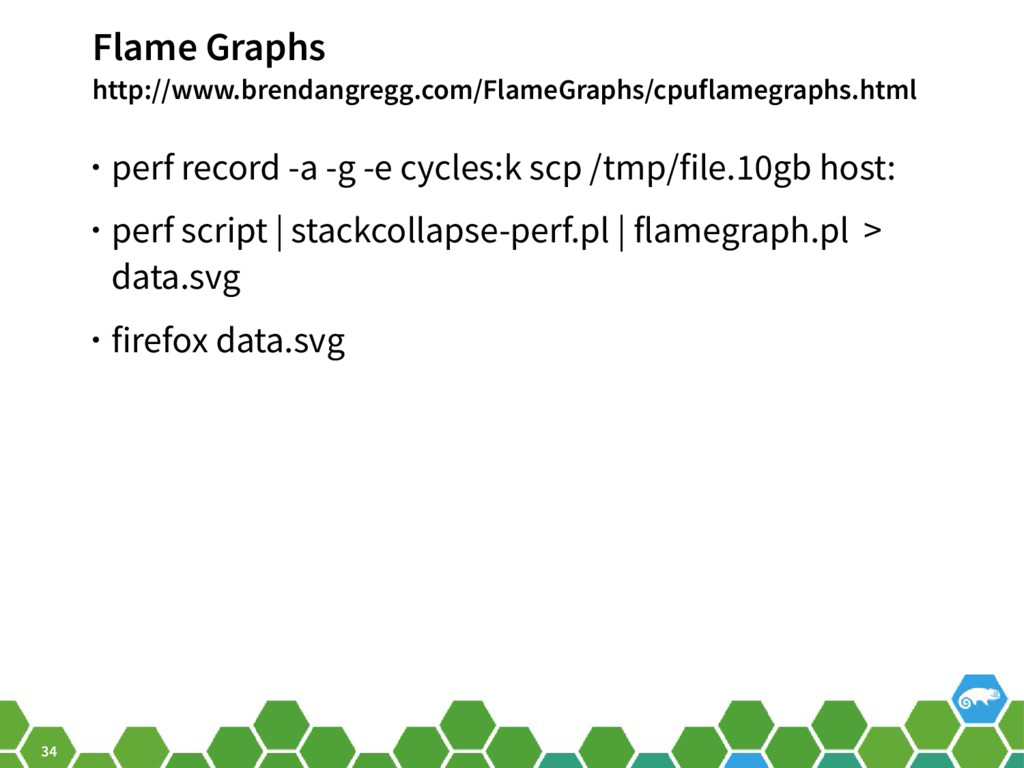
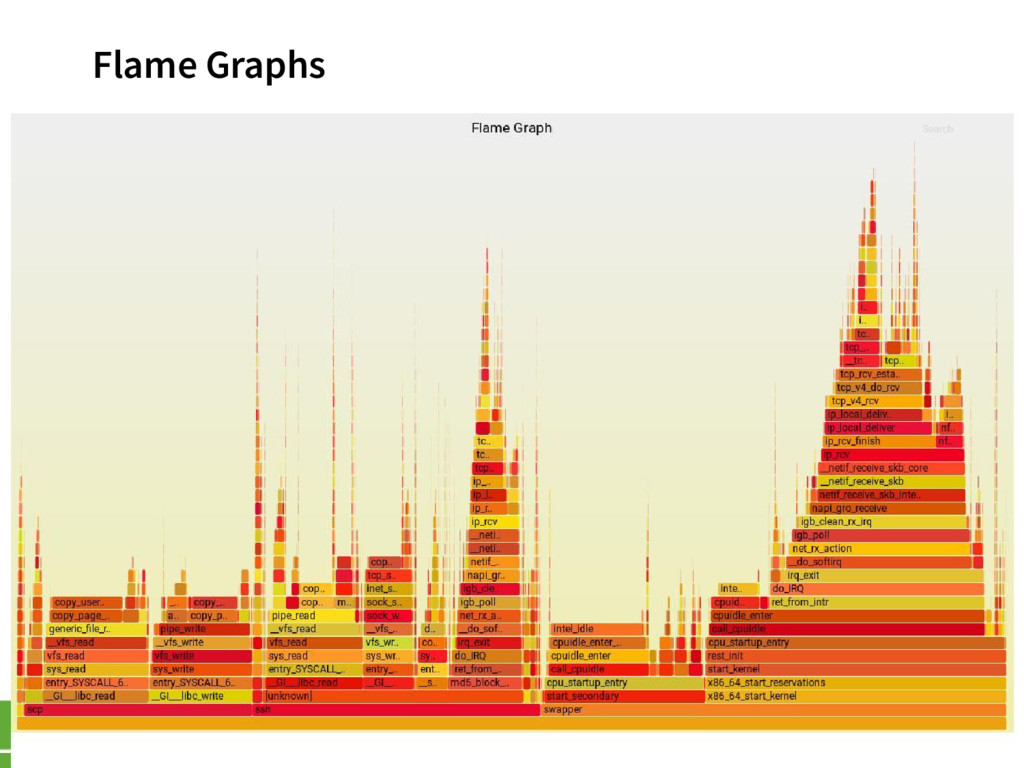
  33. 34 Flame Graphs http://www.brendangregg.com/FlameGraphs/cpuflamegraphs.html • perf record -a -g -e

    cycles:k scp /tmp/file.10gb host: • perf script | stackcollapse-perf.pl | flamegraph.pl > data.svg • firefox data.svg
  34. 36 PAPI / self-monitoring • Performance Application Programming Interface •

    http://icl.cs.utk.edu/papi/ ‒ Has it’s own event monikers termed “event presets”s but can work with perf raw event codes. • Alternative: see implemention of tools/perf/tests/rdpmc.c ‒ http://web.eece.maine.edu/~vweaver/projects/perf_events/ overhead/2015_ispass_overhead.pdf ‒ Mainline commits fe4a3308 and 08aa0d1f
  35. 37 Off-cpu analysis • Monitoring time spent not running. •

    Many reasons ‒ disc io ‒ synchronization (locks, mutexes, signals) ‒ virtual memory ‒ context switching • http://www.brendangregg.com/offcpuanalysis.html
  36. 38 Virtualization • Monitoring guest requires virtualization of pmu hardware.

    • Xen DomU reports software/tracepoint only • QEMU: use ‘-cpu *,pmu=on’ or ‘-cpu host’ (kvm) • Use perf kvm to monitor guest