Upgrade to Pro — share decks privately, control downloads, hide ads and more …

Elastic Observability 體驗工作坊 @ DevOpsDays Taipei 2022

Joe Wu
September 16, 2022

Elastic Observability 體驗工作坊 @ DevOpsDays Taipei 2022

Joe Wu

September 16, 2022
Tweet

More Decks by Joe Wu

Other Decks in Technology

Transcript

  1. Elastic Observability 實作體驗坊 Joe Wu (喬叔) 喬叔 - Elastic Stack

    技術交流 https://www.facebook.com/Joe.ElasticStack Copyright © 2022 一隻狗狗有限公司
  2. • 2021 Feb, 獲得 2022 Elastic Silver Contributor • 2021

    Oct, Elastic Certified Observability Engineer • 2021 Oct, 第13屆 iThome 鐵人賽 DevOps 組冠軍 • 2021 Sep, 書籍出版 - 喬叔帶你上手 Elastic Stack: Elasticsearch 的最佳實踐與最佳化技巧 • 2021 Feb, 獲得 2021 Elastic Silver Contributor • 2020 Oct, 第12屆 iThome 鐵人賽 Elastic Stack on Cloud 組冠軍 • 2018 Oct, 台灣第一位 Elastic Certified Engineer • 2015, 開始教授 Elasticsearch 課程、協助企業內訓及提供顧問服務 • 2015 Oct, 創業,大量使用 Elastic Stack 在產品開發、數據分析、運維監控 • 2013 Oct, Core Elasticsearch Training @ SFO • 2013 May, 導入 ES 0.90 版在跨國軟體產品實作多語系搜尋 (5M+ MAU) Joe Wu (喬叔) 的 Elastic 之旅 實戰 > 9年 教學 > 7年
  3. Observability is the ability to measure the internal states of

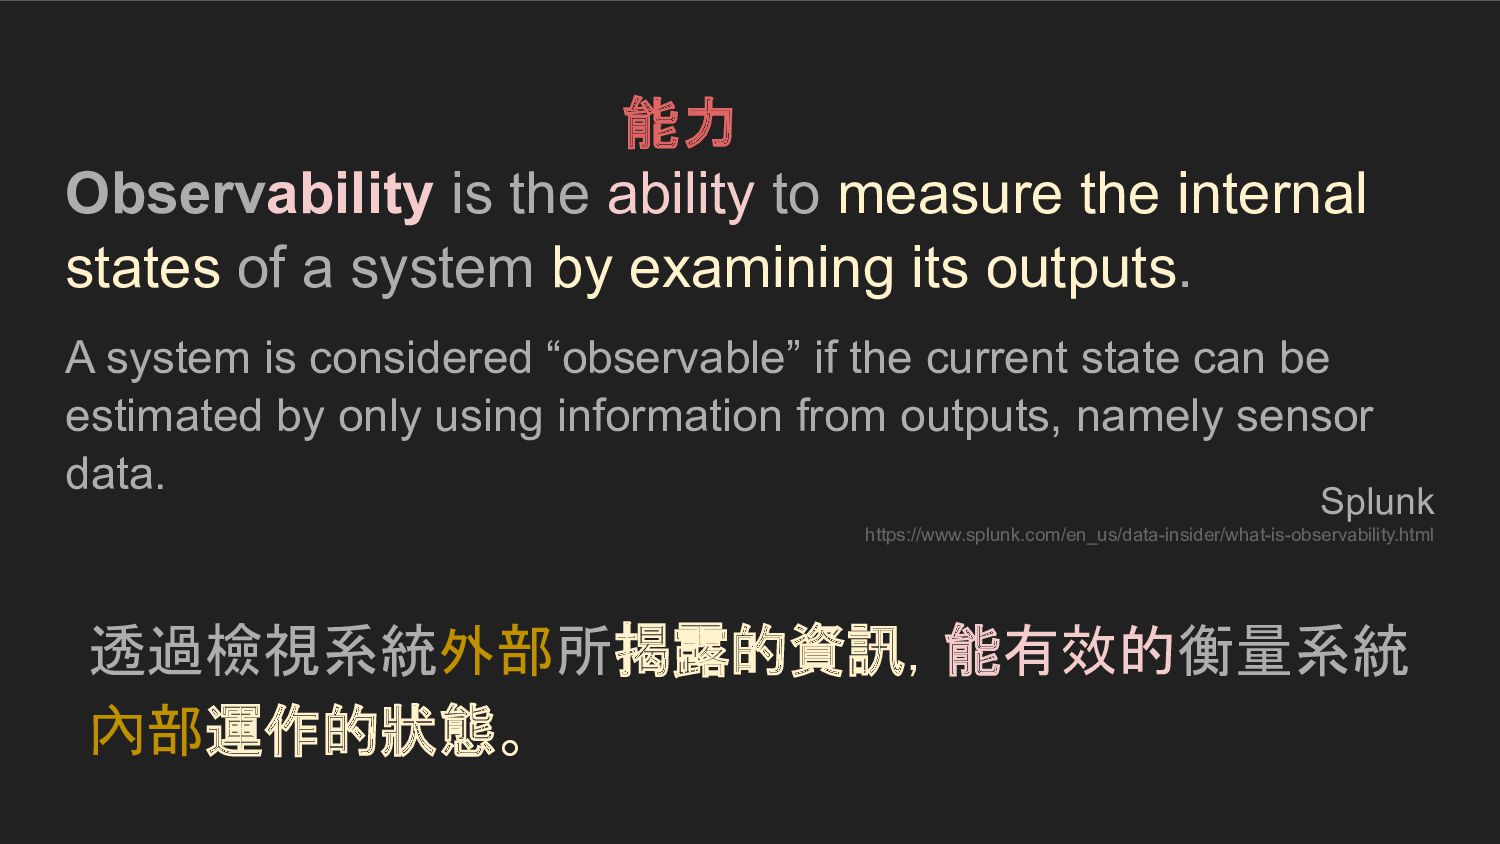
    a system by examining its outputs. A system is considered “observable” if the current state can be estimated by only using information from outputs, namely sensor data. Splunk https://www.splunk.com/en_us/data-insider/what-is-observability.html 能力 透過檢視系統外部所揭露的資訊,能有效的衡量系統 內部運作的狀態。
  4. Observability is tooling or a technical solution that allows teams

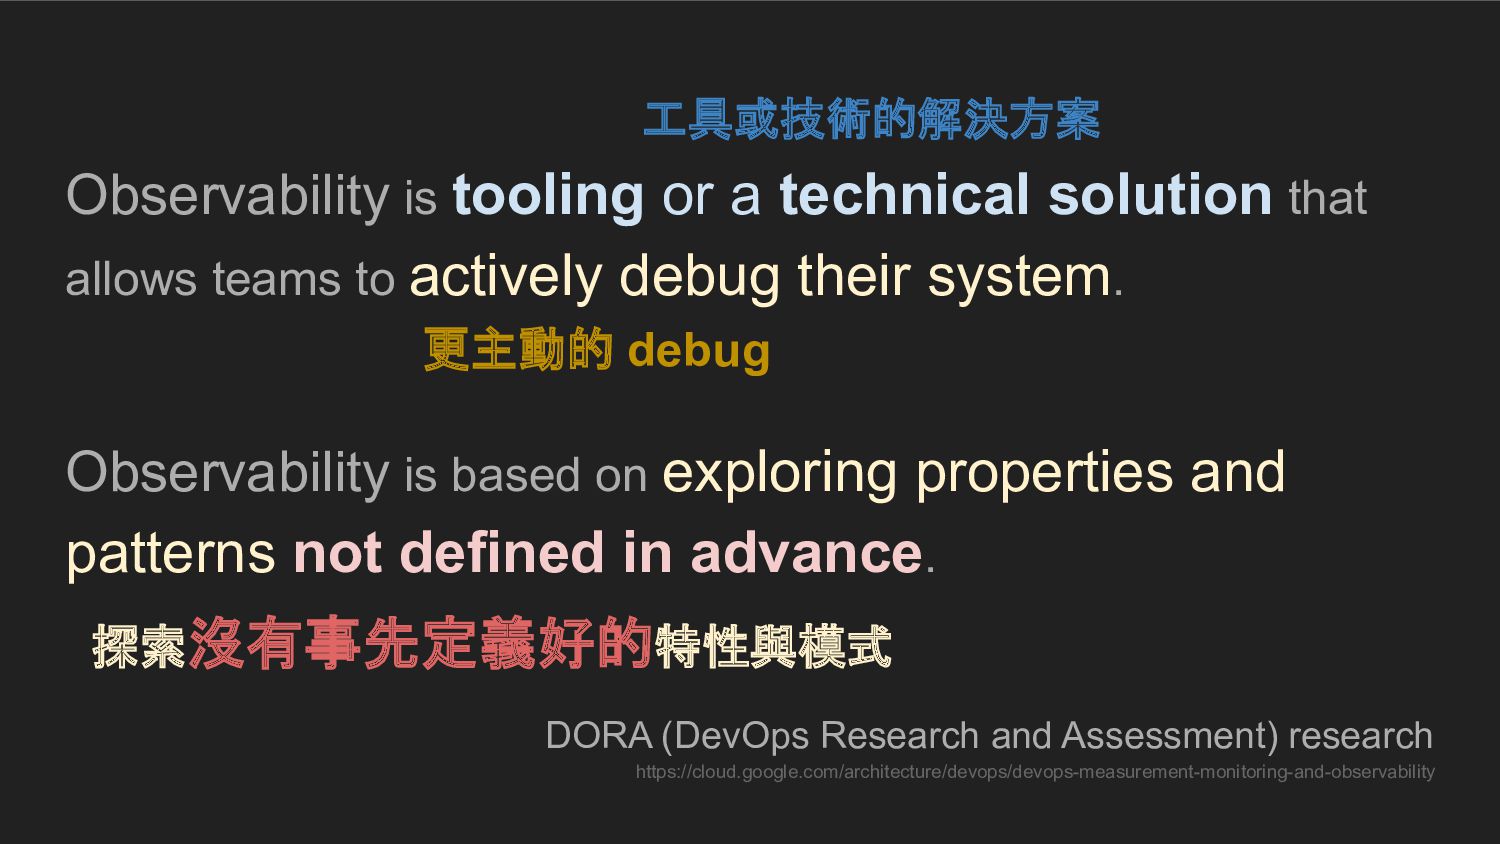
    to actively debug their system. Observability is based on exploring properties and patterns not defined in advance. DORA (DevOps Research and Assessment) research 工具或技術的解決方案 更主動的 debug 探索沒有事先定義好的特性與模式 https://cloud.google.com/architecture/devops/devops-measurement-monitoring-and-observability
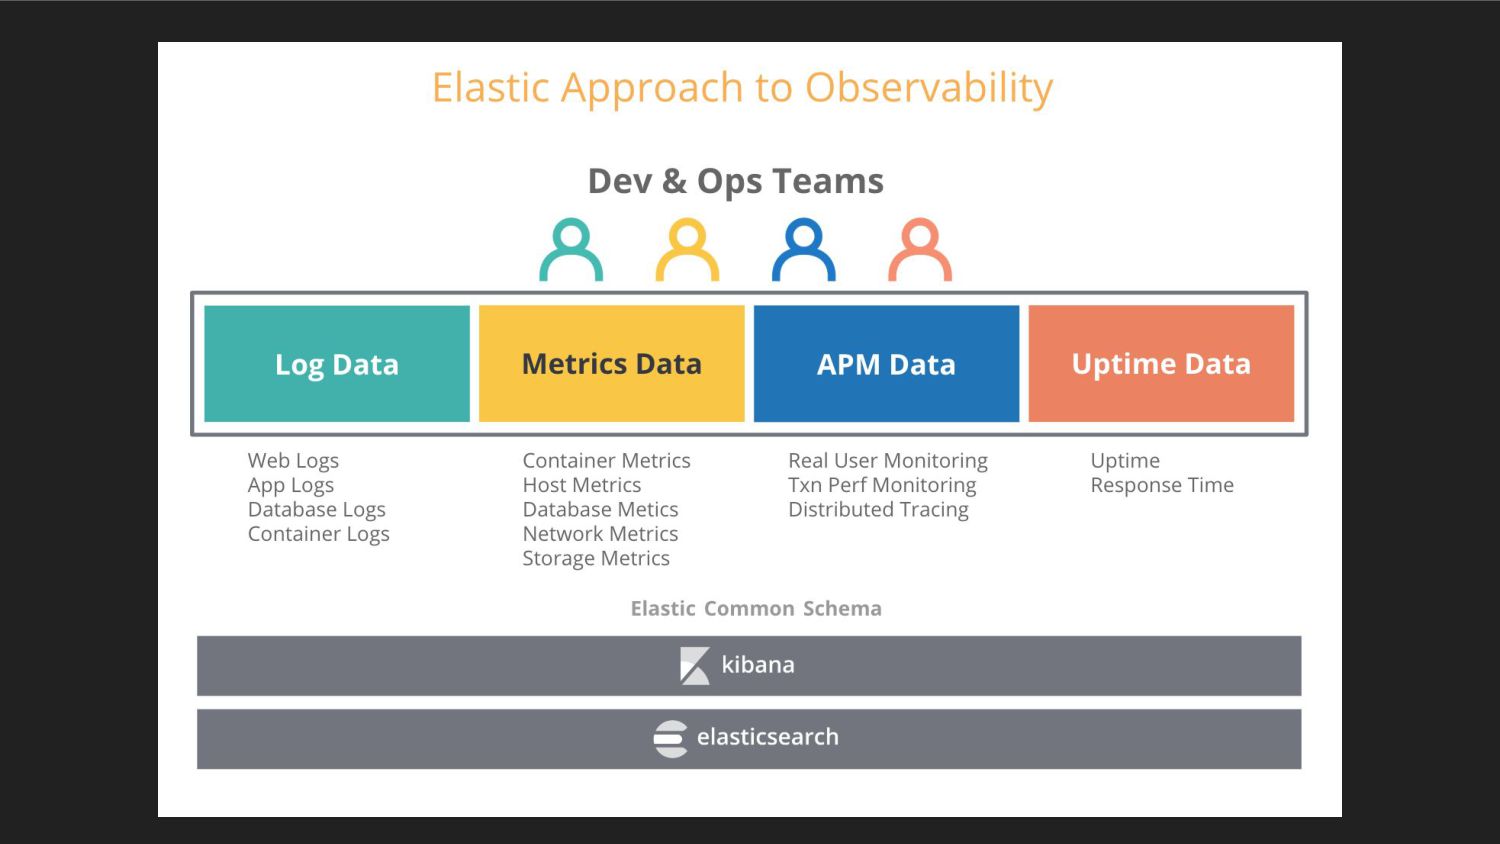
  5. 1. 偵測不良的行為 2. 提升解決問題效率的方法 Elastic Observability Product VP - Tanya

    Bragin https://www.elastic.co/blog/observability-with-the-elastic-stack
  6. 1. 偵測不良的行為 a. 選擇 SLI (Service Level Indicators) → Uptime

    (服務正常運行的時間)、Latency、Errors… b. 決定 SLO (Service Level Objectives) → 一年之中,Uptime 的時間比例要達到 5 個 9 = 99.999% c. 制訂 SLA (Service Level Aggrements) → SLI + SLO 保障的依據 (沒達到要怎麼辦…) d. 以終為始 → 提升客戶滿意度
  7. 2. 提升解決問題效率的方法 a. 出問題時,協助相關人員能更有效率的找尋問題與解法。 → 平均修復時間,MTTR (Mean time to Recovery)

    b. 異常發生時,就能觀察到,並減少更大的災情 → 主動警報,甚至主動發現異常 (Machine Learning)。
  8. Elastic Common Schema (ECS) • 是一個 Open Source 的規範[1] ◦

    Guideline (準則):欄位的定義、必填欄位、欄位的命名規則 ◦ Convension (公約):資料存放與管理的規則 • 已經將 Elastic Stack 生態圈所整合好的各種服務的欄位統一了 ◦ Elastic Integration 整合了 數十種 的 modules 及 metricset。 ◦ 命名規則、資料型態、Distributed Services 與 Infrastructure 之關的關聯性。 • 要定義自己特定商業領域的 Common Schema,會是很好的參考。 [1] Elastic Common Schema (ECS) - https://www.elastic.co/guide/en/ecs/current/index.html
  9. Filebeat • Input ◦ filestream (text, json…) ◦ Container ◦

    AWS S3, Cloudwatch ◦ …20+種 • Module ◦ Elastic Stack ◦ MySQL ◦ PostgreSQL ◦ Redis ◦ Apache, Nginx ◦ …70種 • Output
  10. Metricbeat • 60+ 整合好的 Modules ◦ System (CPU, Memory, Disk

    I/O…) ◦ Apache ◦ MySQL ◦ Redis ◦ MongoDB ◦ Elastic Stack ◦ Docker ◦ Kubernetes ◦ AWS ◦ ...etc • 客制各種 Metricsets • 建立好的 Kibana Dashboards ./metricbeat modules enable {module_name}
  11. Elastic APM (Application Performance Monitoring) • 是一個能讓你 即時 監控、觀察、分析應用程式及服務的工具。 ◦

    支援多種程式語言的 APM Agent:要改 code ◦ 支援常用的 Framework、Library:簡單直接用 ◦ 愈複雜的架構及處理流程,你愈需要 APM ◦ 當然,運作 APM Agent 會有一定的成本:Sample Rate (取樣率)
  12. Elastic APM 事件 (Event) 的四種類型 • Transaction (交易) ◦ 一個事件

    (event) 的請求與回應,例如:發送一個外部的 Request、批次的作業處理、背景執行的 工作、或是在程式執行中自行定義的一個處理行為 …等。 ◦ 一個 Transaction 之中,可以包含 0 到多個 Spans。 • Span (跨度,可理解成片刻的一小段時間) ◦ 一個活動、一段程式執行時,從開始到結束所發生的資訊,一連串執行與處理的過程中有多個 Spans,也因此一個 Span 可能也會與其他的 Span 有上、下層的關係。 • Error (錯誤) • Metrics (指標)
  13. Heartbeat • HTTP ◦ SSL/TLS ◦ HTTPS Certificate 過期提醒 •

    TCP • ICMP (Ping) • Browser (Synthetic Data) ◦ User Experience ◦ Playwright 模擬使用者行為 ◦ 每一步驟畫面截圖 heartbeat.monitors: - type: icmp schedule: '*/5 * * * * * *' hosts: ["myhost"] id: my-icmp-service name: My ICMP Service - type: tcp schedule: '@every 5s' hosts: ["myhost:12345"] mode: any id: my-tcp-service - type: http schedule: '@every 5s' urls: ["http://example.net"] service.name: apm-service-name id: my-http-service name: My HTTP Service 設定其實很簡單, 難的是要設定什麼?
  14. 你要如何知道,你的服務是正常運作的? • 監控不只從最外面的 Internet 來監控,從 client 端一路到服務所運作 的伺服器,這條路線中你要從哪一層切入? ◦ 不同國家

    ◦ 不同地區 ◦ 不同 ISP • 哪些 endpoints 要被監控? • 回應時間什麼樣算是正常? • 監控部署的方式,是不是夠安全可靠?
  15. Service Level Indicator & Objective - 1 • SLA ◦

    Opbeans 年度 Uptime 需達到 99.99% (Downtime < 52.6分鐘)。 • SLO ◦ Opbeans 月度 Uptime 需達到 99.995% (Downtime < 2.18分鐘)。 • SLI ◦ Opbeans 網站首頁的 HTTP 存取錯誤率 (error rate) ▪ 每 1 分鐘檢查一次首頁的存取狀態。 ▪ 如果 10 分鐘內有超過 3 次錯誤,就算 downtime。 ▪ 間斷性的小於 3 次的錯誤,不被計算在 downtime 內。
  16. Service Level Indicator & Objective - 2 • SLO ◦

    Opbeans 平均 95% 的頁面回應時間 < 3000ms。 • SLO ◦ Opbeans 平均 99% 的頁面回應時間 < 2500ms。 ◦ Opbeans 平均 95% 的頁面回應時間 < 1500ms。 • SLI ◦ Latency: APM transaction latency,針對 page_load。 ▪ 每分鐘檢查一次。 ▪ 平均近 5 分鐘內的 Latency,進行 SLO 的驗證。
  17. 查探問題的技巧 • 掌握全局的狀態 • 觀察影響的程度 • 時間的變化 • 集中並結構化的 Logs

    • Machine Learning 的 協助 https://www.elastic.co/blog/elastic-observability-sre-incident-response
  18. Elastic Observability • 以終為始:SLA, SLO, SLI ◦ 偵測不良的行為 ◦ 提升解決問題效率的方法

    • 任務 ◦ 任務一:將 apm-integration-test 運作起來 ◦ 任務二:收集 Opbeans 各服務所產生的 Logs ◦ 任務三:收集 Opbeans 各服務所產生的 Metrics ◦ 任務四:收集 Opbeans 各服務所產生的 Traces ◦ 任務五:監控 Opbeans 的服務運作狀態 (Uptime) ◦ 任務六:設定異常時的主動通知 - Alert • 能探索未事先定義的徵狀,一但發現之後,應該要收斂與被定義。
  19. Reference • 體驗坊的操作步驟 ◦ https://hackmd.io/@estraining/DevOpsDaysTaipei2022 • 直接試玩成品 ◦ https://demo.elastic.co •

    自己動手架設一組成品 ◦ https://github.com/elastic/apm-integration-testing • 一步一步自己做 ◦ 官方文件:https://www.elastic.co/guide/en/observability/current/index.html ◦ Videos & Webinar:https://www.elastic.co/videos ◦ 喬叔帶你上手 Elastic Stack - 探索與實踐 Observability