Upgrade to Pro — share decks privately, control downloads, hide ads and more …

UXINDIA15- Can Visualization Design make or break a Visualization & How! (Sangeetha Jayaram) by uxindia

uxindia
October 25, 2015

UXINDIA15- Can Visualization Design make or break a Visualization & How! (Sangeetha Jayaram) by uxindia

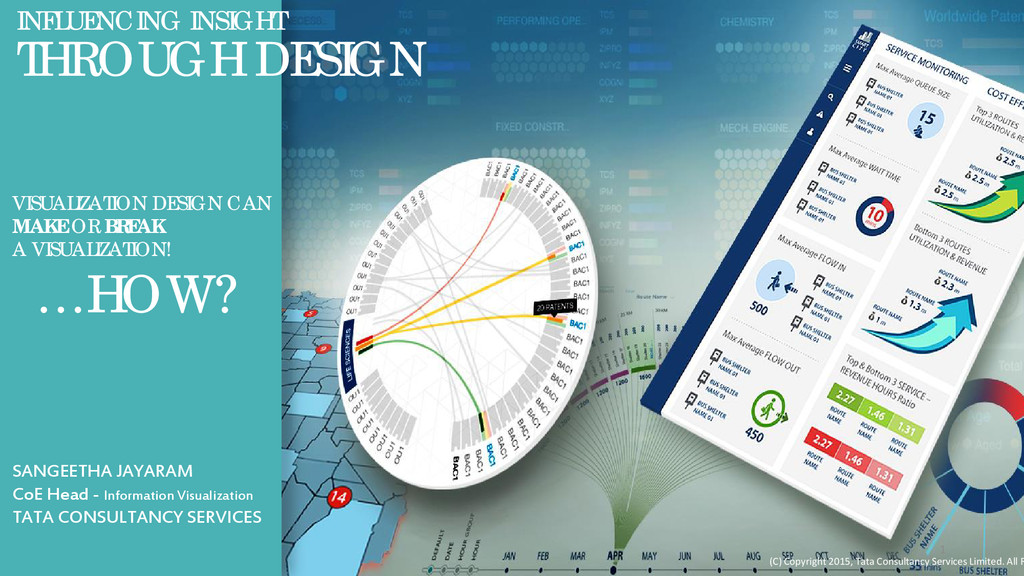
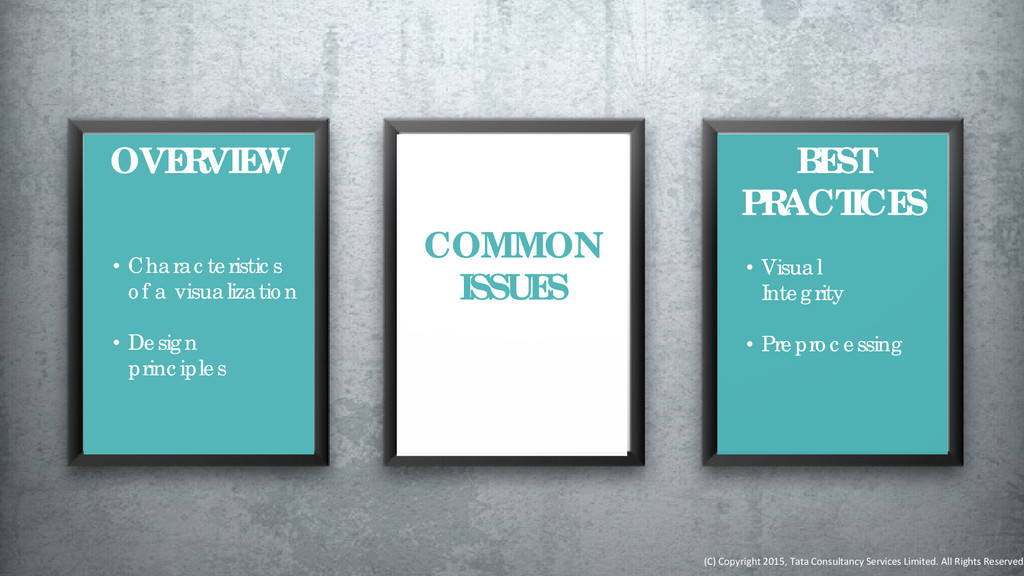
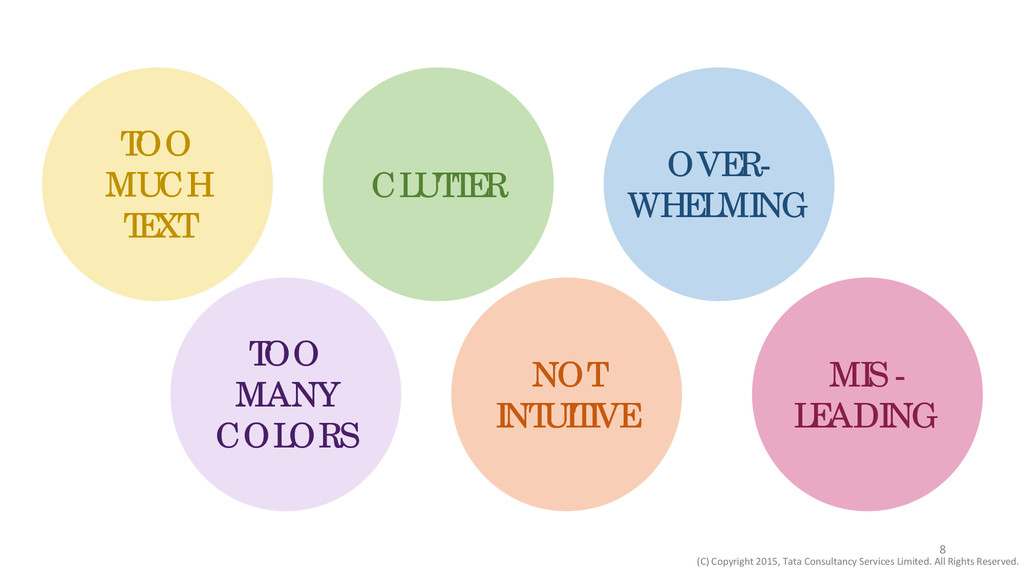
One of the growing trends in the field of BI is the increasing acceptance and recognition of Visualization as a form of analytics. Considered as an interesting combination of multi-dimensional discipline of art, science and technology, viz derives its ability to communicate intuitive insights by leveraging human visual and cognitive abilities. Traditional reports and dashboards are replaced with interactive visualizations that are designed with a purpose. With the increase in applicability of visualization, comes the responsibility of designing it to meet its objective. Designing complex visualizations require a keen sense of understanding the viz’s core objectives, the dynamics of “when/what and where” questions being answered, the delicate balance between intuitiveness of the visualization and the visual appeal of the same. Imbalance in any one of the core parameters can lead to a visualization that is confusing, misleading and non-intepretable.

uxindia

October 25, 2015
Tweet

More Decks by uxindia

Other Decks in Design

Transcript

  1. 1

  2. VISUALIZATION DESIGN CAN MAKE OR BREAK A VISUALIZATION! …HOW? (C)

    Copyright 2015, Tata Consultancy Services Limited. All R SANGEETHA JAYARAM CoE Head - Information Visualization TATA CONSULTANCY SERVICES 1 INFLUENCING INSIGHT THROUGH DESIGN
  3. BEST PRACTICES • Visual Integrity • Preprocessing 3 OVERVIEW •

    Characteristics of a visualization • Design Principles COMMON ISSUES (C) Copyright 2015, Tata Consultancy Services Limited. All Rights Reserved.
  4. COMMON ISSUES OVERVIEW • Characteristics of a visualization • Design

    principles BEST PRACTICES • Visual Integrity • Preprocessing 6 (C) Copyright 2015, Tata Consultancy Services Limited. All Rights Reserved
  5. TOO MUCH TEXT CLUTTER OVER- WHELMING TOO MANY COLORS NOT

    INTUITIVE MIS - LEADING 8 (C) Copyright 2015, Tata Consultancy Services Limited. All Rights Reserved.
  6. OVERVIEW • Characteristics of a visualization • Design principles 9

    COMMON ISSUES BEST PRACTICES • Visual Integrity • Preprocessing
  7. Visual Integrity Preprocessing Attributes How To PRE-EMPT Such Issues 10

    (C) Copyright 2015, Tata Consultancy Services Limited. All Rights Reserved.
  8. VISUAL INTEGRITY AREA BASED ENCODING • Inaccurate • not possible

    to correlate Visually • % Values not calculated properly ISSUE USING ICON CONCEPT (ISOTYPE) This encoding helps when we are dealing with large data. Each icon can represent a scale much higher, thereby aiding visual comparison 11
  9. VISUAL INTEGRITY ECONOMIES OF SCALE • Lack of proper scale

    (Look at Truck Drivers & Miners) • Too many colors • Lack of co-relation to time ISSUE USING CIRCULAR BAR CONCEPT This is a creative way to represent BAR, however, must ensure that scale mapping is done 12
  10. https://medium.com/i-data/misleading-with-statistics-c63780efa928 VISUAL INTEGRITY ECONOMIES OF SCALE • Not enough data

    points • Truncated Axis • Lack of co-relation to time • Lack of Contextual ISSUE REPRESENTING TRENDS Ensure that related data, scale, outliers, contextual data points are all covered in the design Eric Portelance 13
  11. Do not Split Information if they are correlated Misleading with

    Proximity Do not repeat information Aesthetics Vs Insight ?? Remove Noise If you use Area Based Encoding, remember you cannot show NEGATIVE data You can use typography to visually indicate size (Tree- map) Keep the UI Clean GENERAL PRINCIPLES 18