UXINDIA2019: India's biggest international conference on User Experience Design which is being celebrated on Sep 9, 10 & 11 at Novotel HICC, Hyderabad.
www.ux-india.org/uxindia2019
#ux #uxindia #uxindia2019 #designthinking #uxi19 #uxconference #umodesign
![Agenda [15 min] Introduction 8.30-8.45am [15 min] What is mixed](https://files.speakerdeck.com/presentations/e2390635c9324eba8b348210f61ebe95/slide_2.jpg)
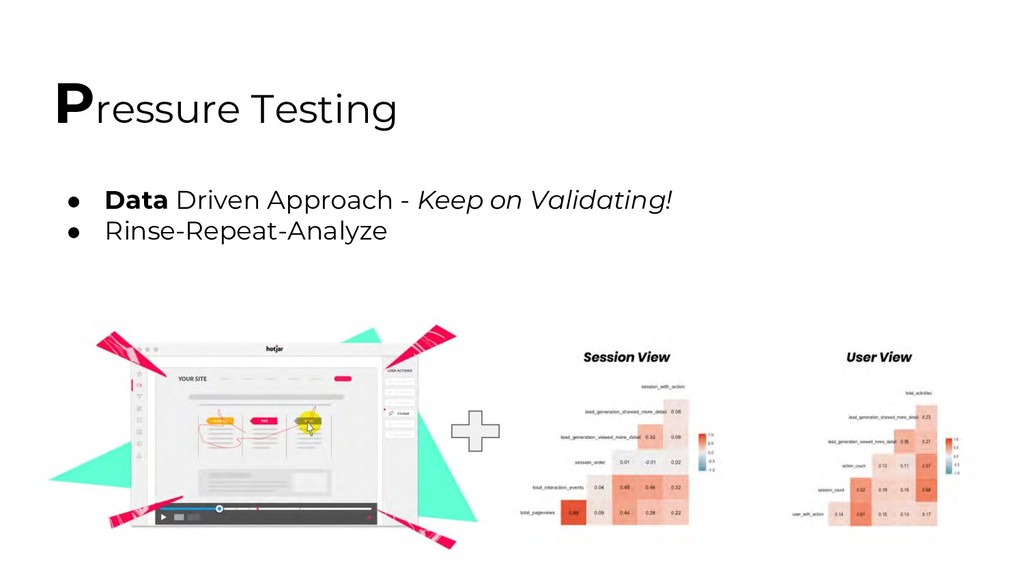
![Tracking Research [15 minute activity] How to measure success? Metrics,](https://files.speakerdeck.com/presentations/e2390635c9324eba8b348210f61ebe95/slide_27.jpg)
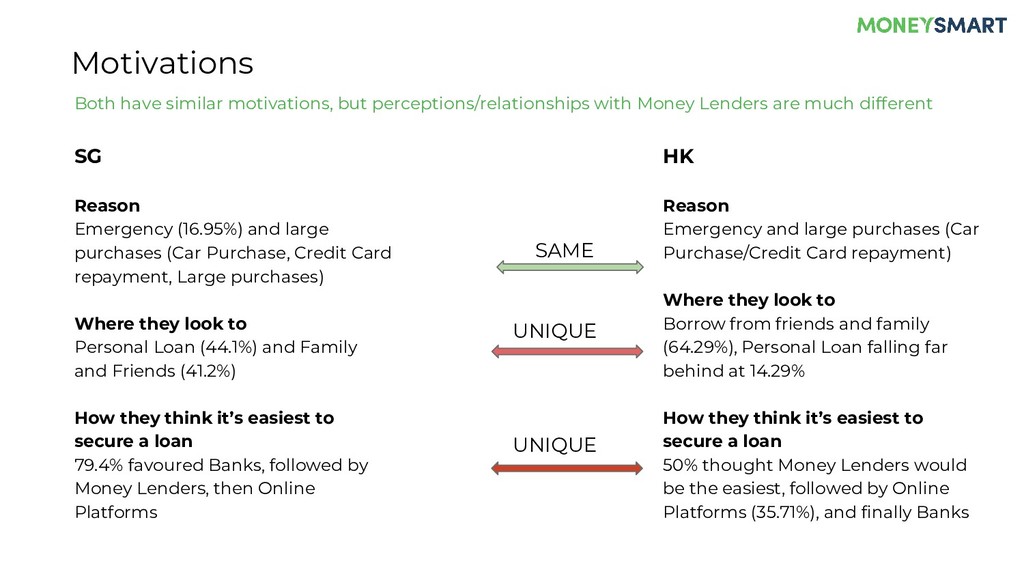
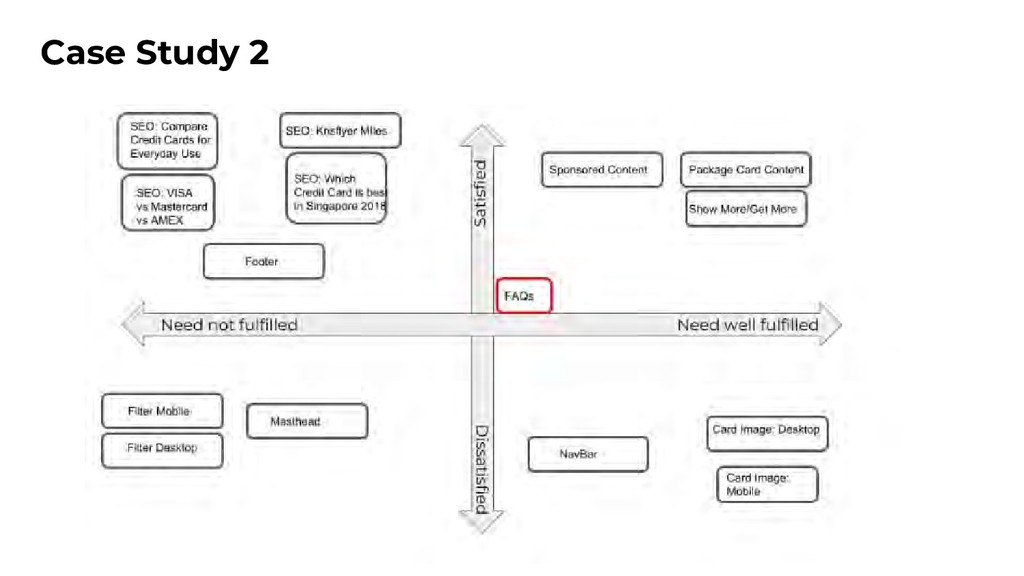
![Case Study - Breakout Session [30 minute presentation/activity]](https://files.speakerdeck.com/presentations/e2390635c9324eba8b348210f61ebe95/slide_62.jpg)