Do you ever feel like your reports aren’t really being read, let alone acted on?
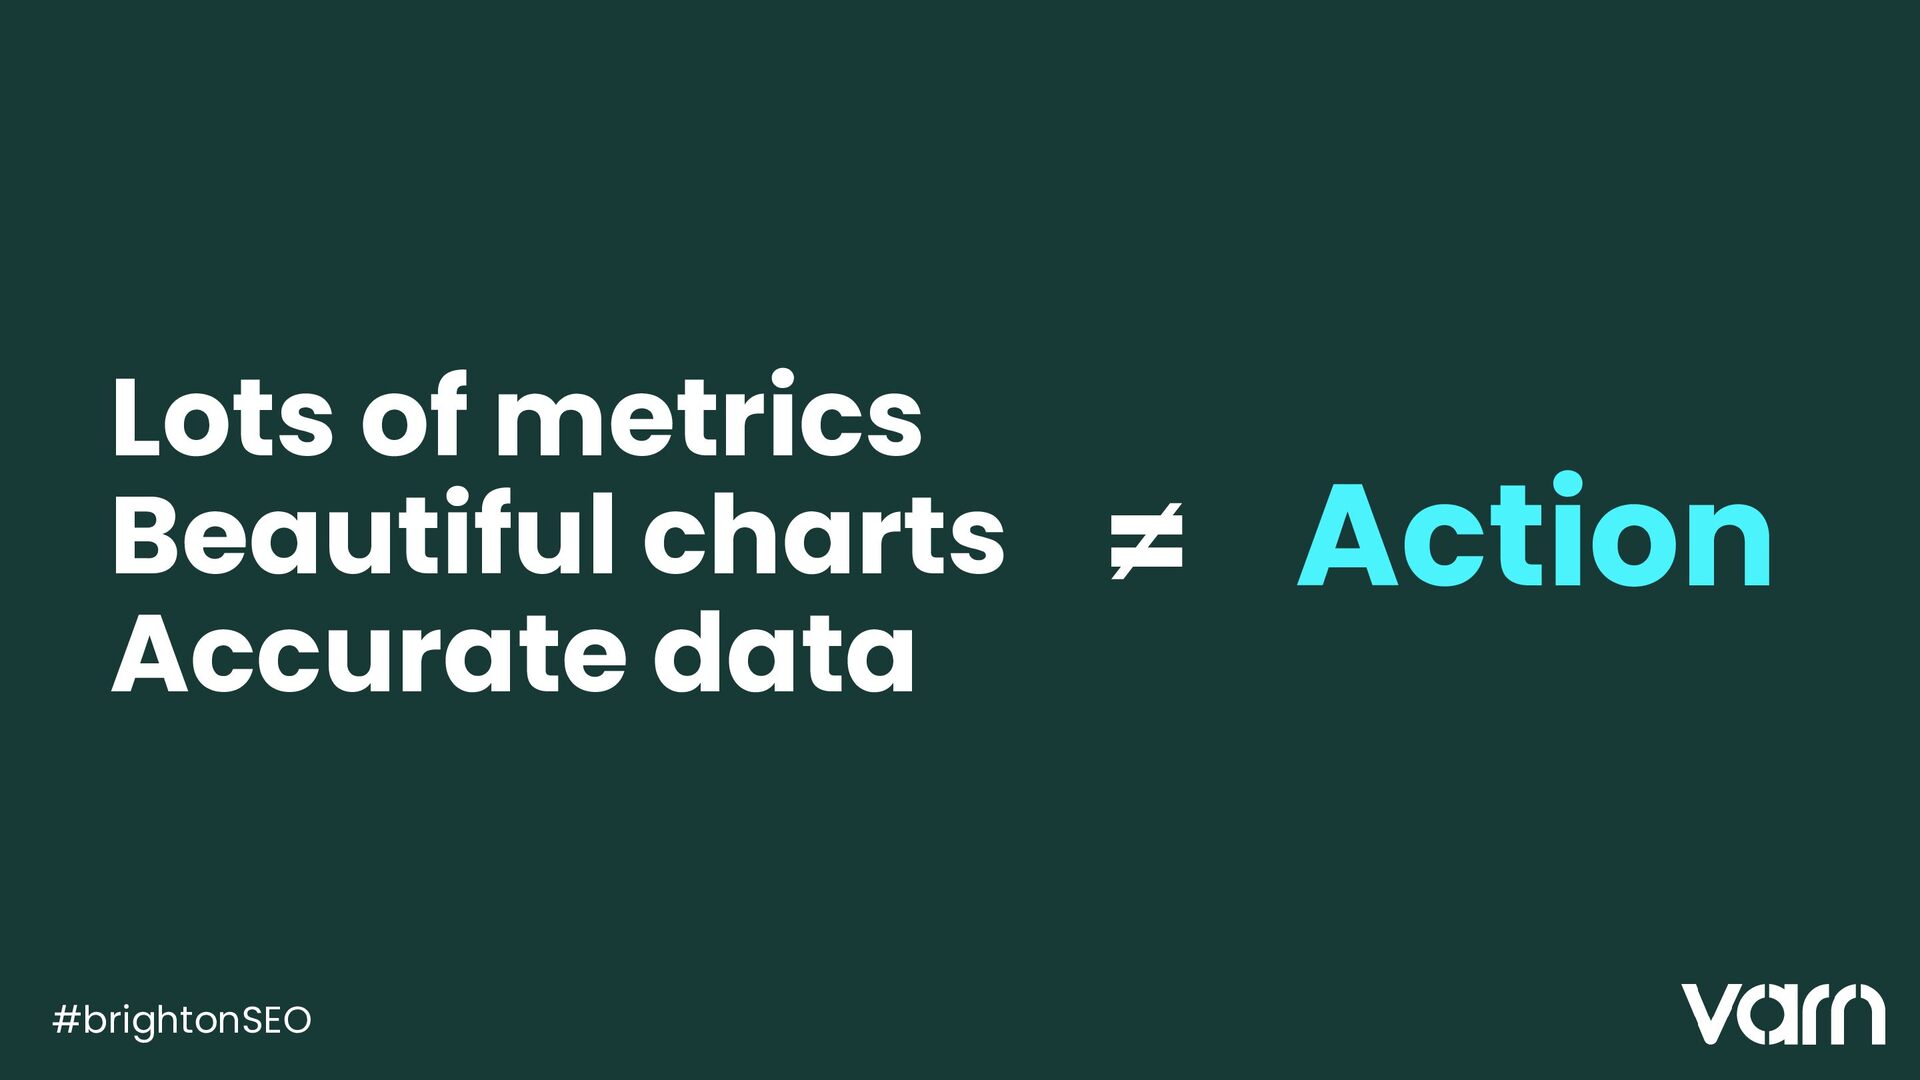
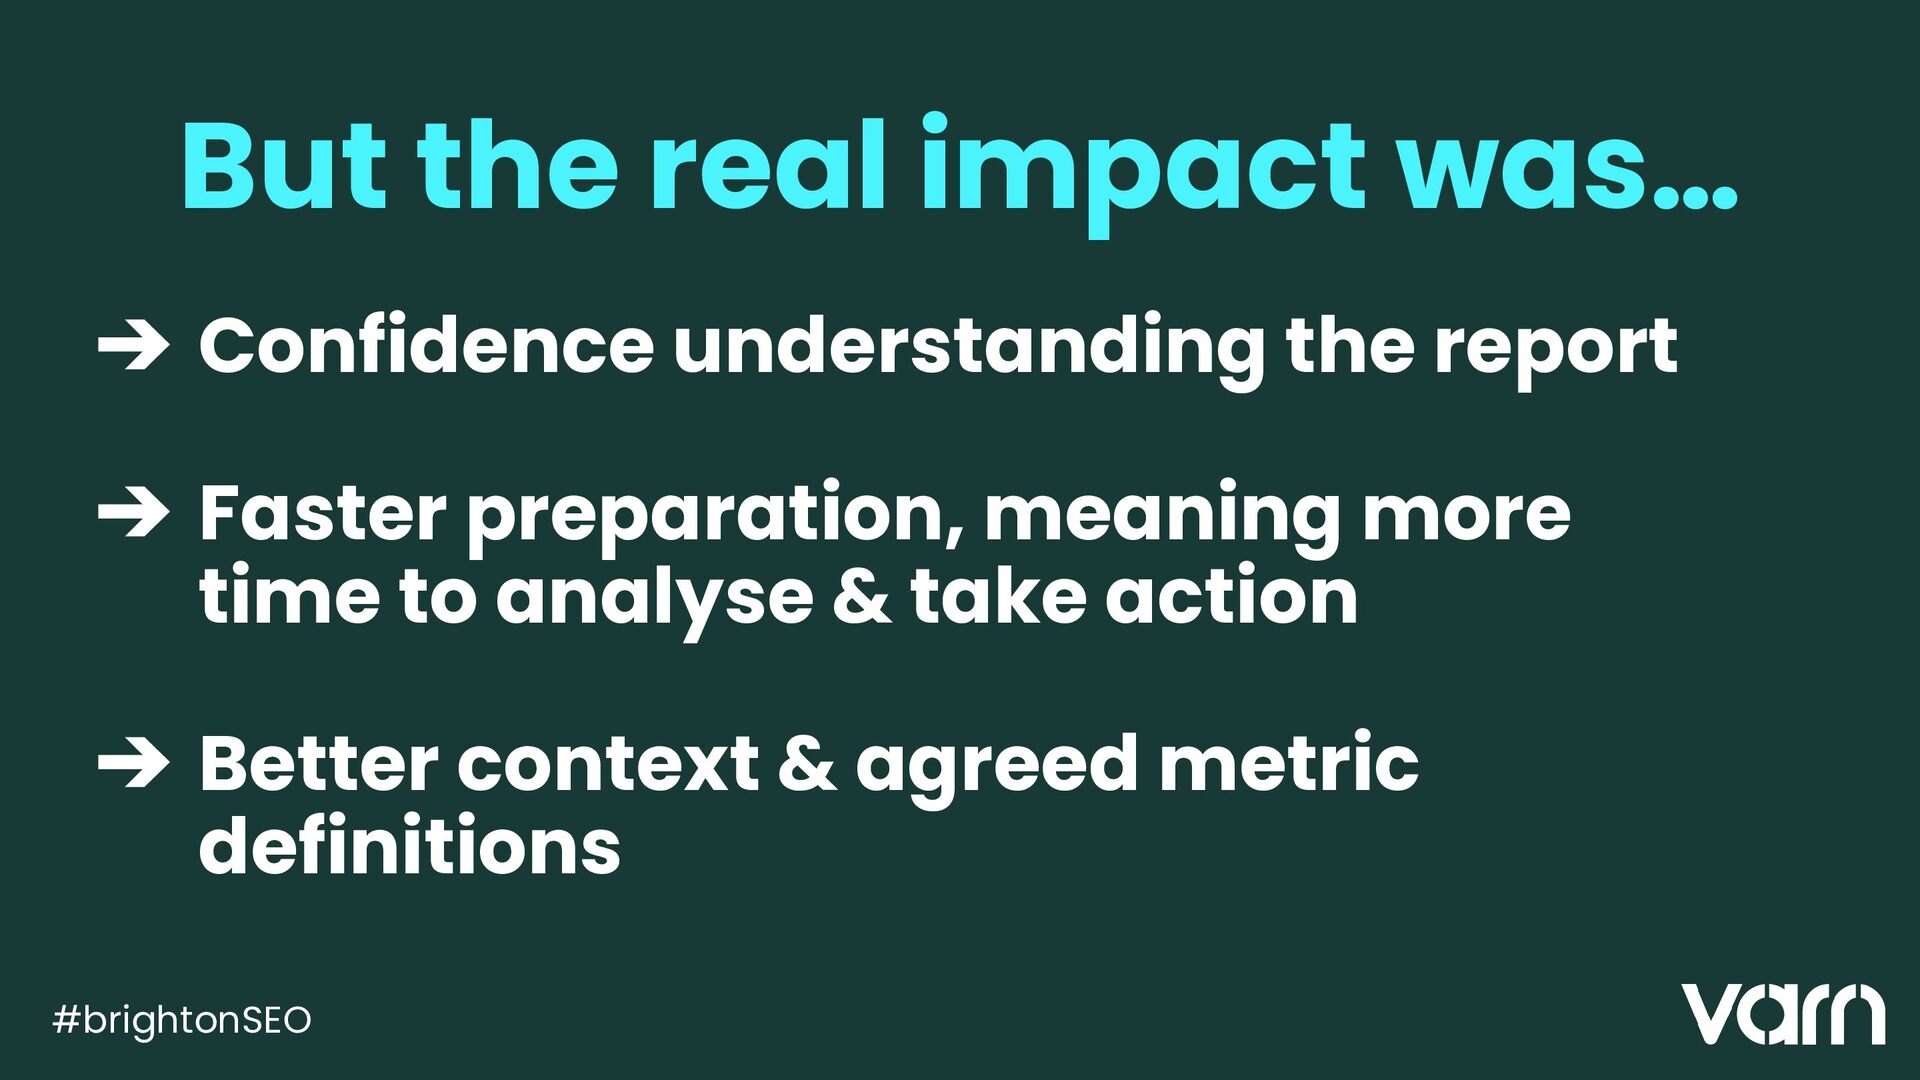
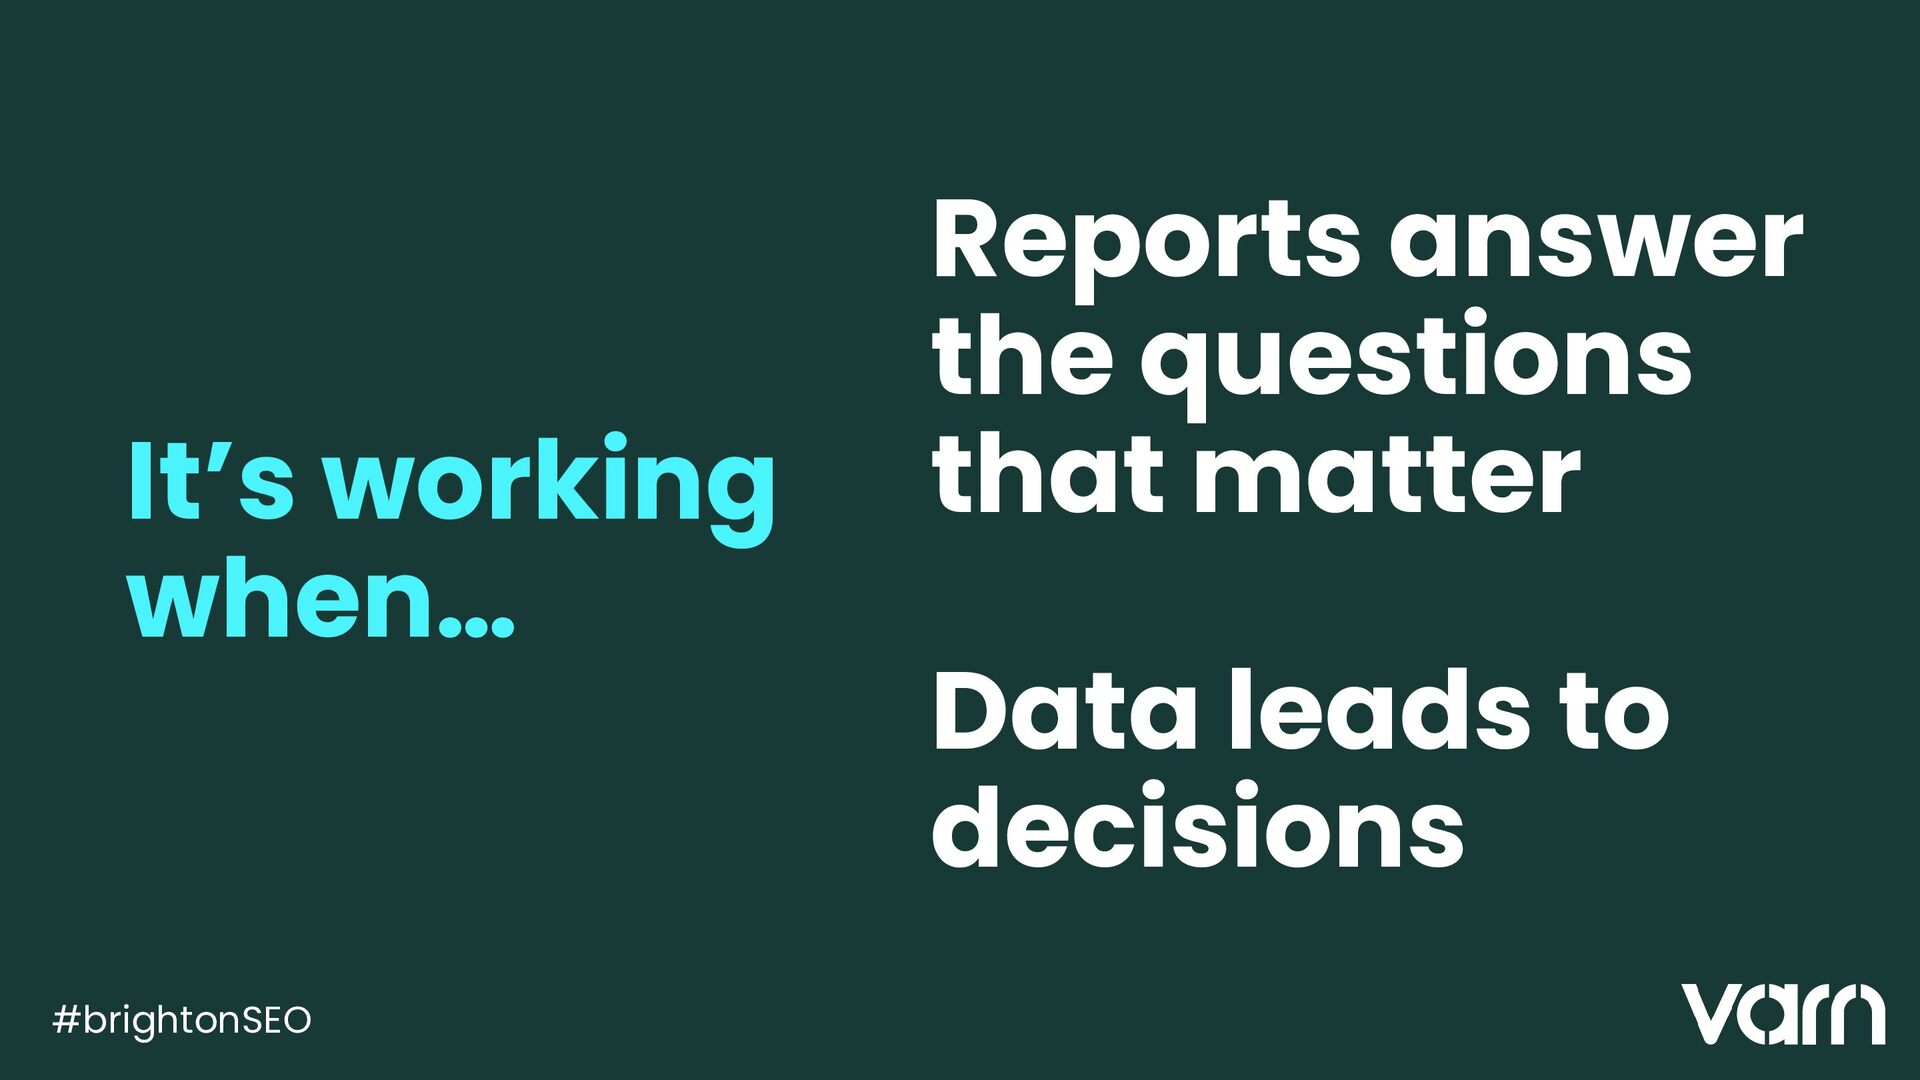
They’re packed with information, presenting reams of data, yet still fail to answer the questions stakeholders actually care about. When reports don’t lead to understanding or action, strategies lose momentum and valuable opportunities are missed.
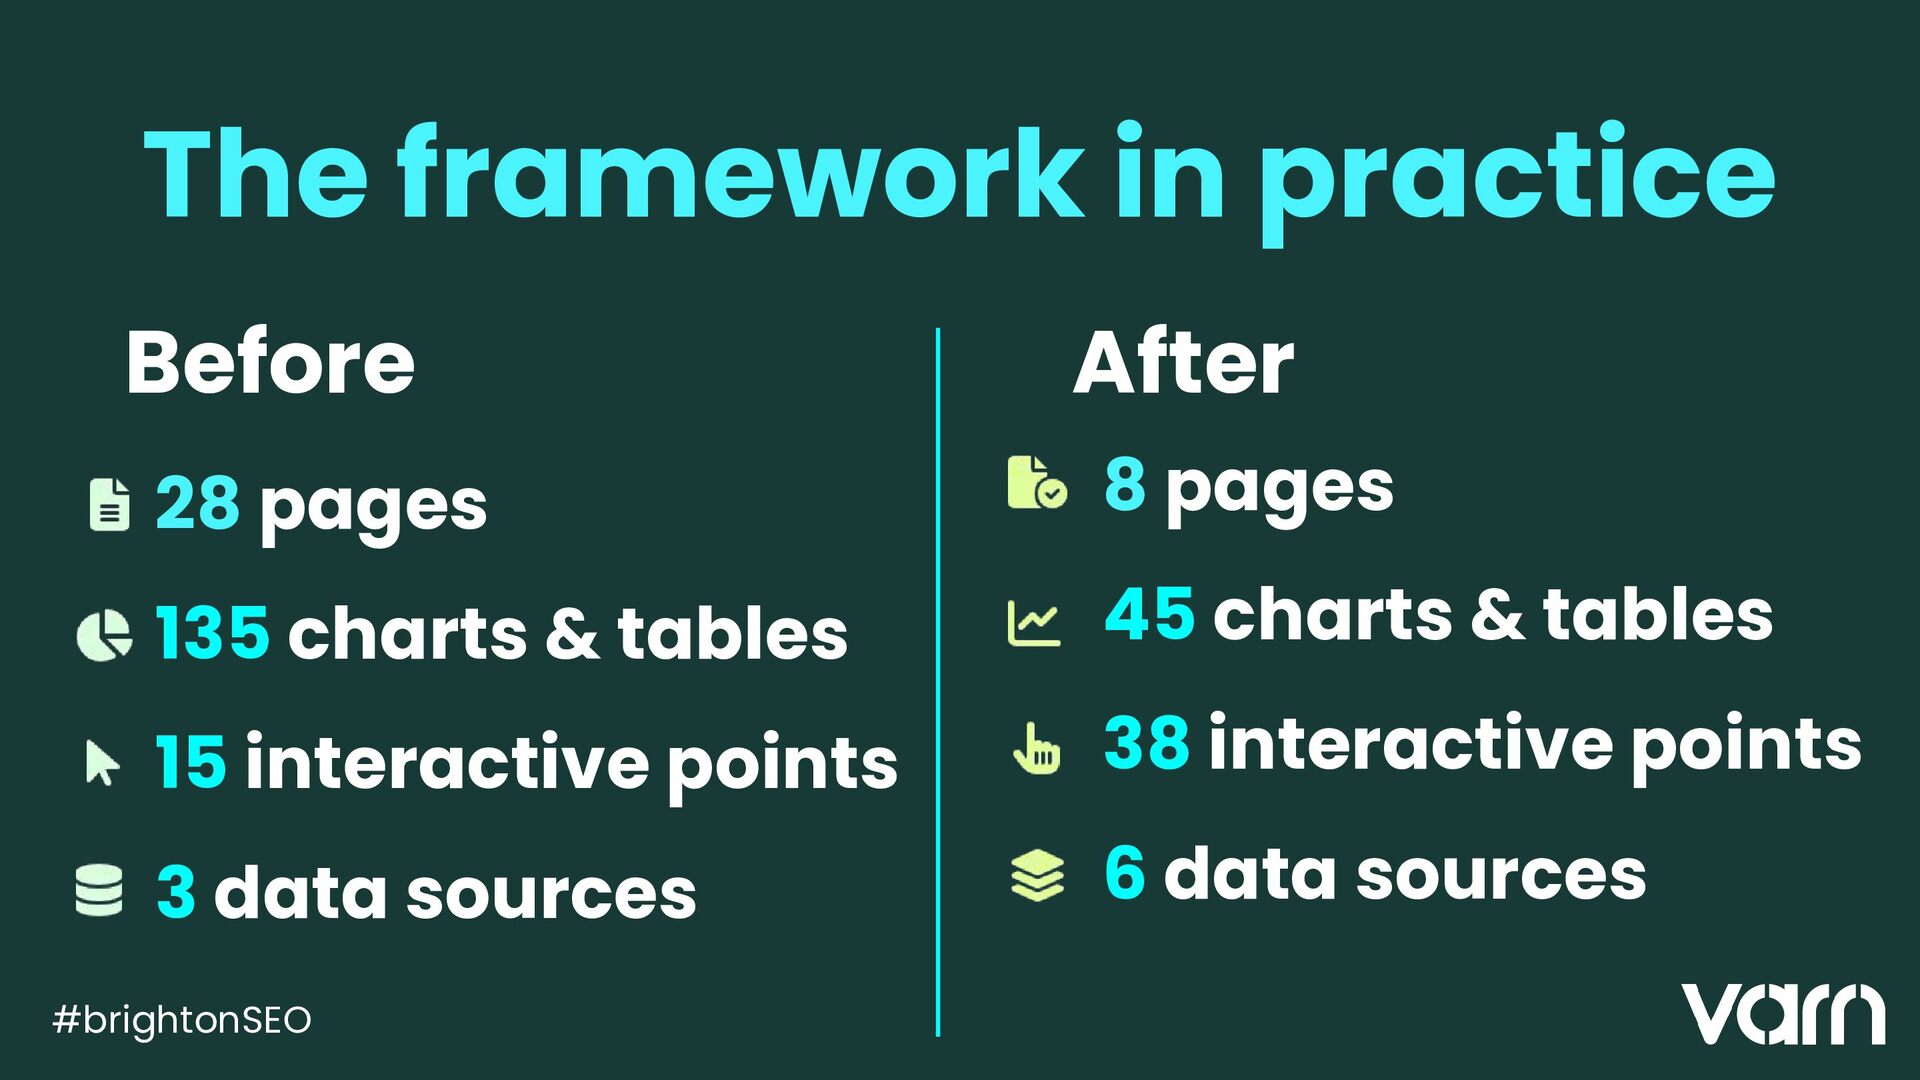
In this practical session, Katie New of Varn challenges the traditional metrics-first approach to reporting and introduces a smarter alternative: working backwards.
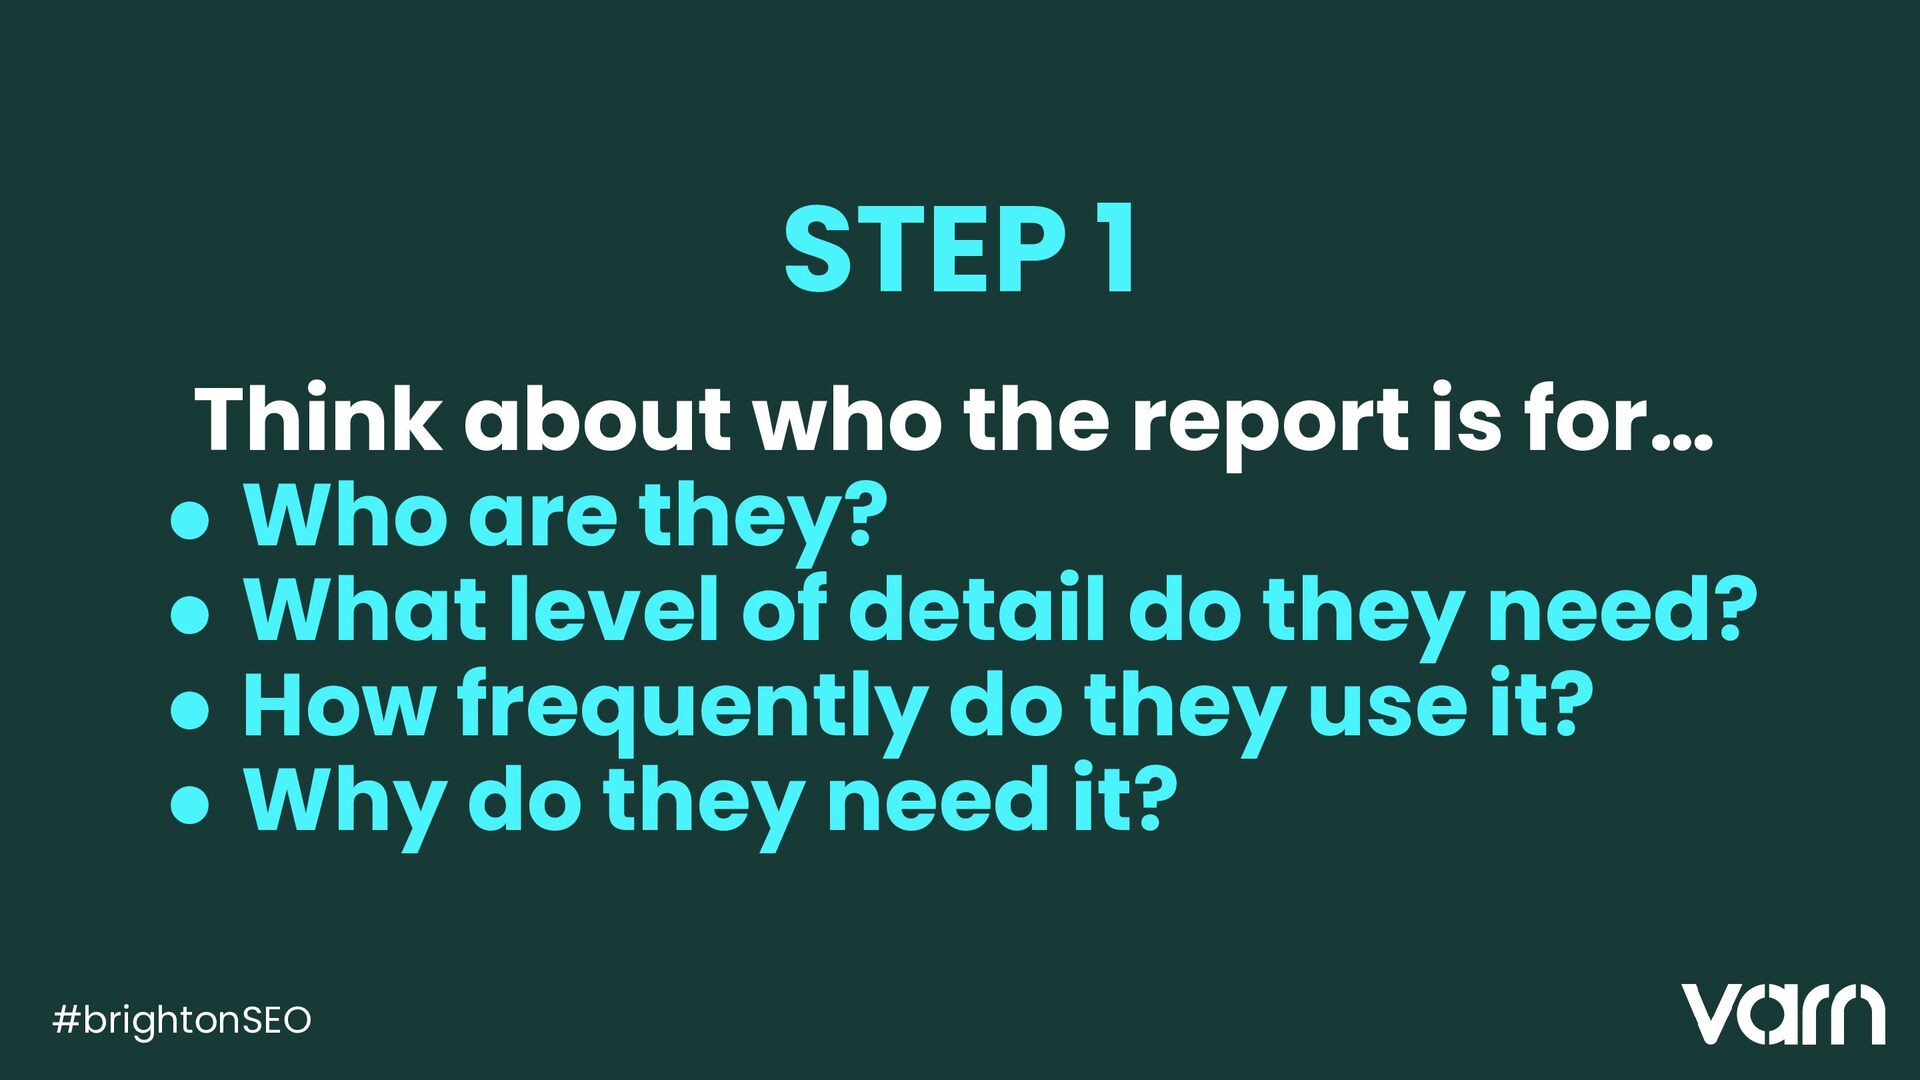
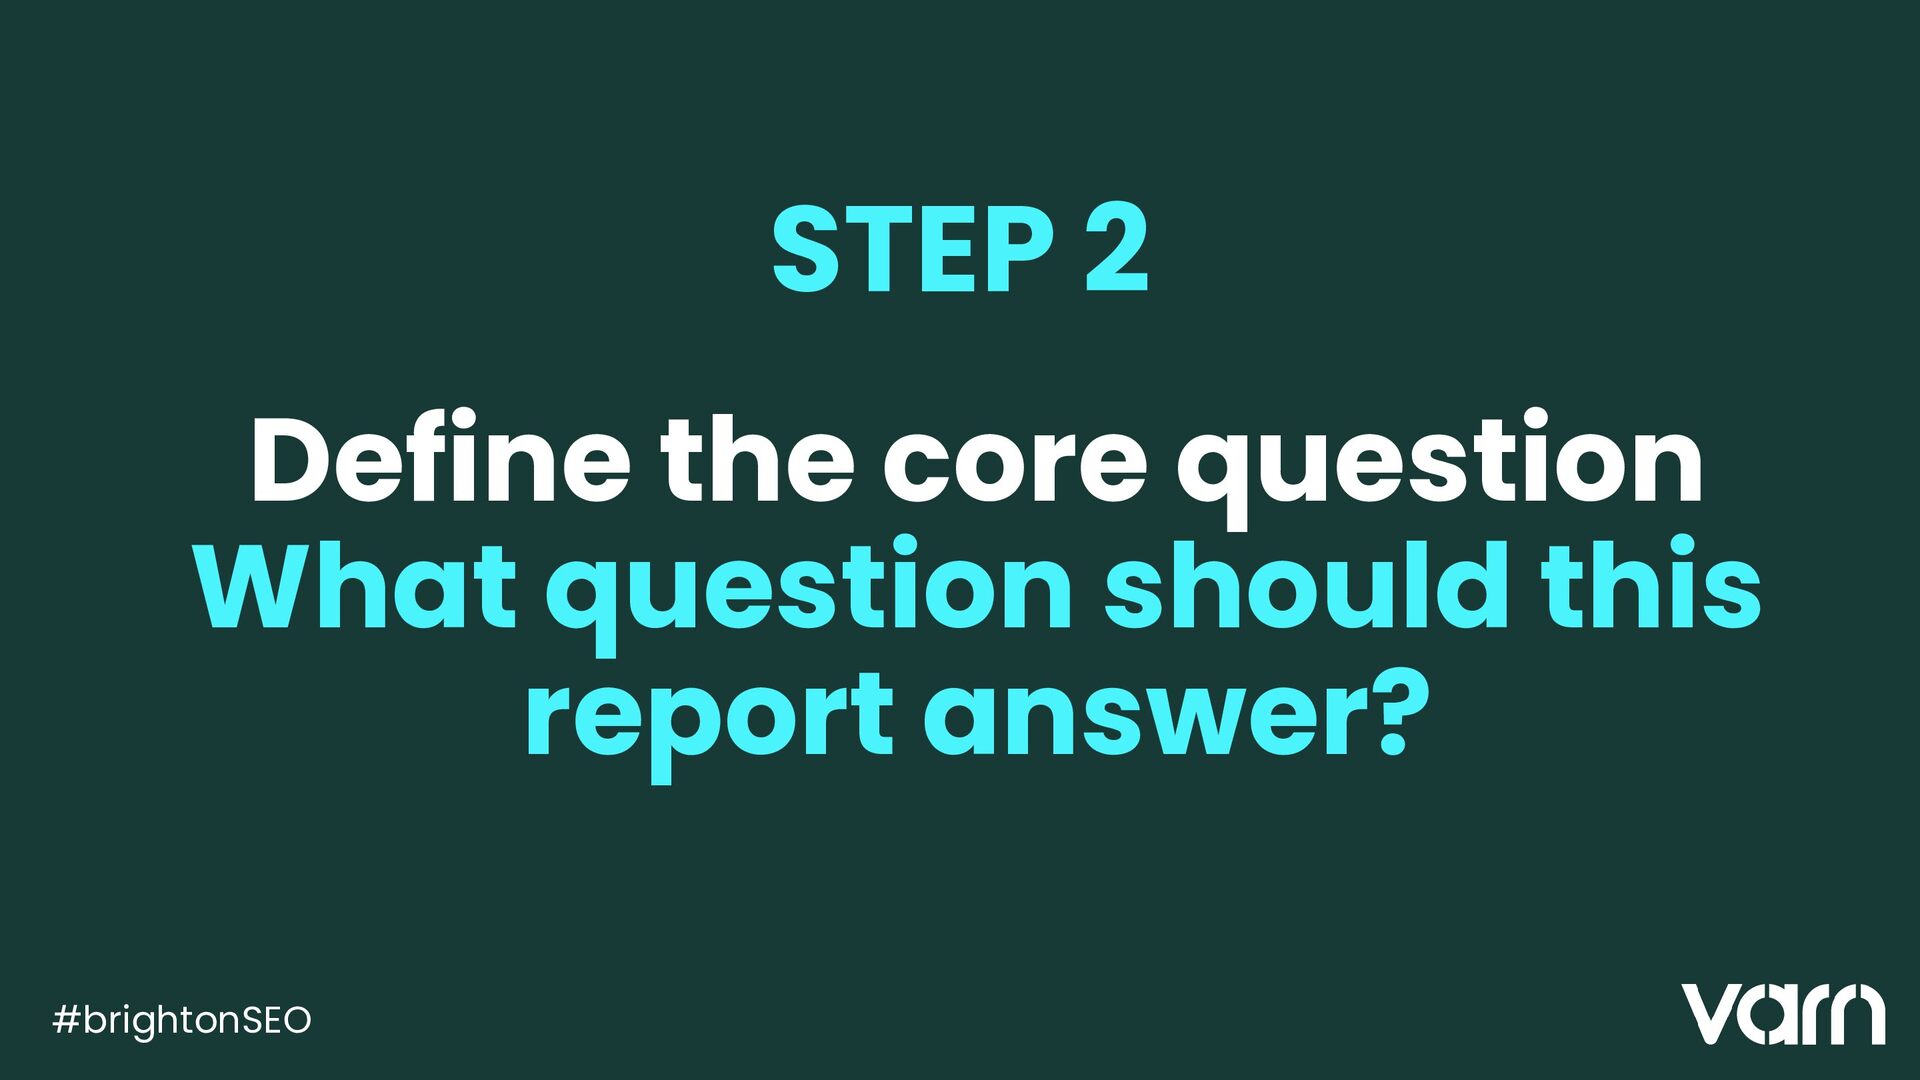
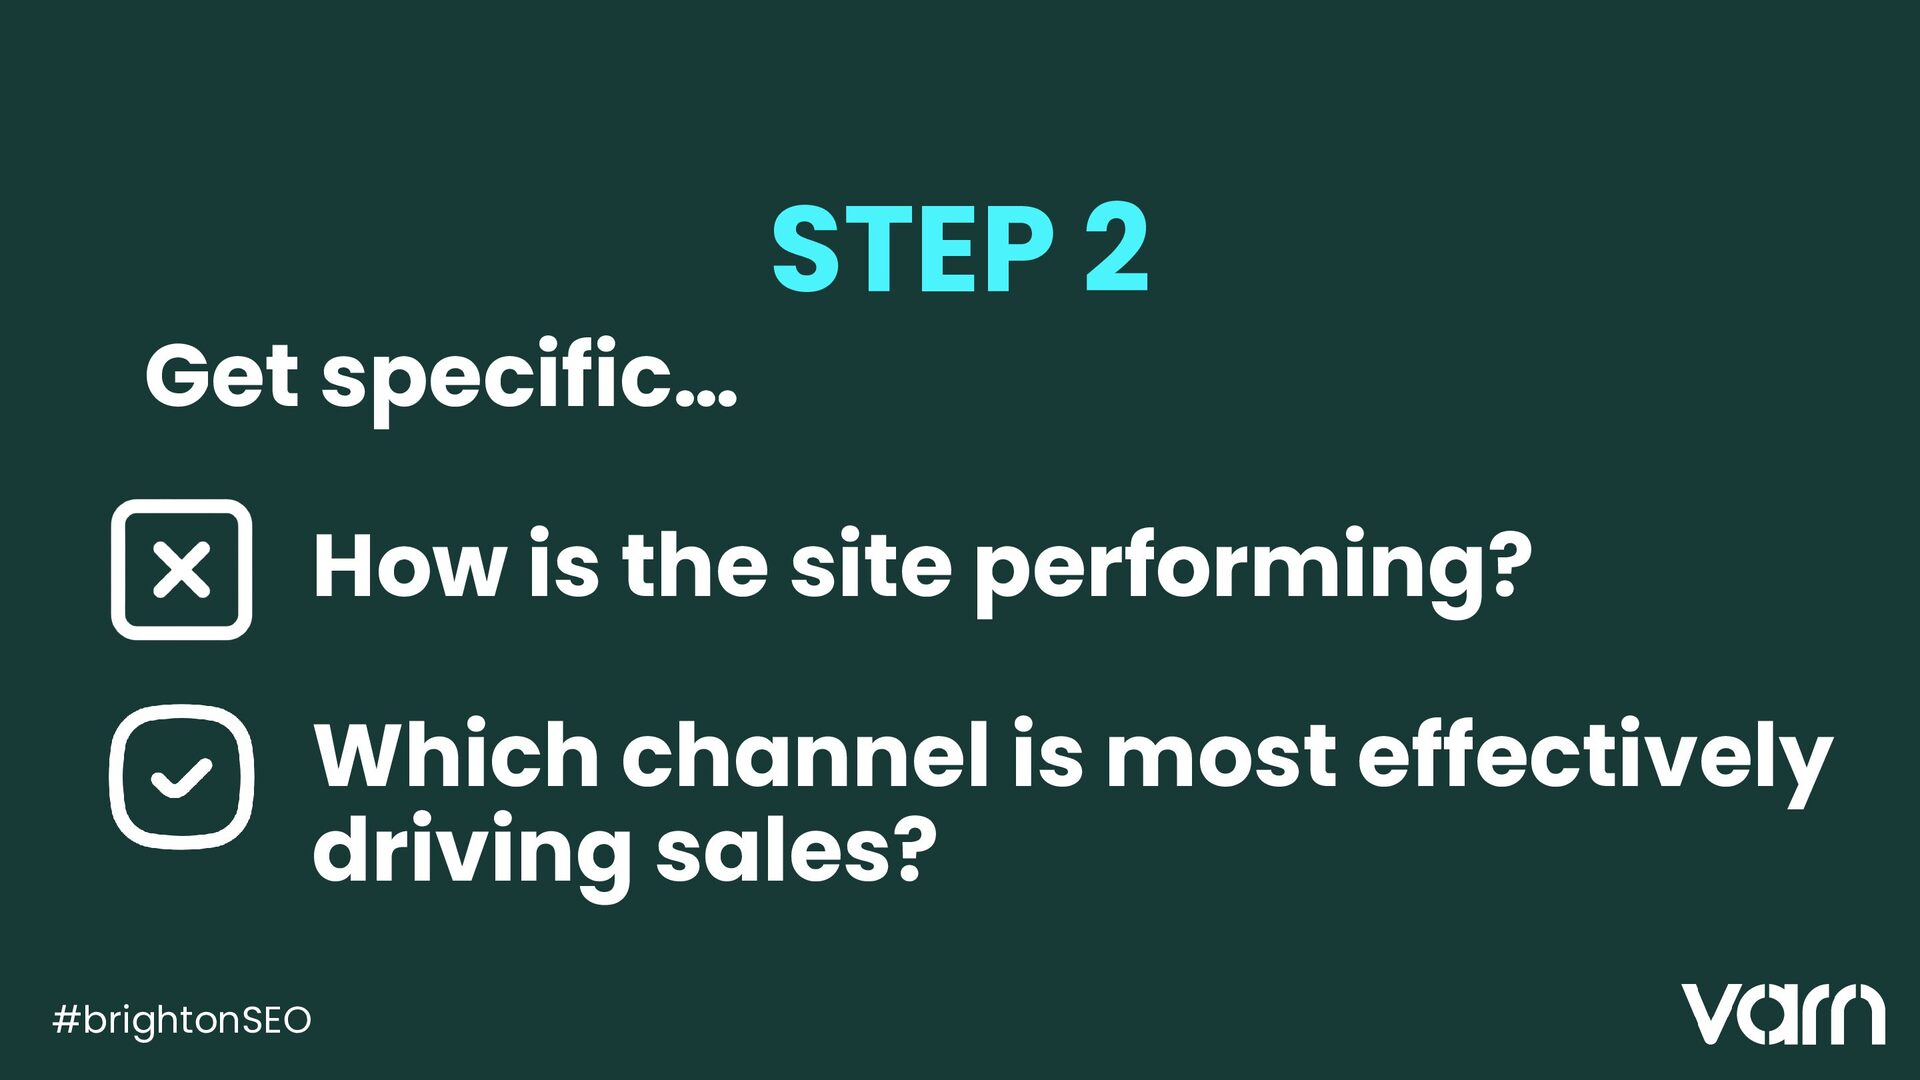
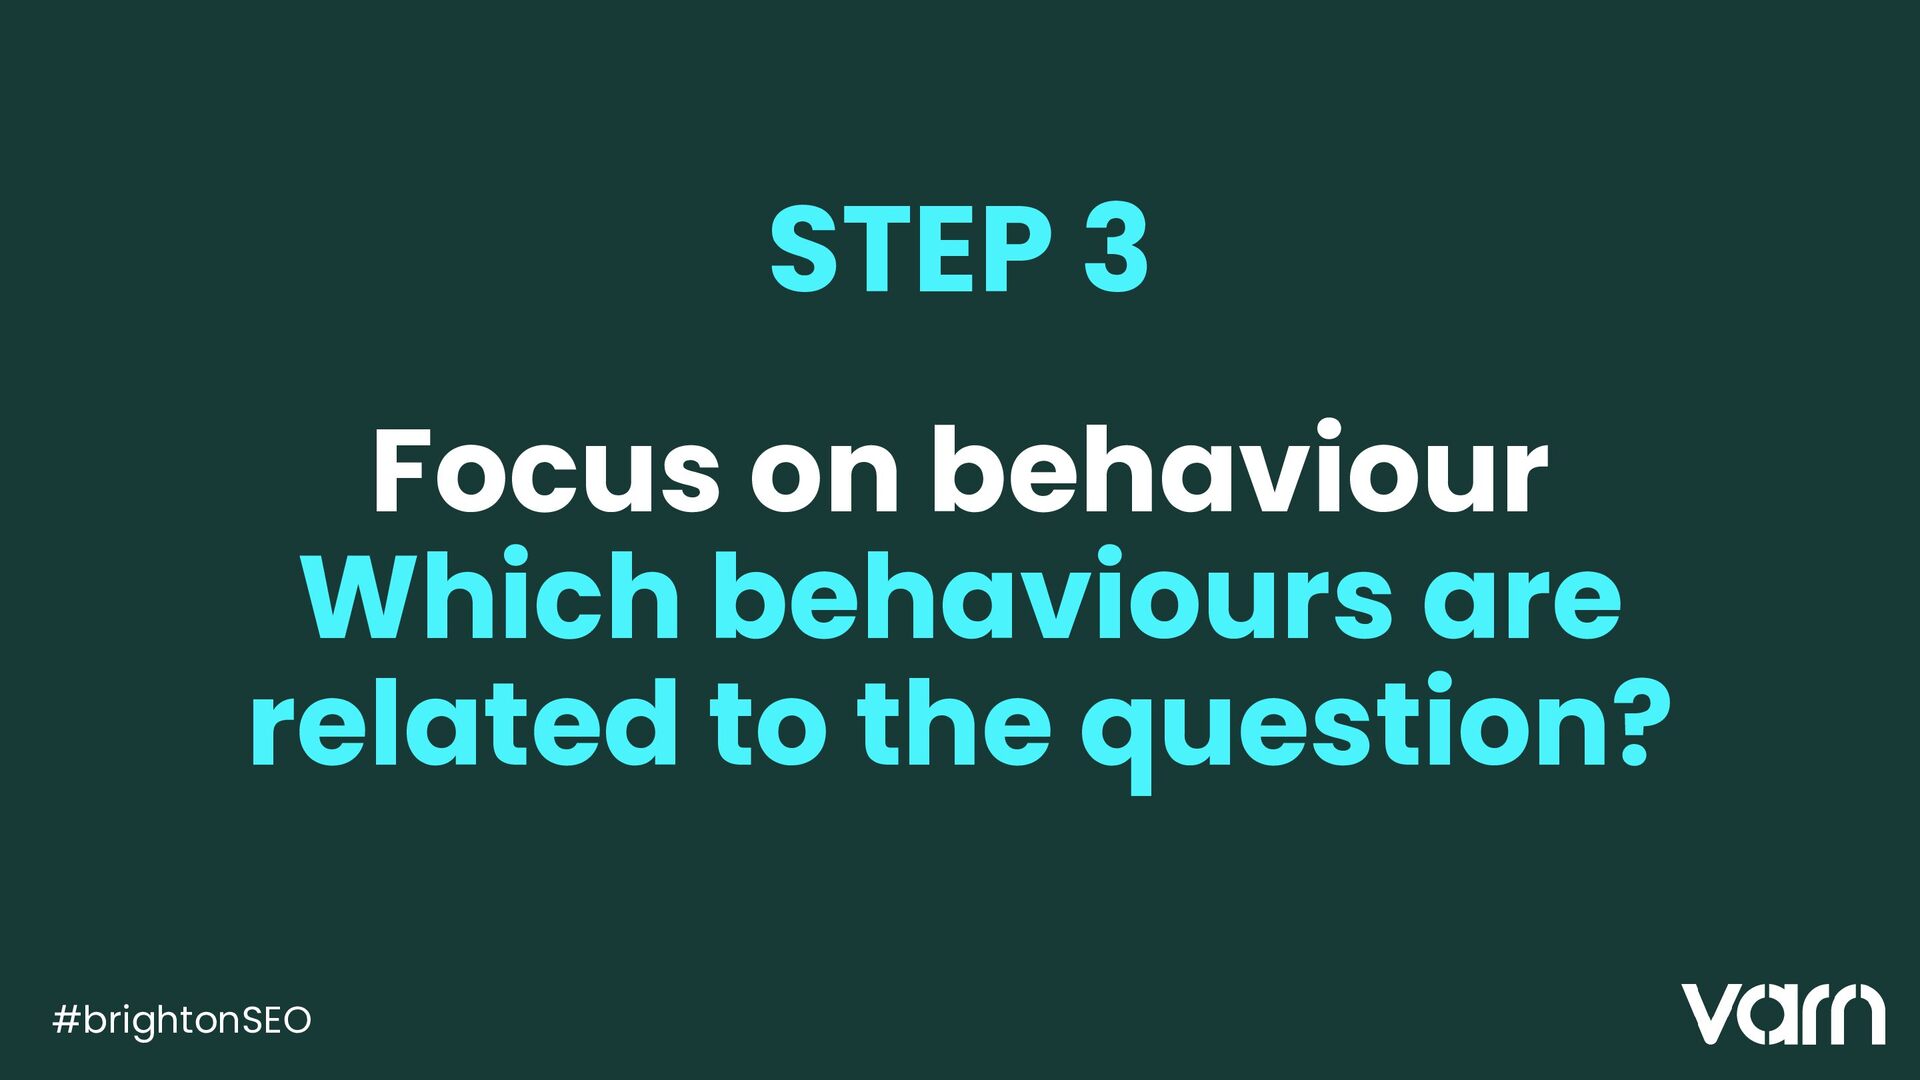
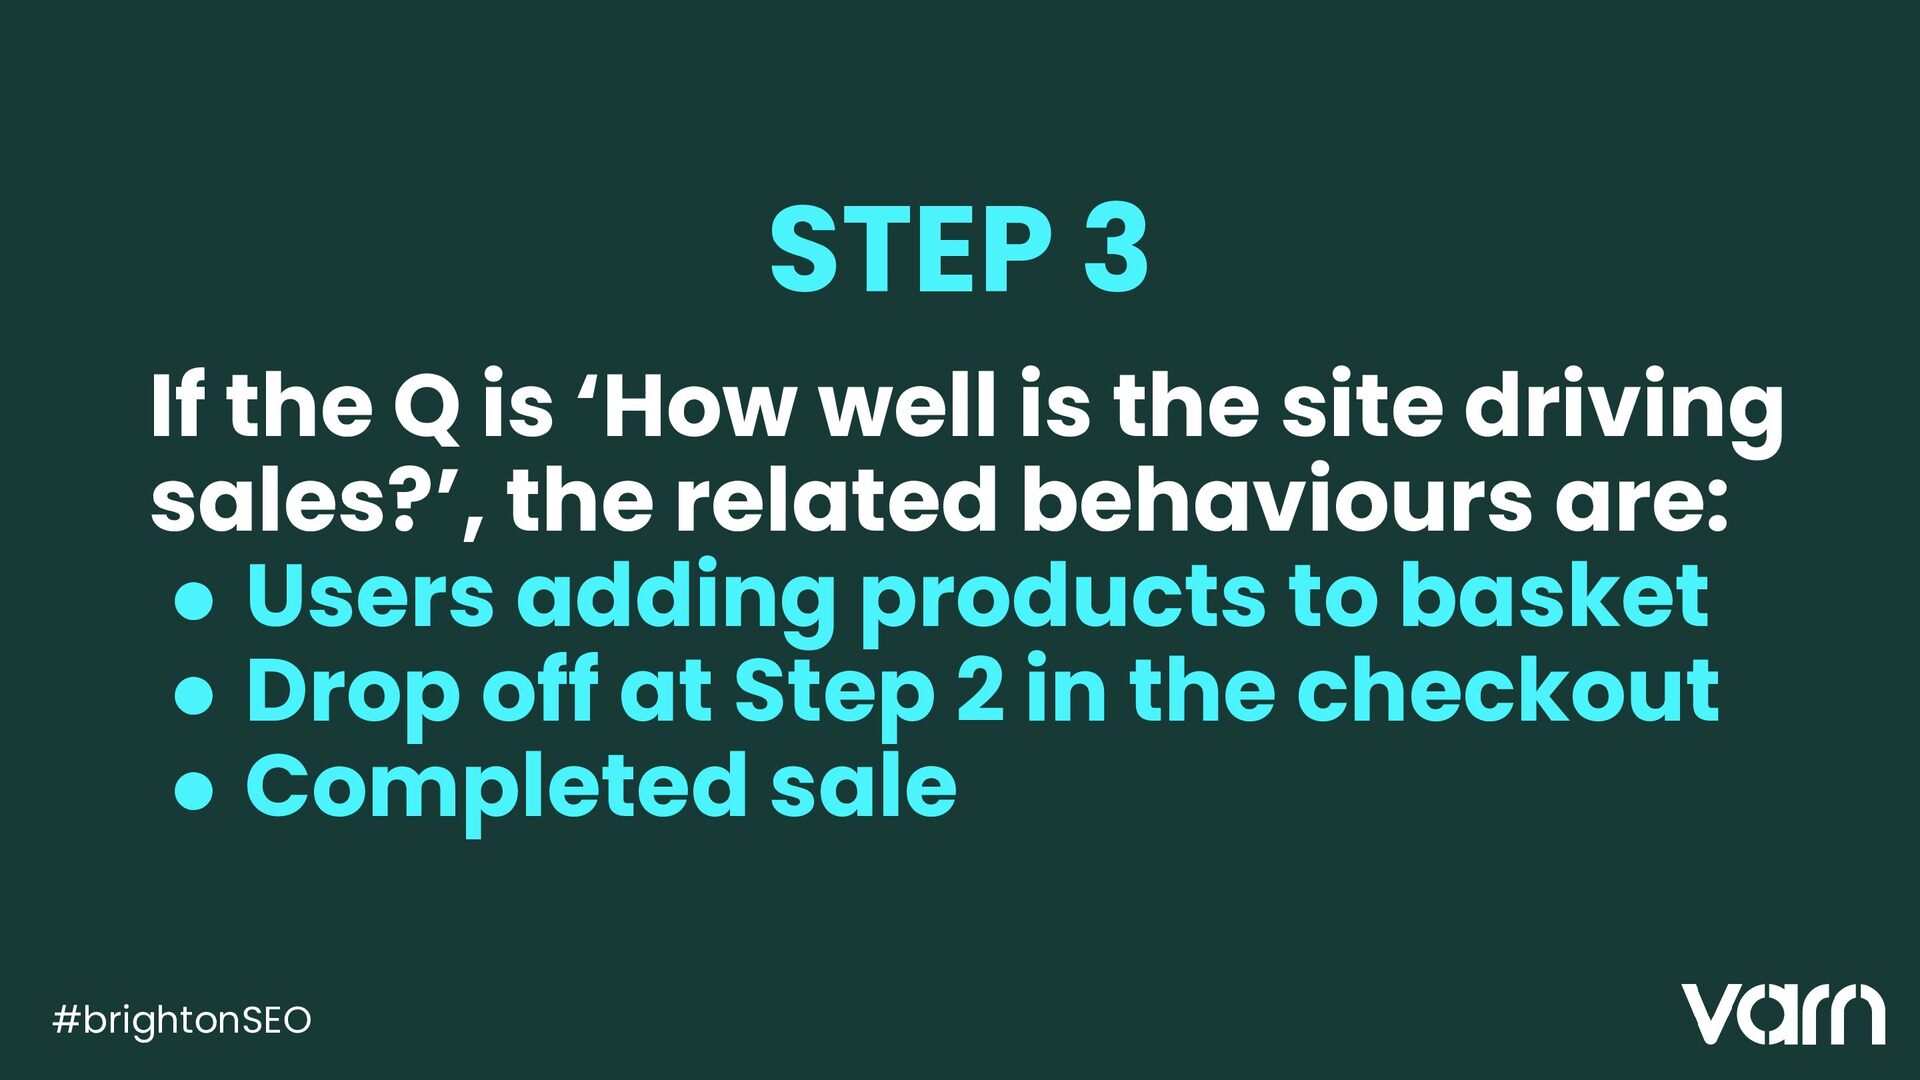
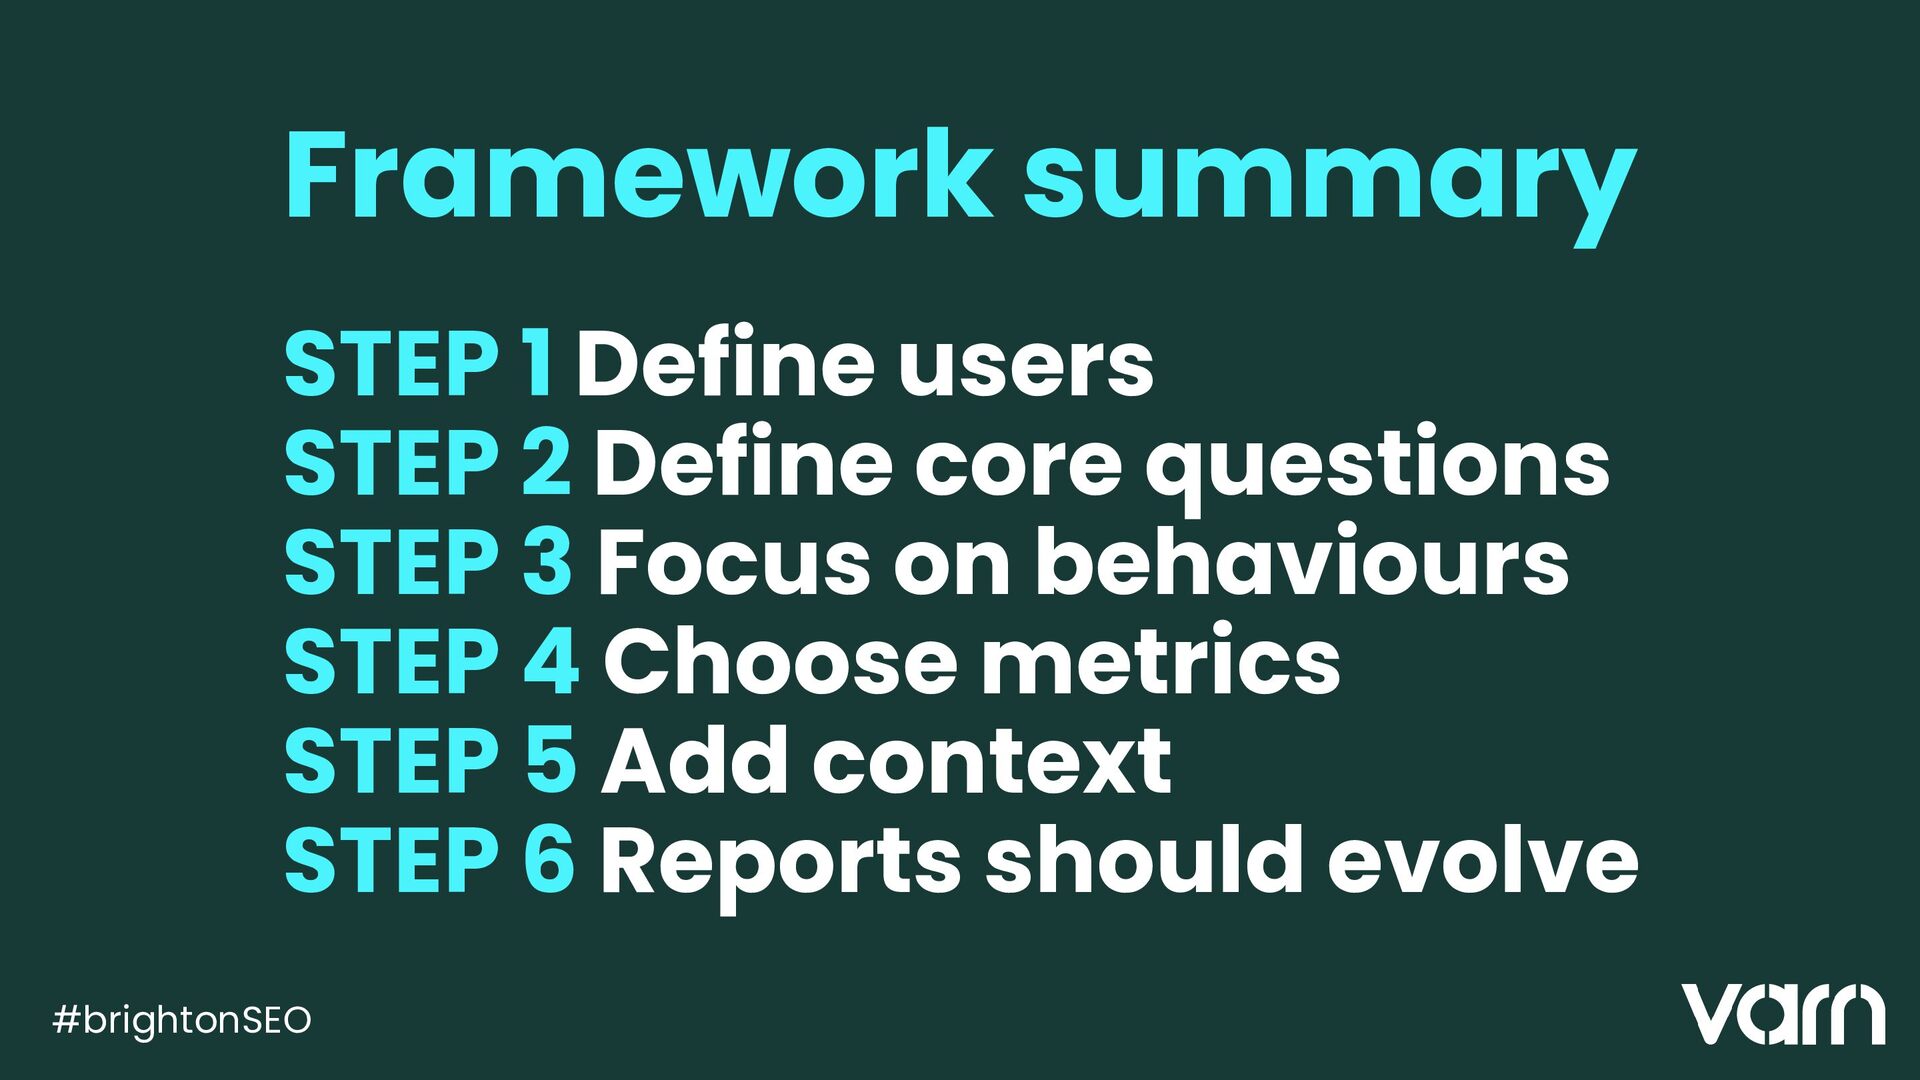
Instead of leading with metric selection, Katie starts at the end, focusing first on the people who will use the report and the questions they need answered. She will share a clear, practical framework for reverse-engineering reports that are user-led, question-driven, and designed to prompt action.
You will gain access to practical resources you can use straight away including a downloadable reporting survey designed to transform your reports from passive monthly updates, into powerful catalysts for action and results that matter. Katie will also introduce a simple feedback system to ensure your reporting remains meaningful and focused. If you want reports that get read, understood, and acted on, this talk will show you how to build them, starting from the end.