Upgrade to Pro
— share decks privately, control downloads, hide ads and more …
Speaker Deck
Features
Speaker Deck
PRO
Sign in
Sign up for free
Search
Search
Talk about Data Experience at GIPO webinar 2015...
Search
Sponsored
·
Ship Features Fearlessly
Turn features on and off without deploys. Used by thousands of Ruby developers.
→
visup
October 26, 2015
Technology
99
0
Share
Talk about Data Experience at GIPO webinar 2015/10/25
visup
October 26, 2015
More Decks by visup
See All by visup
VISUP Lunch Seminar @ SpazioDati - 20141010
visup
0
43
Other Decks in Technology
See All in Technology
AzureのIaC管理からログ調査まで、随所に役立つSkillsとCustom-Instructions / Boosting IaC and Log Analysis with Skills
aeonpeople
0
110
申請待ちゼロへ!AWS × Entra IDで実現した「権限付与」のセルフサービス化
mhrtech
2
330
KGDC_13_Amazon Q Developerで挑む! 13事例から見えたAX組織変革の最前線_公開情報
kikugawa
0
110
2026年に相応しい 最先端プラグインホストの設計<del>と実装</del>
atsushieno
0
130
DevOpsDays Tokyo 2026 軽量な仕様書と新たなDORA AI ケイパビリティで実現する、動くソフトウェアを中心とした開発ライフサイクル / DevOpsDays Tokyo 2026
n11sh1
0
150
Azure PortalなどにみるWebアクセシビリティ
tomokusaba
0
370
AI時代にデータ基盤が持つべきCapabilityを考える + Snowflake Data Superheroやっていき宣言 / Considering the Capabilities Data Platforms Should Have in the AI Era + Declaration of Commitment as a Snowflake Data Superhero
civitaspo
0
110
ARIA Notifyについて
ryokatsuse
1
120
システムは「動く」だけでは足りない 実装編 - 非機能要件・分散システム・トレードオフをコードで見る
nwiizo
4
410
研究開発部メンバーの働き⽅ / Sansan R&D Profile
sansan33
PRO
4
23k
EBS暗号化に失敗してEC2が動かなくなった話
hamaguchimmm
2
170
Code Interpreter で、AIに安全に コードを書かせる。
yokomachi
0
6.9k
Featured
See All Featured
Practical Tips for Bootstrapping Information Extraction Pipelines
honnibal
25
1.8k
Discover your Explorer Soul
emna__ayadi
2
1.1k
Exploring the relationship between traditional SERPs and Gen AI search
raygrieselhuber
PRO
2
3.8k
Sharpening the Axe: The Primacy of Toolmaking
bcantrill
46
2.8k
Kristin Tynski - Automating Marketing Tasks With AI
techseoconnect
PRO
0
220
How to Grow Your eCommerce with AI & Automation
katarinadahlin
PRO
1
170
The Psychology of Web Performance [Beyond Tellerrand 2023]
tammyeverts
49
3.4k
How People are Using Generative and Agentic AI to Supercharge Their Products, Projects, Services and Value Streams Today
helenjbeal
1
160
Scaling GitHub
holman
464
140k
Navigating Weather and Climate Data
rabernat
0
170
Highjacked: Video Game Concept Design
rkendrick25
PRO
1
340
Keith and Marios Guide to Fast Websites
keithpitt
413
23k
Transcript
VISUP #dataexperience Gabriele Venier - VISUP srl GIPO Webinar -
2015/10/26 Introduction to Data Visualization
VISUP #dataexperience Data Experience
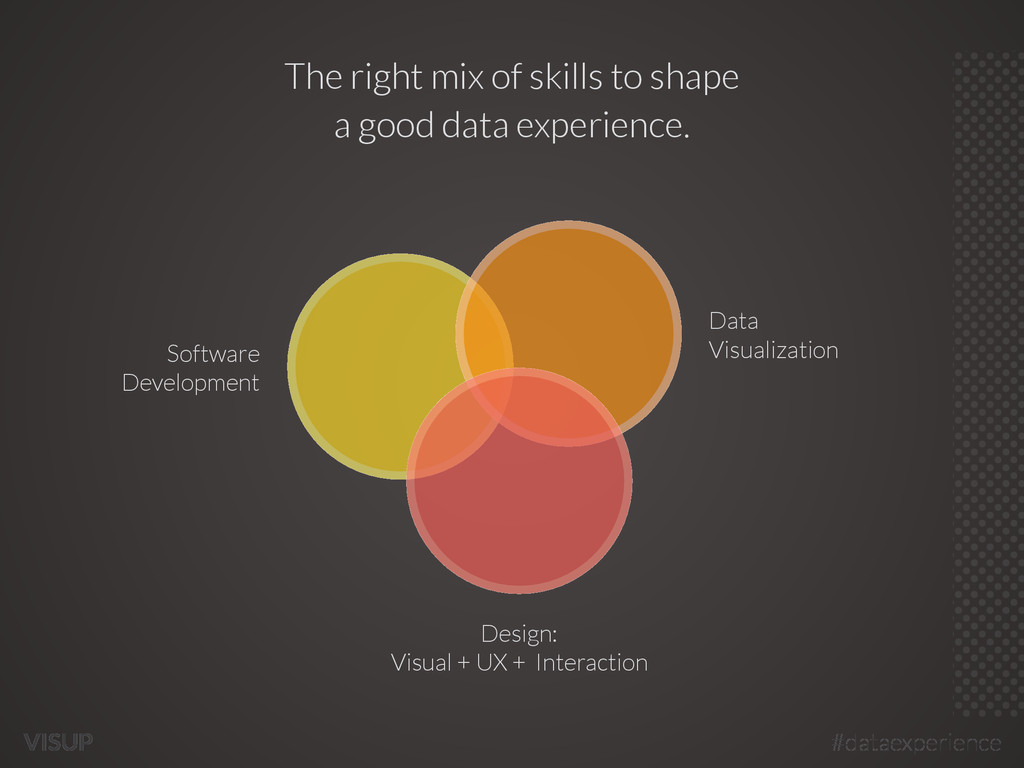
VISUP #dataexperience Software Development Data Visualization Design: Visual + UX
+ Interaction The right mix of skills to shape a good data experience.
VISUP #dataexperience 5 ingredients to cook effective Data Experiences
VISUP #dataexperience #1. Know your Data
VISUP #dataexperience
VISUP #dataexperience #2. Know your Audience
VISUP #dataexperience
VISUP #dataexperience #3. Know the “Job to be done”
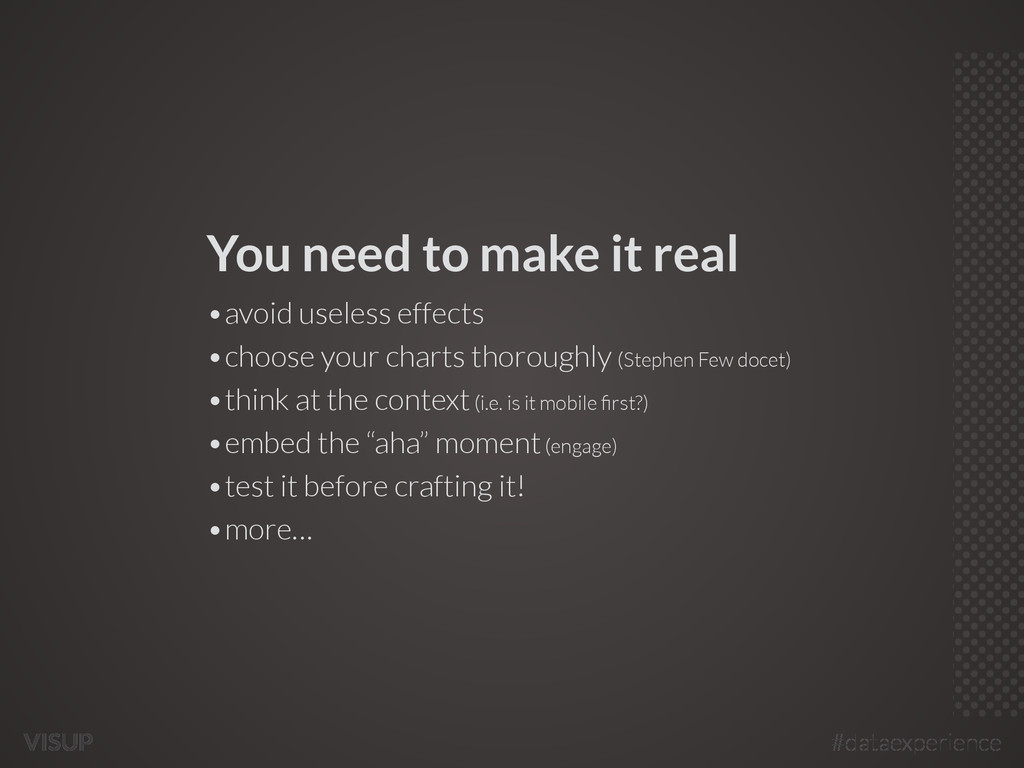
VISUP #dataexperience You need to make it real •avoid useless
effects •choose your charts thoroughly (Stephen Few docet) •think at the context (i.e. is it mobile first?) •embed the “aha” moment (engage) •test it before crafting it! •more…
VISUP #dataexperience #4. Make it nice…
VISUP #dataexperience Choose the right combination of colours, fonts and
sizes in relation to the Information Architecture Avoid overloads, UI should breath
VISUP #dataexperience … and Sharable #5 (mainly because you want
to enable discussions)
VISUP #dataexperience Examples (dealing with categories)
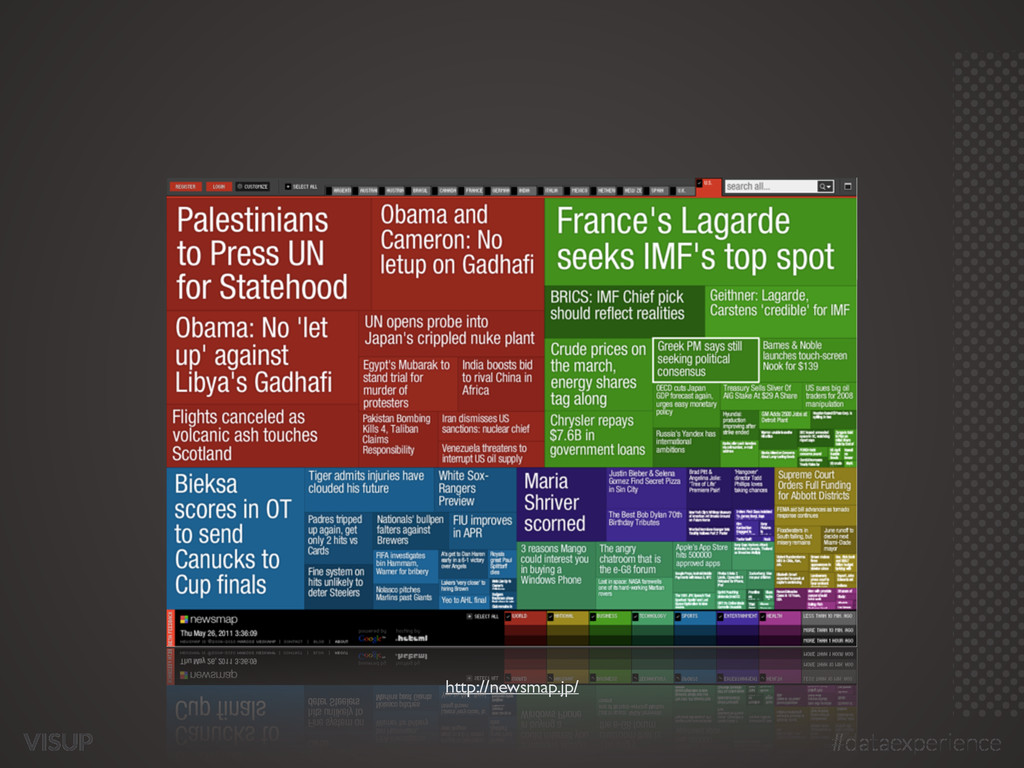
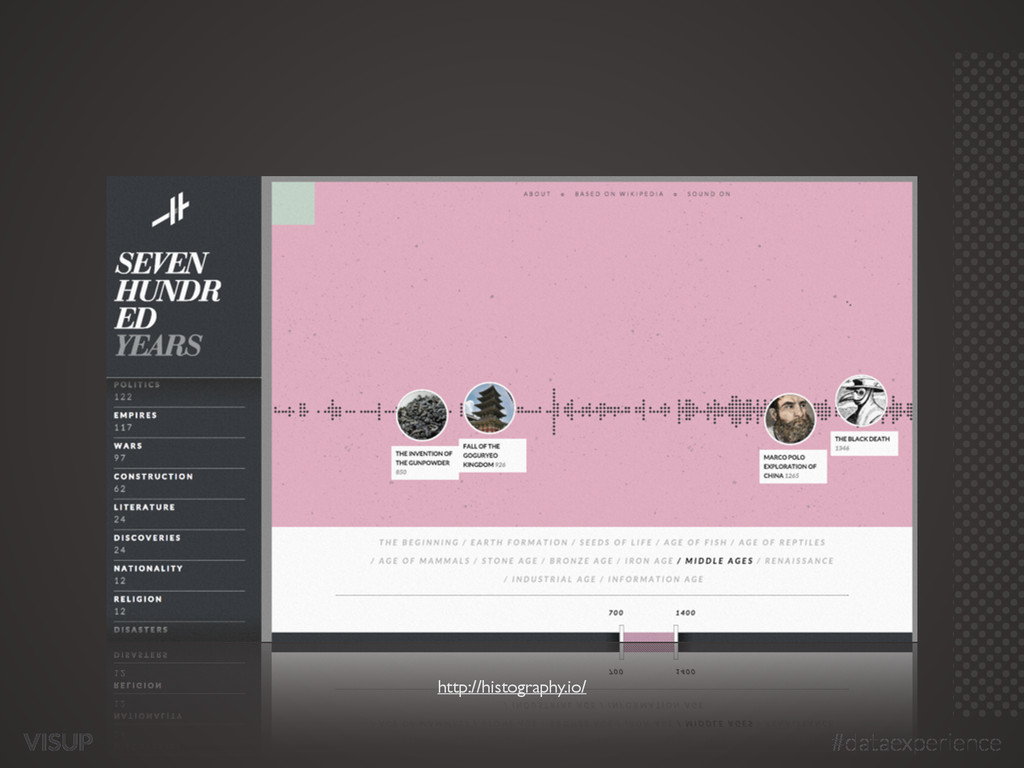
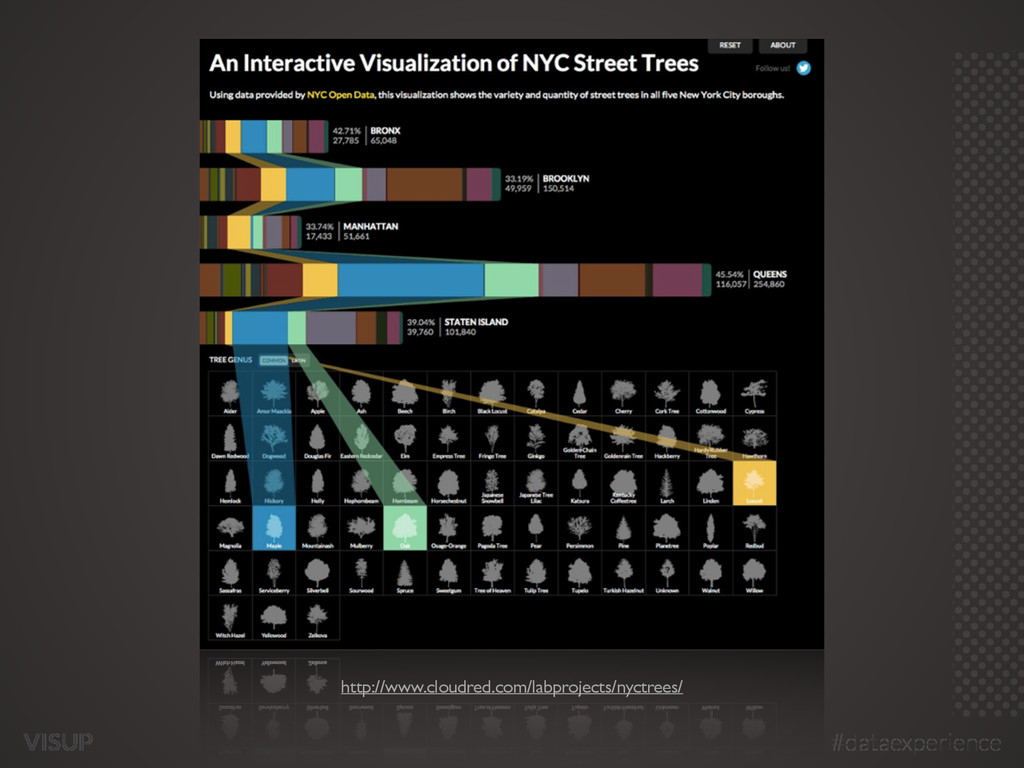
VISUP #dataexperience [clever interactivity] Customize the data experience
VISUP #dataexperience http://newsmap.jp/
VISUP #dataexperience http://histography.io/
VISUP #dataexperience http://www.cloudred.com/labprojects/nyctrees/
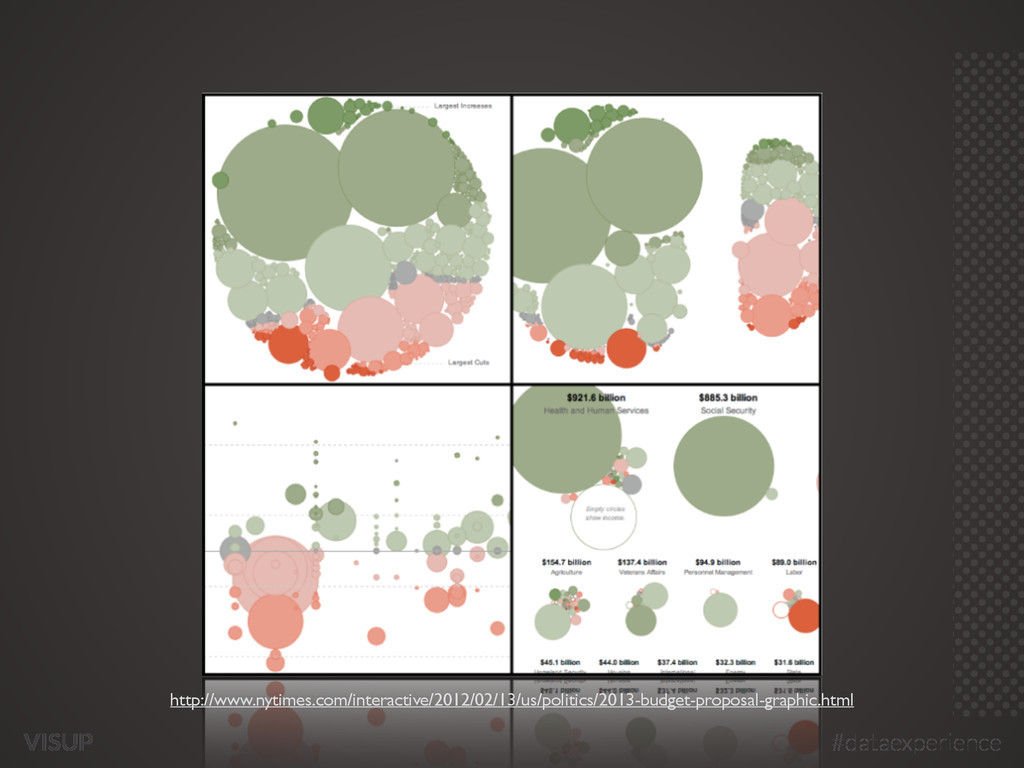
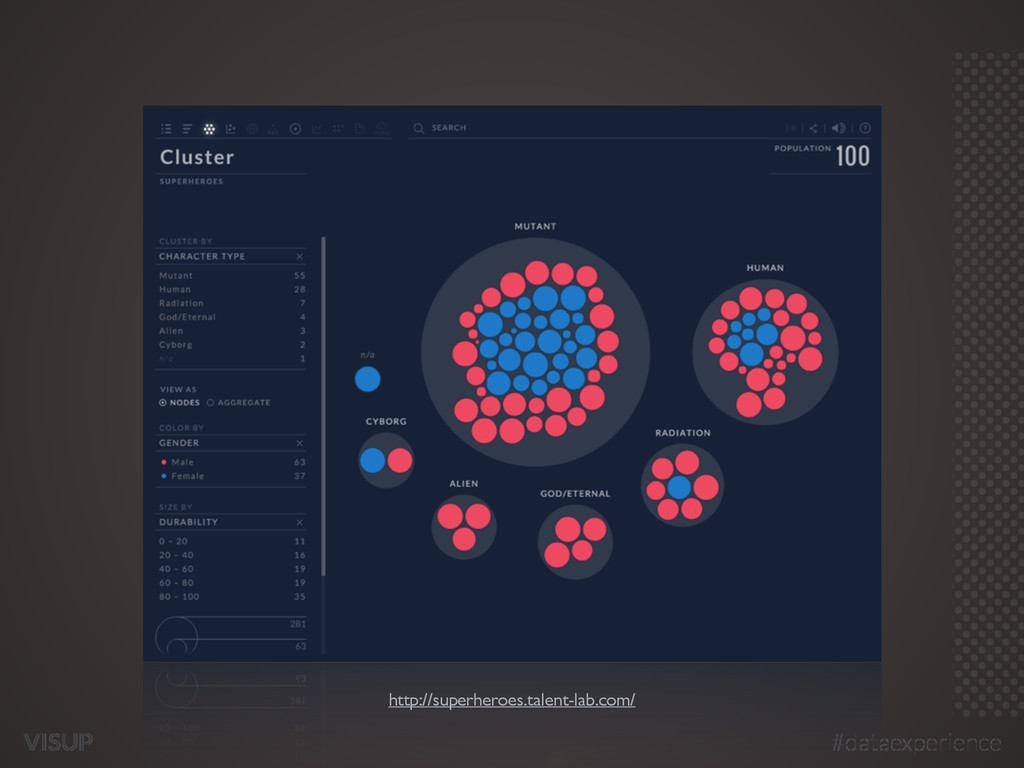
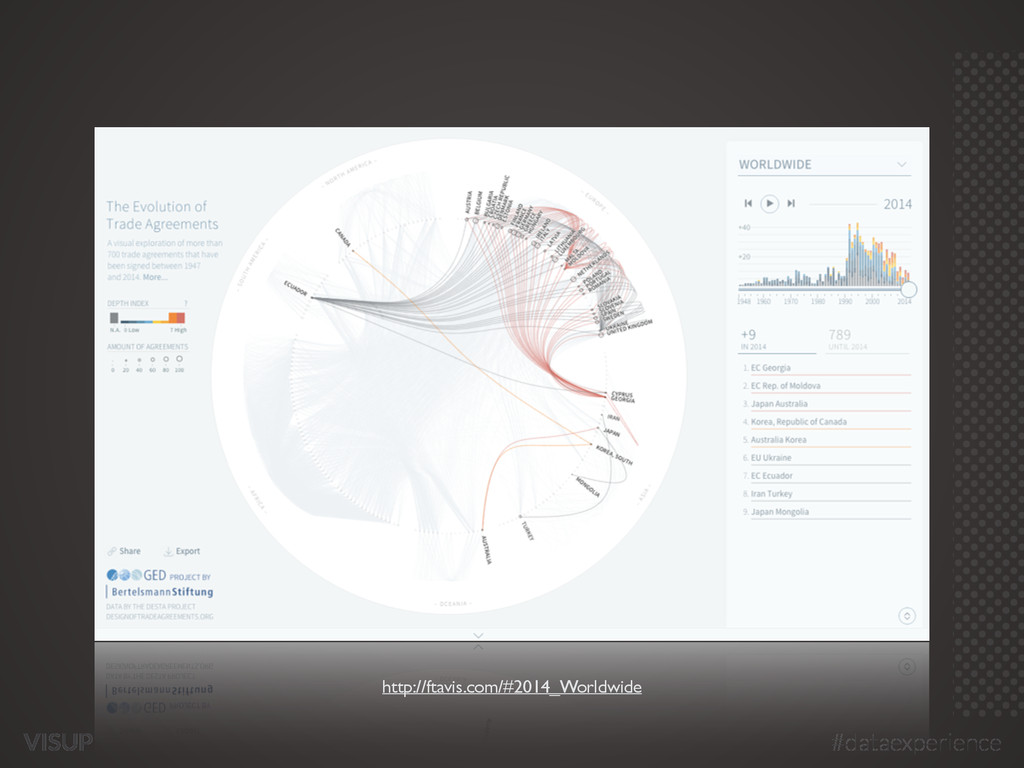
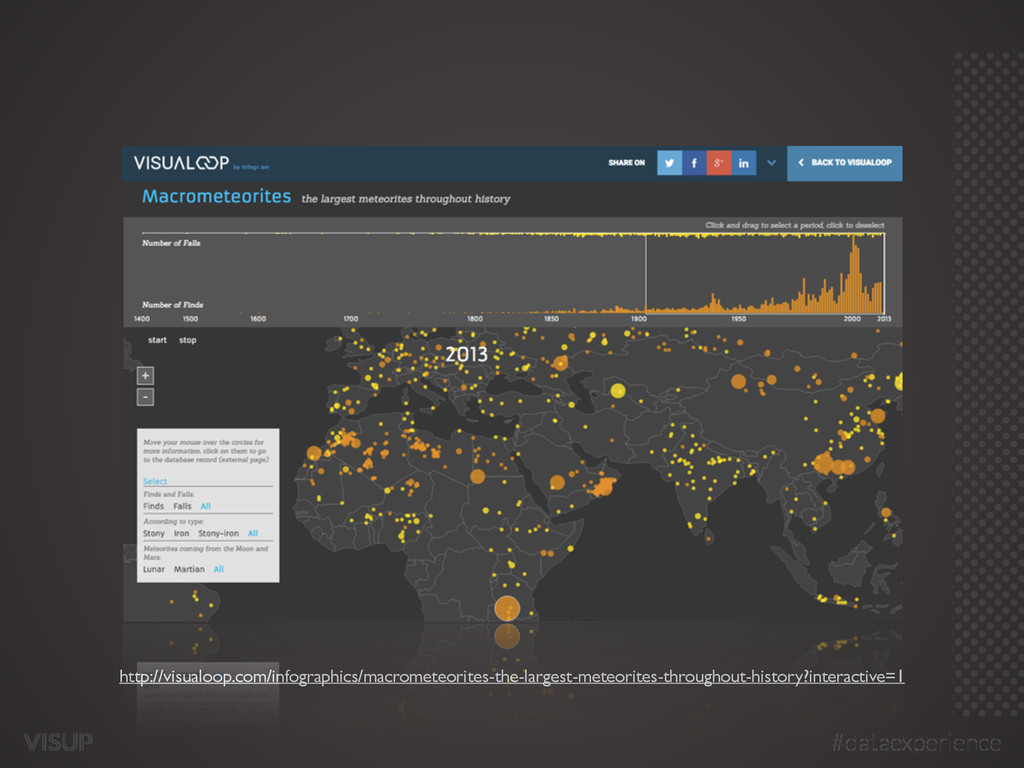
VISUP #dataexperience [contextual transitioning] Understand phenomena through animations
VISUP #dataexperience http://www.nytimes.com/interactive/2012/02/13/us/politics/2013-budget-proposal-graphic.html
VISUP #dataexperience http://superheroes.talent-lab.com/
VISUP #dataexperience http://ftavis.com/#2014_Worldwide
VISUP #dataexperience http://visualoop.com/infographics/macrometeorites-the-largest-meteorites-throughout-history?interactive=1
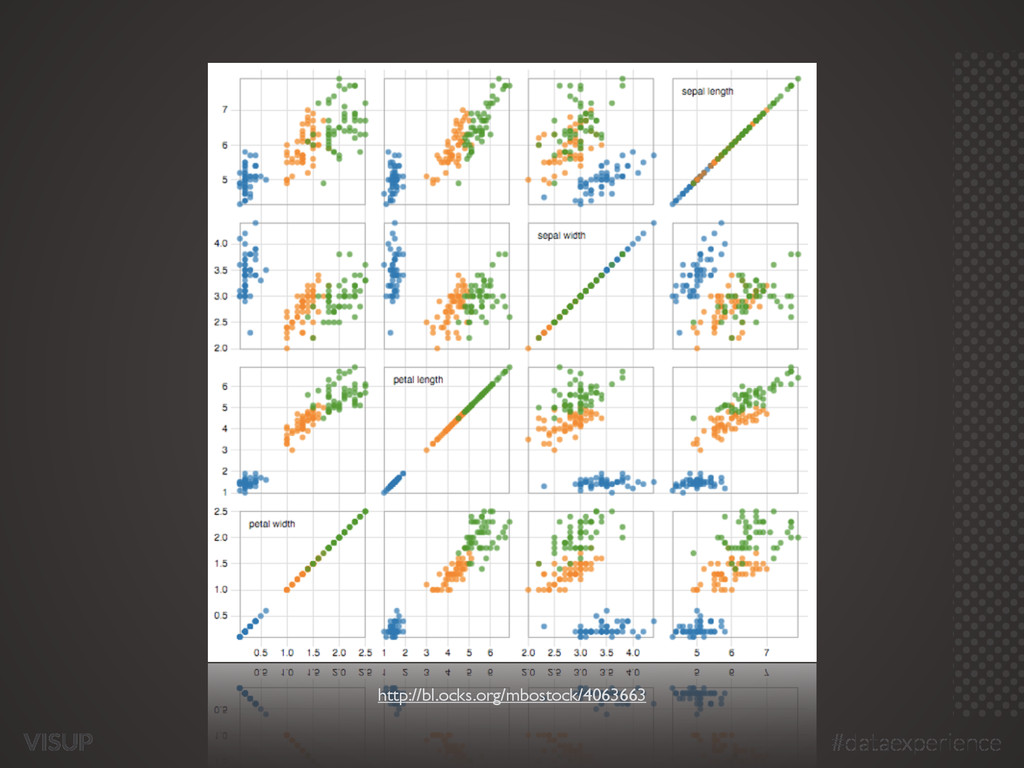
VISUP #dataexperience [multiview analysis] Understand phenomena through visual comparison
VISUP #dataexperience http://bl.ocks.org/mbostock/4063663
VISUP #dataexperience Gabriele Venier - VISUP
[email protected]
Thank you for
your time!
![VISUP #dataexperience [clever interactivity] Customize the data experience](https://files.speakerdeck.com/presentations/52dc98095d444a508783ea2e5507312e/slide_14.jpg)
![VISUP #dataexperience [contextual transitioning] Understand phenomena through animations](https://files.speakerdeck.com/presentations/52dc98095d444a508783ea2e5507312e/slide_18.jpg)
![VISUP #dataexperience [multiview analysis] Understand phenomena through visual comparison](https://files.speakerdeck.com/presentations/52dc98095d444a508783ea2e5507312e/slide_23.jpg)
![VISUP #dataexperience Gabriele Venier - VISUP [email protected] Thank you for](https://files.speakerdeck.com/presentations/52dc98095d444a508783ea2e5507312e/slide_25.jpg)